


 Arguments


Recent Comments
Prev 1261 1262 1263 1264 1265 1266 1267 1268 1269 1270 1271 1272 1273 1274 1275 1276 Next
Comments 63401 to 63450:
-
skywatcher at 13:57 PM on 20 February 2012Medieval Warm Period was warmer
muoncounter, Greenland settlement wasn't necessarily climate-limited - Medieval warmth is not a prerequisite to have Norse Greenlanders. Inuit are, of course a great demonstration that habitation of that part of the world, whether your technology be limited or advanced, is not strictly climate-controlled. And the Norse were also able to trade commodities with Europe, such as walrus ivory, providing a good incentive for settlement. Their survival well beyond the beginning of the Little Ice Age, on a diet that became much more marine (Arneborg et al, 1999), also shows climate not as the ultimate limiting factor. -
michael sweet at 13:48 PM on 20 February 2012Global Warming and Cold Winters
Copie, Here is today's anomaly map. Where is this "record cold weather" you speak of.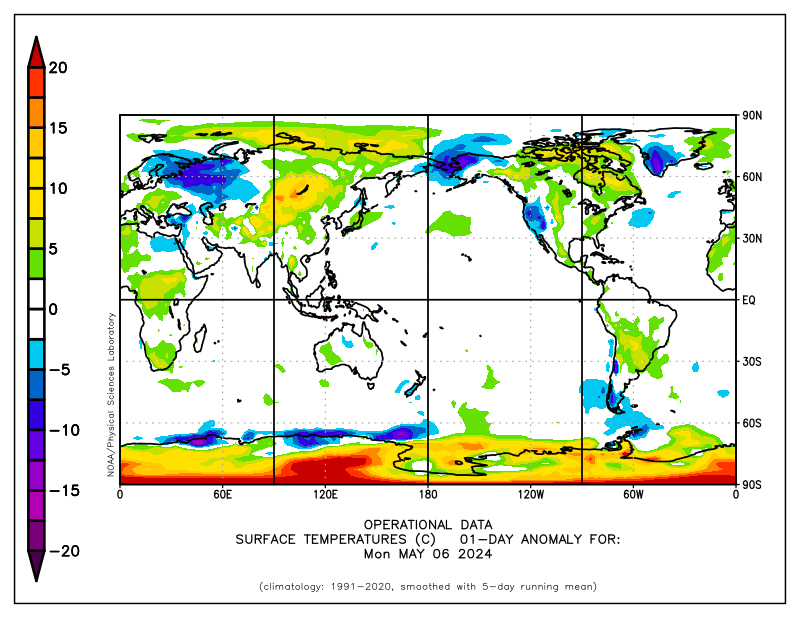 I see a sizable area of +20C, which has been record hot in Svalbard. The cold is only the coldest in the last 30 or so years. It is not cold by historic standards, they have just gotten used to it always being warm. Name your location that is as cold as Svalbard has been warm.
-
Tom Curtis at 13:46 PM on 20 February 2012Medieval Warm Period was warmer
muoncounter @97, there is nearly always some volcanic activity going on somewhere on the Earth. Given that, it is reasonable to assume as neutral conditions an average level of background volcanic activity. However, whether you treat this as a zero level so that reduced volcanic activity is treated as a positive forcing, or whether you treat zero AOD as the zero level, so that all volcanic activity is represented as a negative forcing is only a matter of baselining, and makes not difference to the final calculations. For the IPCC, volcanic forcing is (or should be) benchmarked at the presumed level of volcanic forcing in 1750 to bring it inline with the other forcing measurements. -
Tom Curtis at 13:41 PM on 20 February 2012A mishmash of Monckton misrepresentation
This is only marginally on topic, in that it is an example Monckton's misrepresentation of (easily determined) facts rather than of scientists per se. However it is certainly relevant to Adam's threadjack. In Monckton's St Paul Lecture he says:"[26:46] “... Gore knew the judge was right because in the year he made that movie he spent four million dollars buying – yes, some of you have got there already – buying a condo in the St Regis Tower, San Fancisco just feet from the ocean at Fisherman's wharf. [27:09] “So how many of you think, that as you went in through twenty feet of sea level rise, through the doors of that building he would not find himself going glug glug glug?"
(Numbers in square brackets are times on the tape.) When I first heard this comment, I was immediately suspicious. One of the few things I know about San Francisco is that it is very hilly, so that a few feet of difference can make a large difference in height above sea level. The map on Monckton's slide reinforced that suspicion. The hotel was apparently close to the Golden Gate Bridge, and as large bridges are placed at elevated locations near the shore, likely to be at an elevated location. So I did some checking. The first thing I found out is that St Regis Tower is indeed just feet from Fisherman's Warf. Nine thousand feet, give or take. That is a fact as easily ascertained as looking at a map which marks both locations. You have to wonder why Monckton chose words that suggest St Regis Tower is on the fore shore rather than over one and a half miles from Fisherman's Wharf, and three quarters of a mile to the nearest shore. Next I checked Robert Rohde's handy Sea Level Rise Explorer: As you can sea, I have marked the location of St Regis Tower with the red diamond. As you can also see, the shading in that area is a yellowish green, indicating an altitude above sea level of between 12 and 20 meters.
So, do I think patrons of the St Regis Towers, San Fancisco will be going "Glug, Glug, Glug" as they enter the lobby if sea level should rise 6 meters? Not a bit of it.
Bearing in mind that Monckton is using the supposed altitude of the St Regis Towers lobby to make an accusation of fraud. You should assume therefore, that he has checked his facts, a task as easy as emailing the St Regis Tower and making inquiries. I do not know whether he did that, and deliberately lied, or whether he just has so complete disregard of truth that he didn't even bother. What I do know is that this is a complete misrepresentation of the facts, and a misrepresentation on which he built a slander.
As you can sea, I have marked the location of St Regis Tower with the red diamond. As you can also see, the shading in that area is a yellowish green, indicating an altitude above sea level of between 12 and 20 meters.
So, do I think patrons of the St Regis Towers, San Fancisco will be going "Glug, Glug, Glug" as they enter the lobby if sea level should rise 6 meters? Not a bit of it.
Bearing in mind that Monckton is using the supposed altitude of the St Regis Towers lobby to make an accusation of fraud. You should assume therefore, that he has checked his facts, a task as easy as emailing the St Regis Tower and making inquiries. I do not know whether he did that, and deliberately lied, or whether he just has so complete disregard of truth that he didn't even bother. What I do know is that this is a complete misrepresentation of the facts, and a misrepresentation on which he built a slander.
-
JP40 at 13:34 PM on 20 February 2012Global Extinction: Gradual Doom as Bad as Abrupt
I am pretty sure that if greenhouse gass emissions remain unchecked, civilization will collapse before enough damage is done to set of the chain reaction of doom that killed almost all life. A special on the History Channel called Earth 2100 imagined a worst-case scenario of the affects of climate change, and most other issues that people worry about, like epidemics and border riots. It predicted the total collapse of modern, co2 emitting civilization at about 2100, with widespread anarchy starting at about 2080. -
muoncounter at 13:25 PM on 20 February 2012Medieval Warm Period was warmer
TomC: "unusually low volcanic eruptions contributed, particularly in the early twelth century." A 12c volcanic lull wouldn't explain the prior Norse settlements in Greenland. You seem to suggest that 'neutral' conditions (0 net warming), requires some level of volcanic activity. Why would that be? -
scaddenp at 13:23 PM on 20 February 2012Global Warming and Cold Winters
Gee, try reading what the scientists are trying to tell you. Do you notice the record high temperatures as well? (ie where you live is not the world). -
Copie at 13:17 PM on 20 February 2012Global Warming and Cold Winters
Give us all a break you "Global Warming" religion cranks! Trying to convince us that record cold weather is really global warming is a sick joke. Go and do something useful, help someone who is suffering from the extreme cold. -
scaddenp at 13:16 PM on 20 February 2012A mishmash of Monckton misrepresentation
"Your disinclination to discuss the actual nuts and bolts of the dispute is duly noted." I am trying to encourage Adam to do just that. Adam, how many things from say Monckton, CO2"science" etc need to be shown to you as misrepresentations before you would stop relying on such sources? -
actually thoughtful at 13:01 PM on 20 February 20122012 SkS Weekly Digest #7
Hi-jacking seems to be a subset of the overall comments process on SkS - someone will post something provocative or false, then 5-10 different posters will kindly point out the errors of their way. It would be nice if one person would point out the errors, ask the poster to retract or justify their comments - and have it be enforced that they can't post anywhere else until they either document the claim or retract it - that would, to my mind, be the platonic ideal of holding skeptical commenters accountable. If you mean, by hijack the thread, long back-and-forths as a person works through their particular issue (in a reasonable way) - I view that as fairly healthy, and I suspect if an honest person is confused on something, probably many others are as well, so we all benefit from their process of understanding. -
dhogaza at 12:57 PM on 20 February 20122012 SkS Weekly Digest #7
"Hijacking is annoying but just a variation of "off topic". Like "trolling" it is rather subjective. Heavy-handed use would silence debate that should be happening. " The debate that should be happening is debate about the original post that heads a particular thread. Hijacking is by definition an attempt to end that legitimate debate by changing the subject. Obviously enforcement would be somewhat subjective, but this is true of the entire moderation policy. It's unavoidable. I'd say yes it should be against the comment policy. Enforcement should be similar to the enforcement of other elements of the comment policy, which typically is a warning, followed by comment editing plus warning (if only part of a comment is in violation), and if the offender's persistent enough, deletion of comments in violation. -
Pierre-Normand at 12:39 PM on 20 February 2012Breaking News…The Earth Is Warming…Still!
"So future warming requires future imbalance." That's certainly true. However it takes time to restore any new imbalance (unless the variation is so slow that the state never is transient). It takes time for oceans to warm. So, if there is a variation in the absolute values of the forcing between some time t1 and a later time t2, the resulting imbalance (that will need to be restored from t1 onward) is F(t2) - F(t1) + I, where F(t) is the total forcing at t, and 'I' is the previous imbalance caused by past variations in forcing that had not yet been fully restored at t1. -
Pierre-Normand at 12:27 PM on 20 February 2012Breaking News…The Earth Is Warming…Still!
Sorry, Ken Lambert. You are right. I had thought the 1W/m^2 variation in TSI that I had found was TOA. This is indeed rather close to 0.25W/m^2. You say that you are considering the warming imbalance from all effects. But is the modelled 0.9 to 1 W/m^2 that you mentioned based retrospectively on the true (estimated) forcings or was it produced by the models as an ensemble average? -
Tom Curtis at 12:25 PM on 20 February 2012A mishmash of Monckton misrepresentation
Adam @57, very briefly: 1) The other graphs shown by Monckton all appear to be local, not global temperatures, and therefore cannot show a global event; 2) Those graphs differ from each other about the timing of peak warming, with some graphs showing significant cooling where others show peak warming. This is most obvious with the graph purported to be from Dansgaard and from Schonweise (diferent papers) which shows a MWP preceding 1000 AD and a LIA that finishes around 1500 AD. Therefore if you constructed a global proxy form the data in those graphs, the periods of peak warming would be significantly reduced compared to that shown on the individual graphs, and hence significantly reduced relative to today (which truly is a global warming). 3) One of the proxies (Esper and Schweingruber) shows not temperatures but altitudes of the tree line. Using the standard lapse rate to convert the altitude difference to a temperature difference shows a temperature difference of 0.23 degrees C above the reference for the MWP. As this is much less than the difference in Mean Global Surface Temperatures between 1980 (the apparent termination of the graph data) and the present, the graph does not show what Monckton purports. 4) Monckton's errors are too frequent and too persistent to be considered accidental. Further, when his attention was drawn to them, he did not resile from any of his claims with regard to these temperature graphs (see his response to Abraham). Therefore by his own standard (also stated in his response to Abraham) these are not mistakes, but lies. 5) It is evident that people viewing this collection of graphs from the audience of the presentation would not have been in a position to make these detailed comparisons. Therefore Monckton's presentation of these graphs had the likely and probably calculated effect of deceiving the audience. 6) And leaving aside the MWP, there is little point in your persistently asking me to read something that I have already read. 7) I notice you declined my request to discuss Abraham (or Monckton's) presentation slide by slide. Your response to that request was to cite the entire discussion of sea level rise, which occupies three slides in Monkcton's presentation, and five slides in Abraham's original presentation. Your disinclination to discuss the actual nuts and bolts of the dispute is duly noted. 8) I note that you persist in misrepresenting Al Gore as claiming that sea levels would rise by six meters in a century. In this you follow Monckton who "quotes" Al Gore as saying:" “Right, the melting ice sheets in Antarctica and Greenland are going to raise sea level by 20 feet imminently.”
(25 minutes, 41 seconds on the tape) Would you kindly point out where in An Inconvenient Truth Al Gore says that? (Hint: He doesn't) Why is it that Monckton seems reticent to quote anybodies exact words? Why does he present his "paraphrases" as though they were exact quotations? And why do his paraphrases change the original meanings of the quotes repeatedly? -
From Peru at 12:22 PM on 20 February 2012Global Extinction: Gradual Doom as Bad as Abrupt
To moderator: the rescaling of the images does not work, it breaks the link to the third image instead. The source of the disturbing map (widespread flooding during the PETM) is here: Physical Oceanography & Climate Dynamics Winguth's Webpage -
actually thoughtful at 12:21 PM on 20 February 2012Search For 'Missing Heat' Confirms More Global Warming 'In The Pipeline'
From the original post (just above first graphic): "It puts paid to wishful thinking-based claims that global warming has halted." - what does "It puts paid" mean? I am not familiar with this turn of phrase. Sphaerica @ 22 - when I first read your post at 17 I thought what you did at 22 - that La Nina would be the worst case (ie .5C +/-.43 is the most we will see, not the least). However, while this paper is based on the ARGO network, the authors also included land and atmosphere - so they are really stating that the .5C is where we are at and it is La Nina/El Nino independent. I presume that number will get revised up as the balance of evidence suggests a higher number. Am I missing something in reading it in this manner? -
From Peru at 12:18 PM on 20 February 2012Global Extinction: Gradual Doom as Bad as Abrupt
As the old saying says: The peoples that forgot their own history are doomed to repeat it... History like the deadly transitions: Permian/Triassic
 Paleocene/Eocene
 All due to huge releases of greenhouse gases, mainly CO2 and CH4 ...
This(current global warming) is the worst mass dying occurring in tens of millions of years.
The deniers, the polluters, the corrupted politicians are doing everything they can to have their hands stained forever in blood(or I should say H2S emitting purple-sulfur bacteria slime?)...
We must stop them. If we don't, I am afraid we deserve to become extinct like most therapsids (mammal-like reptiles)after the Permian/Triassic event.
All due to huge releases of greenhouse gases, mainly CO2 and CH4 ...
This(current global warming) is the worst mass dying occurring in tens of millions of years.
The deniers, the polluters, the corrupted politicians are doing everything they can to have their hands stained forever in blood(or I should say H2S emitting purple-sulfur bacteria slime?)...
We must stop them. If we don't, I am afraid we deserve to become extinct like most therapsids (mammal-like reptiles)after the Permian/Triassic event.
-
scaddenp at 12:03 PM on 20 February 20122012 SkS Weekly Digest #7
Hijacking is annoying but just a variation of "off topic". Like "trolling" it is rather subjective. Heavy-handed use would silence debate that should be happening. What would be better would be an easy way for moderation to move an offtopic hijack attempt to a more appropriate thread. -
Philippe Chantreau at 11:59 AM on 20 February 2012A mishmash of Monckton misrepresentation
Funglestrumpet, a wide range of Monckton's BS is addressed by Peter Hadfield and very well documented. See this SkS post and watch the videos, they are very informative. I really mean that: take the time to watch. I find it far more damning than anything done by Abraham, Dennis or SkS. As I said earlier, the part where Monckton does that little speech about how Dr Pinker is a great guy is really funny and says everything one needs to know about the individual. Used car salesman, snake oil merchant, take your pick for the stereotype that best matches his methods. -
Tom Curtis at 11:27 AM on 20 February 2012Medieval Warm Period was warmer
Camburn and others, I refer you to this discussion of the issue by John Cook. It should be noted that solar forcing is not the only change of forcing during the MWP. In particular, unusually low volcanic eruptions contributed, particularly in the early twelth century. Elevated CO2 levels also contributed about 0.2 W/m^2, which is significant relative to other changes at the time. The argument is revisited in this blog post by dana1981. Based on Crowly 2010, net radiative forcing in the MWP was < 1 W/m^2 greater than during the LIA. As 1750 had significantly higher radiative forcing than was typical of the LIA, this means that MWP radiative forcings are significantly less than current radiative forcings relative to the LIA. It follows that if the MWP was warmer than at present globally, climate sensitivity is greater than currently believed, and we have significantly more warming in the pipeline than currently expected. -
John Hartz at 11:24 AM on 20 February 2012A mishmash of Monckton misrepresentation
Given the conscerns expressed about Adam's posting habits, I posed the following question in the Issue of the Week section of the 2012 SkS Weekly Digest #7. "Should the SkS Comment Policy be amended to explicitly prohibit the hi-jacking of a comment thread by an individual commentator?" Please respond to this question in the comment thread to Weekly Digest #7. -
kaustubh at 11:20 AM on 20 February 2012Fred Singer Denies Global Warming
Riccardo, I would trust paleoclimate proxies more than reanalysis or gridded temperature products for pre-1950 data. Proxies may not have spatial coverage, but they are remarkable in their being reproducible and repeatable. The issue here is NOT that Singer trusts proxy data over instrumental data. The issue is that proxies DO IN FACT show the 20th century warming signal. Here is a blog post where I compile a short list of papers where the authors discover 20th century warming in their paleoclimate proxies: http://paleowave.blogspot.com/2012/02/proxy-evidence-for-recent-warming.html -
Riccardo at 11:01 AM on 20 February 2012The Year After McLean - A Review of 2011 Global Temperatures
There has been several ups and downs of the sea level in the last few days which average to zero. So the lowering of the sea level in the last couple of hours must have a different cause. Or not? -
scaddenp at 10:56 AM on 20 February 2012The Year After McLean - A Review of 2011 Global Temperatures
And with reference to last decade - La Nino's have dominated since 2005. Now what climate science expects is that when natural factors go positive then global temperatures will steadily rise again. If they dont, then climate science needs fixing. On the other hand, if they do will that be enough to change your mind? -
funglestrumpet at 10:51 AM on 20 February 2012A mishmash of Monckton misrepresentation
We must make sure that all of Monckton’s misrepresentations are properly documented in the event that the authorities decide to prosecute him for deliberately trying to thwart attempts to combat climate change. He can have no defence regarding the potential dangers seeing as he is not a scientist and his views are in direct conflict with those of the overwhelming majority of climate scientists, as this post clearly gives some evidence of. When the public eventually catches up with the risks that Monckton is exposing their children and grand-children too, I imagine he might be glad to be safely locked away. Can there be any doubt regarding the need to ditch the idea of hereditary peerages? It is a mystery to me that someone can be ennobled just because some dim, distant ancestor pissed up the same tree as the king. Even offering to hold it for him hardly qualifies. -
Search For 'Missing Heat' Confirms More Global Warming 'In The Pipeline'
neil - To repeat a post from another thread (as it's even more appropriate here): That is not the case. As long as there is an energy imbalance at the TOA, as long as the oceans in particular are in thermal disequilibrium, there is "warming in the pipeline", or as I prefer to term it, unrealized warming. This is only made worse by the increasing greenhouse gas forcings we are putting out. To quote Galileo, ""Eppur si muove. When the energy content of the climate stops moving, attains long term averaged equilibrium at the top of the atmosphere, then we can state that there is no longer "warming in the pipeline". Not before. If we were to stop emissions tomorrow, there will still be decades of warming before the TOA imbalance is addressed - simply due to thermal inertia. -
skywatcher at 10:37 AM on 20 February 2012Medieval Warm Period was warmer
Camburn, as stated by many before, with copious references, you can't have it both ways. Climate responds to forcings. A strong MWP either requires a large forcing comparable to today (not apparent from the Sun in the Steinhilber et al 2009 graph that Svalgaard uses, or in Delaygue et al 2010) or it needs high climate sensitivity to a period where solar activity was respectable for an extended period of time and volcanic activity was relatively low. If you don't see this extremely simple physical logic, there's little reason in discussing it with you. Do you have a hitherto unseen large forcing? If you want low climate sensitivity you need one, or you need to forget the MWP being a large global event. Add to that all the other geological and historical evidence for climate sensitivity somewhere around 3C per doubling (Hegerl et al 2006; Knutti and Hegerl 2008), and the argument becomes ridiculous. It is indeed, as muoncounter eloquently puts it, "the pseudoskeptic's dilemma" -
scaddenp at 10:29 AM on 20 February 2012The Year After McLean - A Review of 2011 Global Temperatures
"So ENSO is not the explanation for the last decade stasis in surface temperatures" Foster and Rahmsdorff however show quantitatively that combination of ENSO, Solar and aerosol are sufficient to explain the observations. You dont like the method but so far I dont see are sensible critique of thus other than you dont like their results. -
skywatcher at 10:14 AM on 20 February 2012A mishmash of Monckton misrepresentation
#65 paulhtremblay - perhaps a clarification required, as using the climate of the past 750 years (admittedly not right through the MWP), Hegerl et al 2006 show climate sensitivity comparable to IPCC projections. The variations of the past millennium do provide us with some indications of climate sensitivity, but they still rule out very low values, and don't rule out values high enough to be really scared of (Hegerl's 5-95% is 1.5-6.2C per doubling). A more bent hockey stick will probably increase Hegerl's 5% boundary. Though the MWP and LIA were dominantly regional events, they were strong enough and widespread to have some effect on global temperature, even if it was only 0.3C here and there. BTW, is Adam actually Monckton in disguise? He's Gish Galloping with the best of them! -
Tristan at 10:12 AM on 20 February 2012A mishmash of Monckton misrepresentation
The deletion of all poptech's posts was unintentional. He had been allowed 250+ posts till that point and given a lot of opportunity to make a coherent argument. When an attempt to delete one post deleted all of them he probably should have been notified of the mistake. That said, all they showed was that after a pointless exercise in rhetoric he admitted that his definition of peer-reviewed meant 'something that someone could review'. -
neil at 10:00 AM on 20 February 2012Search For 'Missing Heat' Confirms More Global Warming 'In The Pipeline'
Rob: I think you should be more clear about what you mean about "warming in the pipeline". If you are talking about surface warming, there is a serious problem in the central argument presented here. I think you are confused by the difference between a "constant composition" atmosphere (which has warming in the pipeline), and the case of warming based on past emissions (for which there is no warming in the pipeline). This is common mistaken even among climate scientists. We are NOT committed to any surface warming from past emissions. As a thought (or climate modelling) experiment, imagine emissions went to zero tomorrow - would the world keep on warming? The answer is no. The ocean would absorb CO2 out the atmosphere, drawing down the radiative forcing over time. The heat from the radiative forcing of the 'excess' CO2 still in the atmosphere is also almost completely absorbed by the ocean. Thus no further surface warming occurs. Of course the (deep) ocean does warm and expand. But don't believe me, look at the Damon and Weaver paper clarifying this misconception: http://www.nature.com/ngeo/journal/v3/n3/full/ngeo813.html -
paulhtremblay at 09:51 AM on 20 February 2012A mishmash of Monckton misrepresentation
Adam:"But your statement is also a bit contradictory don't you think. Your argument works both ways. This website has repeatedly claimed that the hockey stick graph is correct, and that temperatures are warmer than it was in the MWP. So surely, by your own logic, if the hockey stick was correct, then climate sensitivity would also be low." That is incorrect. First, the MWP was not global, so it would not give any information on climate sensitivity. Accounting for its local variations and the overall Global temperature does not contradict any of the models of climate sensitivity. If you believe otherwise, can you please be specific? -
Ken Lambert at 09:38 AM on 20 February 2012The Year After McLean - A Review of 2011 Global Temperatures
DM & CBD DM "There is no need to invoke some unknown ocean circulation as ENSO already does a good job" According to Fig 3 there have been 6 La Ninas and many 'other' ENSO cycles since 1975. The effect is supposed to be neutral on the overall warming imbalance. So ENSO is not the explanation for the last decade stasis in surface temperatures. CBD "The answer to your original question thus continues to be that these aerosol effects are not "taken out" because they cannot be quantified precisely enough to do so." It seems that when a tough question is posed - the resort is to "we can't accurately measure this". If that is the case then confident predictions of the magnitude of the warming imbalance can't be made either. -
Dean at 09:32 AM on 20 February 2012Search For 'Missing Heat' Confirms More Global Warming 'In The Pipeline'
Loeb et al's paper is quite new so we'll see how it holds up. I think one should note that the error bars given applies only to this work. If you do a meta-analysis of more papers on the subject, you get different combined error bars. Interestingly, Trenberth has given some critical comments of the paper as referred by science journalist David Appell. -
scaddenp at 09:28 AM on 20 February 2012A mishmash of Monckton misrepresentation
I believe poptart's posts were deleted by mistake actually. A shame because they were very revealing - including the admission that no conceivable data could convince him that climate science was right. However, to substance, he refuses to remove papers that the authors themselves are wrongly on the list, includes letter, reviews etc. that are not peer-reviewed and journals (esp E&E) that are not peer-reviewed in the sense normally understood by that. However, the challenge is the same as for CO2"science" - find something that you find convincing - any paper on that list - and then discuss it on the appropriate thread -
paulhtremblay at 09:15 AM on 20 February 2012A mishmash of Monckton misrepresentation
>>Might I point out that nobody here has responded to Poptech's rebuttal to one of your articles. Good grief! None of the articles presented by Poptech refute global warming. Look at the actual thread presented here at SS. Instead of actually addressing that issue, you link to yet another rebuttal by poptech, which does nothing to address the outright fabrication of poptech's claims. Adam, you are continually engaging in a moving target argument. You were asked to bring up one paper from CO2 science to bolster your claim that the MWP was global. You have not done so. Let me give you another challenge to bring up one article from poptech that actually bolsters your claim that the peer reviewed science supports Mockton. Specifically, show a peer reviewed article that undermines a specific claim made by the IPCC in a significant way. Stop dodging and filling up these boards with BS.Moderator Response: [JH] Please use "SkS' when referring to Skeptical Science. -
A mishmash of Monckton misrepresentation
dhogaza - You are correct, Monckton has on occasion made truthful statements. I will therefore qualify my comment to: Monckton has yet to make a single supportable statement on contradiction to established climate science. Adam - It's quite clear that Huang's data and conclusions do not support Monckton's statements. I am glad to see that you understand that; he should not have claimed that Huang supported his presentation. Again, Monckton is the one making extraordinary claims (that all of climate science is incorrect) - hence he has the burden of proof. Can you point out a single statement of his contradictory to the consensus that is supportable? In the meantime, folks, DNFTT. -
dhogaza at 09:00 AM on 20 February 2012A mishmash of Monckton misrepresentation
Adam: "If you believe that I was wrong on the subject of the ice sheets, please provide me one peer reviewed paper providing credible evidence that the the Greenland ice sheet will completely disappear within the next 100 years. I have seen zero evidence for the idea that the Greenland ice sheet will melt in the near future. Therefore I stand by my statement that the science is clear on it. Once again, if you think I am wrong please provide a peer reviewed study supporting the claims that were made in AIT about sea level rise due to the collapse of the ice sheets." Once again, Adam makes a strawman claim that was not made by AIT ("next 100 years" "near future"). How often does he get to repeat this falsehood? -
dhogaza at 08:57 AM on 20 February 2012A mishmash of Monckton misrepresentation
Adam: "Might I remind you that I gave a list of 900+ peer reviewed papers supporting the arguments made by skeptics." It's obvious you've not taken a look, because the list includes many things that aren't peer reviewed papers in any scholarly sense (poptech has his own definition). But I see I've fallen prey to Adam's attempt to hijack the thread rather than deal with the original post ... So I shall shut up now :) -
Tony O at 08:57 AM on 20 February 2012Global Extinction: Gradual Doom as Bad as Abrupt
Even if a great die off is inevitable, I would rather put it off as long as possible. Perhaps it is not yet certain, but as a society we seem to want to ensure our doom. One in six just not good enough odds, we are filling up chamber after chamber before we play. Is that Darwin award really so important. -
saltspringson at 08:54 AM on 20 February 2012Search For 'Missing Heat' Confirms More Global Warming 'In The Pipeline'
From the abstract: "We combine satellite data with ocean measurements to depths of 1,800 m, and show that between January 2001 and December 2010, Earth has been steadily accumulating energy at a rate of 0.50 +/- 0.43 Wm-2 (uncertainties at the 90% confidence level). We conclude that energy storage is continuing to increase in the sub-surface ocean." The following is a commentary from William M. Briggs at http://wmbriggs.com/blog/?p=5105 - "Most curiously, the authors choose the “90% confidence interval” instead of the usual 95%. Why? Skip the discussion of the meaninglessness of confidence intervals and interpret this interval in its Bayesian sense. Then this means that the coefficient of the regression associated with time is estimated at 0.5 W-2 with a 90% chance of being anywhere in the interval 0.07 to 0.93 Wm-2. This is an unobservable coefficient in a model, mind. It is not an amount of “energy.” To get to the actual energy, we’d have to integrate out the uncertainty we have in the coefficients." -
dhogaza at 08:53 AM on 20 February 2012A mishmash of Monckton misrepresentation
Adam: "Not only that, but as Andrew (Poptech) has pointed out, every single comment he has ever written on skeptical science has been deleted. Care to explain that away?" He was allowed to post here for quite a long time. He would attempt to hijack every thread with his personal agenda. I'm not a moderator and do not know exactly what happened, but the moderators here are quite clear that refusal to follow the posting guidelines clearly stated here will lead to one's being kicked out. He refused to follow posting guidelines. What's to explain away? You visit John Cook's house, you follow John Cook's house rules. If he asks you to quit traipsing about the carpets with your muddy boots and you refuse, he's perfectly justified in showing you the door. -
dhogaza at 08:49 AM on 20 February 2012A mishmash of Monckton misrepresentation
KR: "Skipping over the implied moderation complaints, can you point out any Monckton arguments that actually hold water? " I can think of one, i.e. his argument that mocking his appearance because he has Graves' disease is unkind and insensitive. Though in making that argument he is guilting of throwing stones from a very glassy house, given his track record. Still, the bug-eyed fella's right, it is unkind and insensitive :) -
muoncounter at 08:46 AM on 20 February 2012Medieval Warm Period was warmer
What about Door#3, as shown in the Intermediate version of this rebuttal? Perhaps the MWP wasn't really a global warm period after all. That solves the problem of a less-than-stunning TSI increase (from your Svalgaard slides), without upsetting the cherished 'climate sensitivity is low' meme. All you need to do is accept that what some call a global 'MWP' should really be a very local 'MCA.' But that would mean 'it's not about the hockey stick.' Maybe this is why many pseudo-skeptics don't like it when their arguments are held to the standard of logical consistency. -
Adam at 08:37 AM on 20 February 2012A mishmash of Monckton misrepresentation
Chris, 29 I've had a look at Huang's 2008 paper, and I agree with you that their 1997 paper was not the best choice of study to include as evidence of a MWP. Although I do not believe that there was anything nefarious about Monckton including it in his talk. It was probably just an honest mistake. And might I once again point out that it is only one paper. Monckton showed graphs from eight other studies showing MWP temps were the same/higher than today. You can't just pick out one single study from his talk, and then just act like everything he said was wrong. And might I also point out in their 2008 paper, they clearly state Holocene temps were warmer than today (which Abraham left out of his presentation) Also, in Hunag's 2008 paper, they are vague about what data they are using for 20th century temps. It's likely surface data was spliced onto the graph, although I don't know for sure. But nowhere in their paper do they mention satellite data over the past three decades,, which show less warming than the other datasets. They state that “the maximum of the MWP is at or slightly below the reference level”. However, their conclusion might have changed if they had chosen to use satellite temps in their study. Tom Curtis, 42 “Because an adequate rebuttal already existed in the form of his pre-existing presentation (duh). “ Might I once again ask if you have actually read Monckton's reply to Abraham? Chris, 43 “he asserted (with zero evidence) that 700 scientists supported the interpretation that the MWP was warmer than current temperatures. “ He was referring to the Co2science MWP project. “The pictures he showed to accompany this assertion turn out not to support it at all. In fact in the case of Huang's borehole data that include much of the 20th century, the latter indicate that that current temperatures are warmer than during the MWP.” Read my paragraph above. Jmurphy, 44 “That is a disgraceful, cheap accusation with no basis whatsoever in reality. You have shown your true colours and I'm sure Monckton would be proud of your dissembling. “ Jmurphy have you read Monckton's reply? He gives numerous examples of Abraham misrepresenting his arguments, when contacting the scientists. Read questions 66 -77 (page 12) Abraham makes out Monckton had misrepresented the work of a paper showing 4 polar bears died in a storm. Yet Monckton clearly stated what that paper said accurately and, didn't even mention any possible predictions regarding polar bears. “77: Though you say, “Chris Monckton doesn’t agree with that author, even though he used the citation in his presentation” (15), is it not in fact correct that I correctly reported what the authors said about the cause of death of the four polar bears, and that I did not even mention, still less attempt in any way to challenge, the prediction by them that you say I disagree with? Again, are you bearing in mind the difference between the evidence that I relied upon in Dr. Monnett’s paper and the predictions that he made. It is on the evidence that I spoke, not on the predictions. Would you not agree with me that there are too many predictions in climate science today, and not enough in the way of evidence to give those predictions some real-world credibility.” On Pages 13 – 15 Abraham claims that Monckton misrepresented the work of Barber et al, 2009. Yet, as Monckton pointed out in his reply (Q.84), he didn't even mention Barbers paper in his talk. On page 15 Abraham claims Monckton misrepresented the work of Norris and Rosenstrato. Even though as Monckton pointed out, their graph did indeed show polar bear populations increasing He claims Monckton misrepresented the work of Dr Keigwin. He provides no evidence for this. In Abraham's email he didn't even mention the MWP. He claims Monckton misrepresented Caillon 2002. Yet as Monckton pointed out he didn't even mention that paper. There are numerous examples of Abraham misleading authors throughout the whole rebuttal. (And might I once again point out Abraham has not responded to the letter) So your claim that “That is a disgraceful, cheap accusation with no basis whatsoever in reality.” is false. And you would know this if you had actually read Monckton's reply. Dhogaza, 45 “Oh, we know all about poptech, alright: http://www.skepticalscience.com/search.php?Search=poptech&x=0&y=0”Might I point out that nobody here has responded to Poptech's rebuttal to one of your articles. Google Scholar Illiteracy at Skeptical Science Not only that, but as Andrew (Poptech) has pointed out, every single comment he has ever written on skeptical science has been deleted. Care to explain that away?“Right, he didn't give a timeframe, therefore Monckton's lying when he suggest he did.” Did Al Gore state that the ice sheets weren't going to disappear for a millenia? Like I said before, the fact that he showed those images clearly implied that the 6 metre sea level rise was going to be happening in the near future. “A strong Medieval Warm Period = HIGH climate sensitivity. “ Please provide one peer reviewed paper supporting that assertion? But your statement is also a bit contradictory don't you think. Your argument works both ways. This website has repeatedly claimed that the hockey stick graph is correct, and that temperatures are warmer than it was in the MWP. So surely, by your own logic, if the hockey stick was correct, then climate sensitivity would also be low. Chriskoz, 49 “You are clearly dilluting any depth of arguments here and running into Monckton gish-gallop, as emphasized text indicates.” Read the numerous examples I gave above of Abraham's misleading claims. Owl905, 51 “Adam droned at 40: "Yes, the IPCC didn't give an exact time frame, but the science is clear that the ice sheets are not going to disappear any time in the near future." You still get the target wrong; and you try the same Monctonite spin where a nearby revision is true (even when untrue)... so the original wrong is right. It's a pathetic attempt to defend your original error. AR4 gave no timeframe and no forecast of complete meltdown. Your claim of clear science is false, and your vague context is useless.” If you believe that I was wrong on the subject of the ice sheets, please provide me one peer reviewed paper providing credible evidence that the the Greenland ice sheet will completely disappear within the next 100 years. I have seen zero evidence for the idea that the Greenland ice sheet will melt in the near future. Therefore I stand by my statement that the science is clear on it. Once again, if you think I am wrong please provide a peer reviewed study supporting the claims that were made in AIT about sea level rise due to the collapse of the ice sheets. Phillipe Chantreau, 53 “That Monckton is largely wrong the majority of the time is not a matter of belief, it is a verifiable fact. “ KR, 55 “The man is amazingly consistent - I have yet to see a single argument from him that is supportable. “ Might I remind you that I gave a list of 900+ peer reviewed papers supporting the arguments made by skeptics.Moderator Response: [Dikran Marsupial] The next time one of your posts contains a complaint regarding moderation, the whole post will be delete, rather than edited as I have just done. This is your final warning on this subject. -
Camburn at 08:05 AM on 20 February 2012Global Extinction: Gradual Doom as Bad as Abrupt
scaddenp@7: "The theory is worthy of Doug Cotton." Are you sure? There may be something to the gravity dino theory...........maybe..... It prob has more credence than Mr. Cotton's theory, however......ok....a toss up? -
scaddenp at 07:56 AM on 20 February 2012Global Extinction: Gradual Doom as Bad as Abrupt
I'm with JP40 - this is the silliest idea I have heard for a while. It demonstrates why you have to do the math instead of just hand-waving. The theory is worthy of Doug Cotton. -
owl905 at 07:39 AM on 20 February 2012Global Extinction: Gradual Doom as Bad as Abrupt
The Gravity Theory does not, nor did it intend to, explain all extinctions - it would clearly fail on most of them including the present extinction. It's focused on the KTX boundary with a possible extension to the PTX. There's two Razors against the idea. First, the continental arrangement was already dispersing - in the context of the theory, Earth's 'balance' was increasing. Second, a bollide the mass of Mt. Everest hit a shallow sea&swamp full of calcium carbonate at exactly the same time as the biosphere effectively disappears. On the lengths of a globe that rotates: 233K pdf of Earth's Rotation Evolution -
Camburn at 07:34 AM on 20 February 2012Medieval Warm Period was warmer
So as shown in my post 92 it is very obvious that TSI was not a factor of the temps of the MWP. Hence, I have no clue what the sensativity is/was as I have not seen a good demonstration of either high nor low. So, there is no condrum as far as being skeptical concerning the MWP. I would however, really like to understand why it was warm during that time verses the years prior and after. -
Camburn at 07:14 AM on 20 February 2012Medieval Warm Period was warmer
Look at slide 7 of Dr. Svalgaards presentation. It shows TSI variability verses temperature reconstructions of the period includeing the MWP. Note that the correlation between TSI reconstruction and temperature in the proxy data is very very poor. Slide 7 on TSI verses temperature in proxy data
Prev 1261 1262 1263 1264 1265 1266 1267 1268 1269 1270 1271 1272 1273 1274 1275 1276 Next


