


 Arguments


Recent Comments
Prev 1264 1265 1266 1267 1268 1269 1270 1271 1272 1273 1274 1275 1276 1277 1278 1279 Next
Comments 63551 to 63600:
-
Bernard J. at 01:16 AM on 19 February 2012DenialGate Highlights Heartland's Selective NIPCC Science
The very public dissection of the Intelligent Design movement at the Kitzmiller v. Dover Area Board of Education trial was an enormous blow to the good PR that IDists had enjoyed until people got a close look at them.
Stephen Baines at #29 pre-empted my response, but it merits a repetition of the basic notion. A part of me actually hopes that Heartland does try to put its K-12 material into schools, for exactly the outcome that would occur - there would be an immediate and overwhelming testing of the material in court, a la Kitzmiller v. Dover Area Board of Education. The queue of climate experts willing to testify would probably wrap around the block, and the likes of the Heartland rogues' gallery (and others such as Monckton and Watts) would either turn up to be scientifically emasculated in a legal test of their claims, or they would avoid the courtroom altogether and be conspicuously seen to be the flim-flam artists that they are. Frankly, I can't see that Heartland can in any way move on its schools plan now - not if they don't want to suffer an ignominious legal challenge. Further, I can't see that they or any of the other lobby groups could even attempt in their turn a legal challenge if, say, the AAAS helped to structure a K-12 program to enable in schools a greater scientific understanding of global warming: in any impartial courtroom testing of science, there would be only one possible outcome (yes, probably even in the States...). A corollary of this is that it's irrelevant whether of not that document is genuine - it's already done its job and the real scientific community will be carefully scrutinising the US school system for any sign of Heartland's plan, and the day that something appears on the radar there'll likely a complainant case ready to roll. I'd be surprised if such a case is not already being prepared somewhere, in anticipation. Heck, Skeptical Science represents the basic structure of such an effort, so if there isn't already a legal attack project running, a nacent one could do worse than to start here (...or at RealScience, of course!). -
Tom Curtis at 00:49 AM on 19 February 2012A mishmash of Monckton misrepresentation
Adam @1, John Abraham has explicitly responded to Monckton's critique of his presentation here at Skeptical Science. In it he acknowledges just three errors in his original presentation: 1) He admits that Monckton says he was "bored" at one time in his speach, where as Abrahams originally quoted him as saying he was "boring". 2) He admits that some of Monckton's slides noted as containing information without reference are marked as being from the SPPI (of which Monckton is the Policy Director). However, he correctly notes that the SPPI was not the original source of the data so that that does not constitute a proper scientific reference (nor a reasonable aid in checking the veracity of the information). 3) He admits that just one slide of Monckton's containing information without reference was marked as data from the University of Alabama Hunstville. However he correctly maintains that that is not a proper scientific reference, which would include the papers name, journal and date of publication. At a minimum it should specify the channel, and version number of the UAH satellite temperature series, and the date on which the data was accessed. As we are now on (at least) version 5.2 of the UAH record, that is not a trivial issue: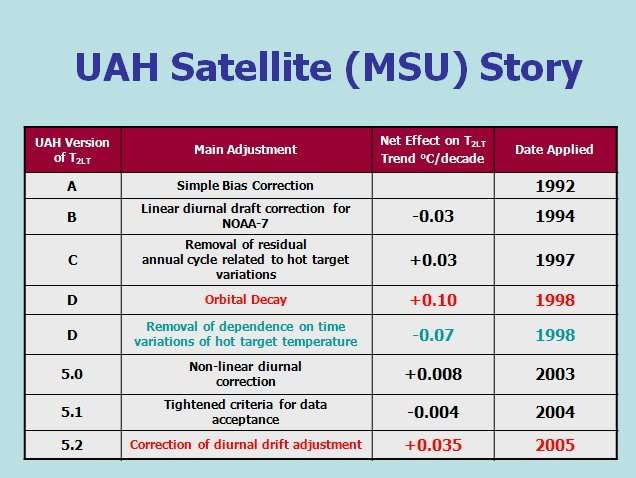 Abraham also notes an additional error in Monckton's speach.
I quote from the second of your sources:
Abraham also notes an additional error in Monckton's speach.
I quote from the second of your sources:
"Abraham and the university are half-heartedly attempting to characterize the issue as a mere “academic dispute”, as if telling lies is what academics do. However Abraham has put up a new version and taken out the worst of the outrageously libelous errors, which amounts to a full ten minutes of lies removed! Abrahams original version. Newer, tamer, but still incorrect version. As Monckton points out on Watts Up, this is an admission on their part that the first version was libellous, but with many errors still remaining:"
(My emphasis) I note that the underlined sentence is a direct lie. The University of St Thomas' lawyers had written to Monckton expressly stating that:"It is the University's position that Professor Abraham has done nothing improper or illegal in expressing his ideas and opinions on this matter and that Professor Abraham has not engaged in any academic or professional misconduct."
Inferring an opinion in direct contradiction of a stated opinion that has not been retracted is not justifiable, and Monckton is certainly intelligent enough to know so. What is more, John Abraham continues to maintain both both his original and his revised presentations on his faculty website. As he continues to publish the original presentation, the implication that he has resiled from that is obviously ungrounded. Again, Monckton is in a position and intelligent enough to know this. Unfortunately he is also intelligent enough to know that his accolytes will not care for such matters of consistency, and unscrupulous enough to exploit that gullibility in his followers. Again quoting from your second link:"Plenty of libels indeed remain in the new version of Abraham’s talk: he has even been imprudent enough to add quite a new and serious early in his talk, having failed yet again to check his facts with me. In the new version of Abraham’s talk, every remaining libel will be regarded by the courts as malice, because he was told exactly what libels he had perpetrated, and was given a fair chance to retract and apologize, but he has wilfully chosen to persist in and repeat many of the libels. And when the courts find that his talk was and remains malicious, then he will have thrown away the one defense that might otherwise have worked for him – that in US law a public figure who sues for libel must be able to prove malice. I can prove it, in spades."
The claim that Abraham has "willfully chosen to persist in and repeat many of the libels [sic]" directly contradicts the claim that Abraham and/or the University of St Thomas which continues to host both of his presentations, has surrendered. Therefore that claim is also deceptive. As the claim is made by Jonovva rather than by Monckton, I cannot attest sufficiently to he intelligence to know that it was deliberate deception (aka, a lie), or whether she was simply first deceived by Monckton. Finally, I have a friend who tells me to never attribute to dishonesty what you can attribute to stupidity. Therefore I cannot comment on the ethical basis of your regurgitation of Monckton's deceits. -
Alexandre at 00:44 AM on 19 February 2012A mishmash of Monckton misrepresentation
To the 'skeptics', any response counts as worthy. The important thing is to keep a safe distance from actually understanding the science, so that they can say "he responded and won!" Even if the 'skeptic' in question has in front of himself the juxtaposition of Monckton's crocks and the very scientists he cites contradicting him. I sometimes question the ability of human kind as a species to tackle this problem. -
Dikran Marsupial at 00:32 AM on 19 February 2012A mishmash of Monckton misrepresentation
Adam, I should add that if you want to discuss any of Moncktons questions here at SkS, just pick an appropriate article (use the search facility) and I am sure there will be someone willing to discuss it with you (if it has to do with the carbon cycle, statistics or GCMs, I would probably be one of them). However, I would suggest you discuss one question at a time in depth. -
Dikran Marsupial at 00:29 AM on 19 February 2012A mishmash of Monckton misrepresentation
Adam, a "84-page letter and 466 questions", sounds very much like a Gish Gallop to me, which is a well known rhetorical device that is intended to evade topics that one does not want to discuss by presenting a profusion of other topics in the hopes that said opponent will either be distracted by one of them or not have the energy to address them all and as a result not bother to reply. In science, we have found over the years that depth of discussion is generally preferable to breadth of discussion, as it is more likely to result in the truth. The depth of the discussion is often a good indicator of whether it is scientific or rehtorical; if someone obstructs in depth discussion of a particular topic, there is often a very good reason why. It is good that you mention Moncktons' reply, but it doesn't necessarily present him an a good light. Note also that if Abraham has retracted statements that he couldn't substantiate, then that doesn't necessarily present him in a bad light. One of Monckton's greatest problems is an inability to concede when he is in error, again this is something associated with rhetoric rather than science. -
Bernard J. at 00:29 AM on 19 February 2012A mishmash of Monckton misrepresentation
Oh, please, for the love of the Flying Spaghetti Monster, both of those links are so riddled with errors that it would take a brave individual hours to catalog and rebut them all. Having said that though, Codling's last gasp:It's a bore listening to the endless triumphant claims that Monckton is not a Lord (as if it makes much difference to the climate), but for the record, here's his full explanation (from the Watts Up page) of how he does qualify, as he has always explained, as a non-voting hereditary member of the Upper House. [snip]
is worth some scrutiny, if only because it's been completely stripped bare by those who should know:I must repeat my predecessor's statement that you are not and have never been a Member of the House of Lords. Your assertion that you are a Member, but without the right to sit or vote, is a contradiction in terms.
-
MarkR at 00:28 AM on 19 February 2012A mishmash of Monckton misrepresentation
#1 Adam, Monckton's Gish Gallops are absolutely enormous, and it takes time to analyse all of his claims. This is an introductory post, and as you can see, there are clear misrepresentations in what he's presented before. The Monckton reply you link to, for example, fabricates IPCC projections in order to make them look bad. Sure, he's excellent rhetorically, and can lead an audience on a merry dance with his debating skills, he seems completely unphased by repeatedly misrepresenting scientists. But SkS is about the evidence, and that's why we're comparing Monckton's claims with scientific evidence here. And you can see clearly, Monckton misrepresents. It's that simple. -
Adam at 23:47 PM on 18 February 2012A mishmash of Monckton misrepresentation
John Cook, why do you not reference Monckton's extremely detailed reply to Abraham. Abraham has not been able to answer any of the points that Monckton brought up, and he himself has actually surrendered to Monckton, as he has been forced to significantly edit his original video. 'Response to John Abraham' by Christopher Monckton Abraham surrenders to Monckton. Uni of St Thomas endorses untruths. -
MarkR at 22:24 PM on 18 February 2012DenialGate - Infographic Illustrating the Heartland Denial Funding Machine
#3 it would be good to see more information. Potential conflicts of interest should be out in the open, whereever the money comes from. -
debunked at 19:41 PM on 18 February 2012Newcomers, Start Here
Thanks guys.. and thanks CBDunkerson for the links.. they definitely answer some of what i was looking for.. -
skept.fr at 19:24 PM on 18 February 2012Breaking News…The Earth Is Warming…Still!
34 (Rob), 35 (KR) : for example, I don't understand very clearly what energy is concerned in this D'Araso et al 2011 paper. By "dissipation" rather than "storage", that is the kind of phenomena I've in mind (not just this one in particular, but the nature of energy in the ocean system). For example, once LW from CO2 (or SW from the Sun) warm the upper layers by radiative transfer, what will happen exactly in the ocean? How this oceanic heat surplus is transferred (where, when, which rate, which quantity, etc.)? Can heat fuels work, like in a Carnot cycle, or can a thermal energy produces be transformed in a kinetic energy? My questions are very basic and naïve, and that's why I search an educational introduction to ocean as an energy system. -
Sky at 19:14 PM on 18 February 2012Breaking News…The Earth Is Warming…Still!
I’m pleased to see such knowledgeable people posting. Thanks. The comments help me so much to increase my knowledge and understanding. Might I add, has anyone observed any published results on the measurement of the strength and northern boundaries of the Atlantic Current or the Gulf stream? I understand that it is known by several names. The last I can find was in 2005. Sky -
dana1981 at 18:34 PM on 18 February 2012DenialGate - Infographic Illustrating the Heartland Denial Funding Machine
RyanStarr - most oil companies have moved on from climate denial to acceptance, which makes it all the more confusing why so many continue to cling to their own climate denial. -
RyanStarr at 18:05 PM on 18 February 2012DenialGate - Infographic Illustrating the Heartland Denial Funding Machine
Altria appears twice in the donors. Looking at combined 10/11 actual the order is: Nucor ($502,000), William Dunn ($480,000), Renaissance ReService ($407,000), Bartley Madden ($398,933), State Farm ($344,200). Three of them don't appear at all, and yet General Motors' piddly $45K gets in? And where's the 'Big Oil' we keep hearing about? -
dana1981 at 16:23 PM on 18 February 2012DenialGate - Infographic Illustrating the Heartland Denial Funding Machine
The proposed payment to Loehle is small enough that he may simply not have felt it worth being associated with Heartland. I'm willing to take his word on it. -
bill at 15:58 PM on 18 February 2012Climate Insights: a series of bite sized videos on climate science
You know, these really are well worth publicising, but, unsurprisingly, 'Denialgate' has rather overshadowed this post. Might I suggest a retry after the dust settles? -
Albatross at 15:51 PM on 18 February 2012DenialGate - Infographic Illustrating the Heartland Denial Funding Machine
Tom @6, That may be, but why then is Loehle's salary still included in the budget at this point. Loehle or HI need to provide a timeline. When did they offer the payment to Loehle and did Loehle decline before or after these documents were created? These are valid questions IMHO. Call me cynical, but I do not trust these folks at all and it would be folly to take their claims at face value. -
Tom Curtis at 15:38 PM on 18 February 2012DenialGate - Infographic Illustrating the Heartland Denial Funding Machine
Albatross @2 if the HI's word that they proposed to pay Loehle is good enough to accept that fact, then Loehle's claim that he declined the offer is also goode enough to accept his claim. That is because there is no contradiction between the two claims. If, on the other hand a document turns up showing a payment in the budget (ie, a payment to have occurred) then that would raise a conflict between the two claims and require further explanation. -
scaddenp at 15:01 PM on 18 February 2012Breaking News…The Earth Is Warming…Still!
That would be bad. This would do virtually nothing to the change the energy imbalance - at best it would buy time. -
wanderers2 at 14:57 PM on 18 February 2012DenialGate - Infographic Illustrating the Heartland Denial Funding Machine
This graphic is not one of your best. A better graphic might be a scaled pipeline showing trickles in, and trickles out, explicitly by donor and ear-marked program. You could use the Heartland budget documents to itemize the various project-elements including climate, health-care or operations. That would more clearly indicate which funders are interested in funding which. You could even animate it using the available annual data. This would have the effect of highlighting the substantial changes in funding per program over the last few years. -
bill at 14:50 PM on 18 February 2012DenialGate - Infographic Illustrating the Heartland Denial Funding Machine
Have we seen this - the open letter from climate scientists to Heartland in the Guardian?We know what it feels like to have private information stolen and posted online via illegal hacking. It happened to climate researchers in 2009 and again in 2011. Personal emails were culled through and taken out of context before they were posted online. In 2009, the Heartland Institute was among the groups that spread false allegations about what these stolen emails said. Despite multiple independent investigations, which demonstrated that allegations against scientists were false, the Heartland Institute continued to attack scientists based on the stolen emails. When more stolen emails were posted online in 2011, the Heartland Institute again pointed to their release and spread false claims about scientists.
Bradley, Karoly, Santer, Schmidt, Mann, Overpeck, Trenberth. -
Ian Forrester at 14:39 PM on 18 February 2012DenialGate - Infographic Illustrating the Heartland Denial Funding Machine
Someone asked about a similar diagram for WWF. That just shows that whoever asked for that didn't know anything about the WWF programme. The programme is called the Climate Witness Science Advisory Panel. The large number of names deniers like Laframboise and Motl go on about as being compromised by their association with WWF are advisers and receive no remuneration for their participation. A quick look at the programme shows that deniers are once again slandering and smearing scientists when they claim they are compromised when acting on behalf of the IPCC. It is just more slander and smearing of climate scientists doing their job. -
Albatross at 14:31 PM on 18 February 2012DenialGate - Infographic Illustrating the Heartland Denial Funding Machine
jmsully, nowhere is it stated in the OP that all the funds are earmarked for climate science denial. Although you may have a point with OP's the title. As for Loehle's claim, I'd like to see some compelling evidence that he did indeed decline the money and that he has not received money from them now or in the past. His word alone does not suffice. -
jmsully at 13:28 PM on 18 February 2012DenialGate - Infographic Illustrating the Heartland Denial Funding Machine
Some of the figures in the fundraising plan are earmarked for projects which are not associated with climate science denial. You should account for that in this graphic. -
Glenn Tamblyn at 13:02 PM on 18 February 2012Breaking News…The Earth Is Warming…Still!
MattJ Wow. Manipulating ocean currents! Now that is GeoEngineering! -
Tom Curtis at 12:44 PM on 18 February 2012Climate sensitivity is low
SirNubWub @269, that is a strange graph. In addition to the errors noted by Stephen Baines and Sphaerica, I notice that the line marked "Global Warming Models" is almost certainly mislabeled. I draw your attention to the comparison of actual temperatures (HadCRUT3) and model results from the IPCC AR4 below: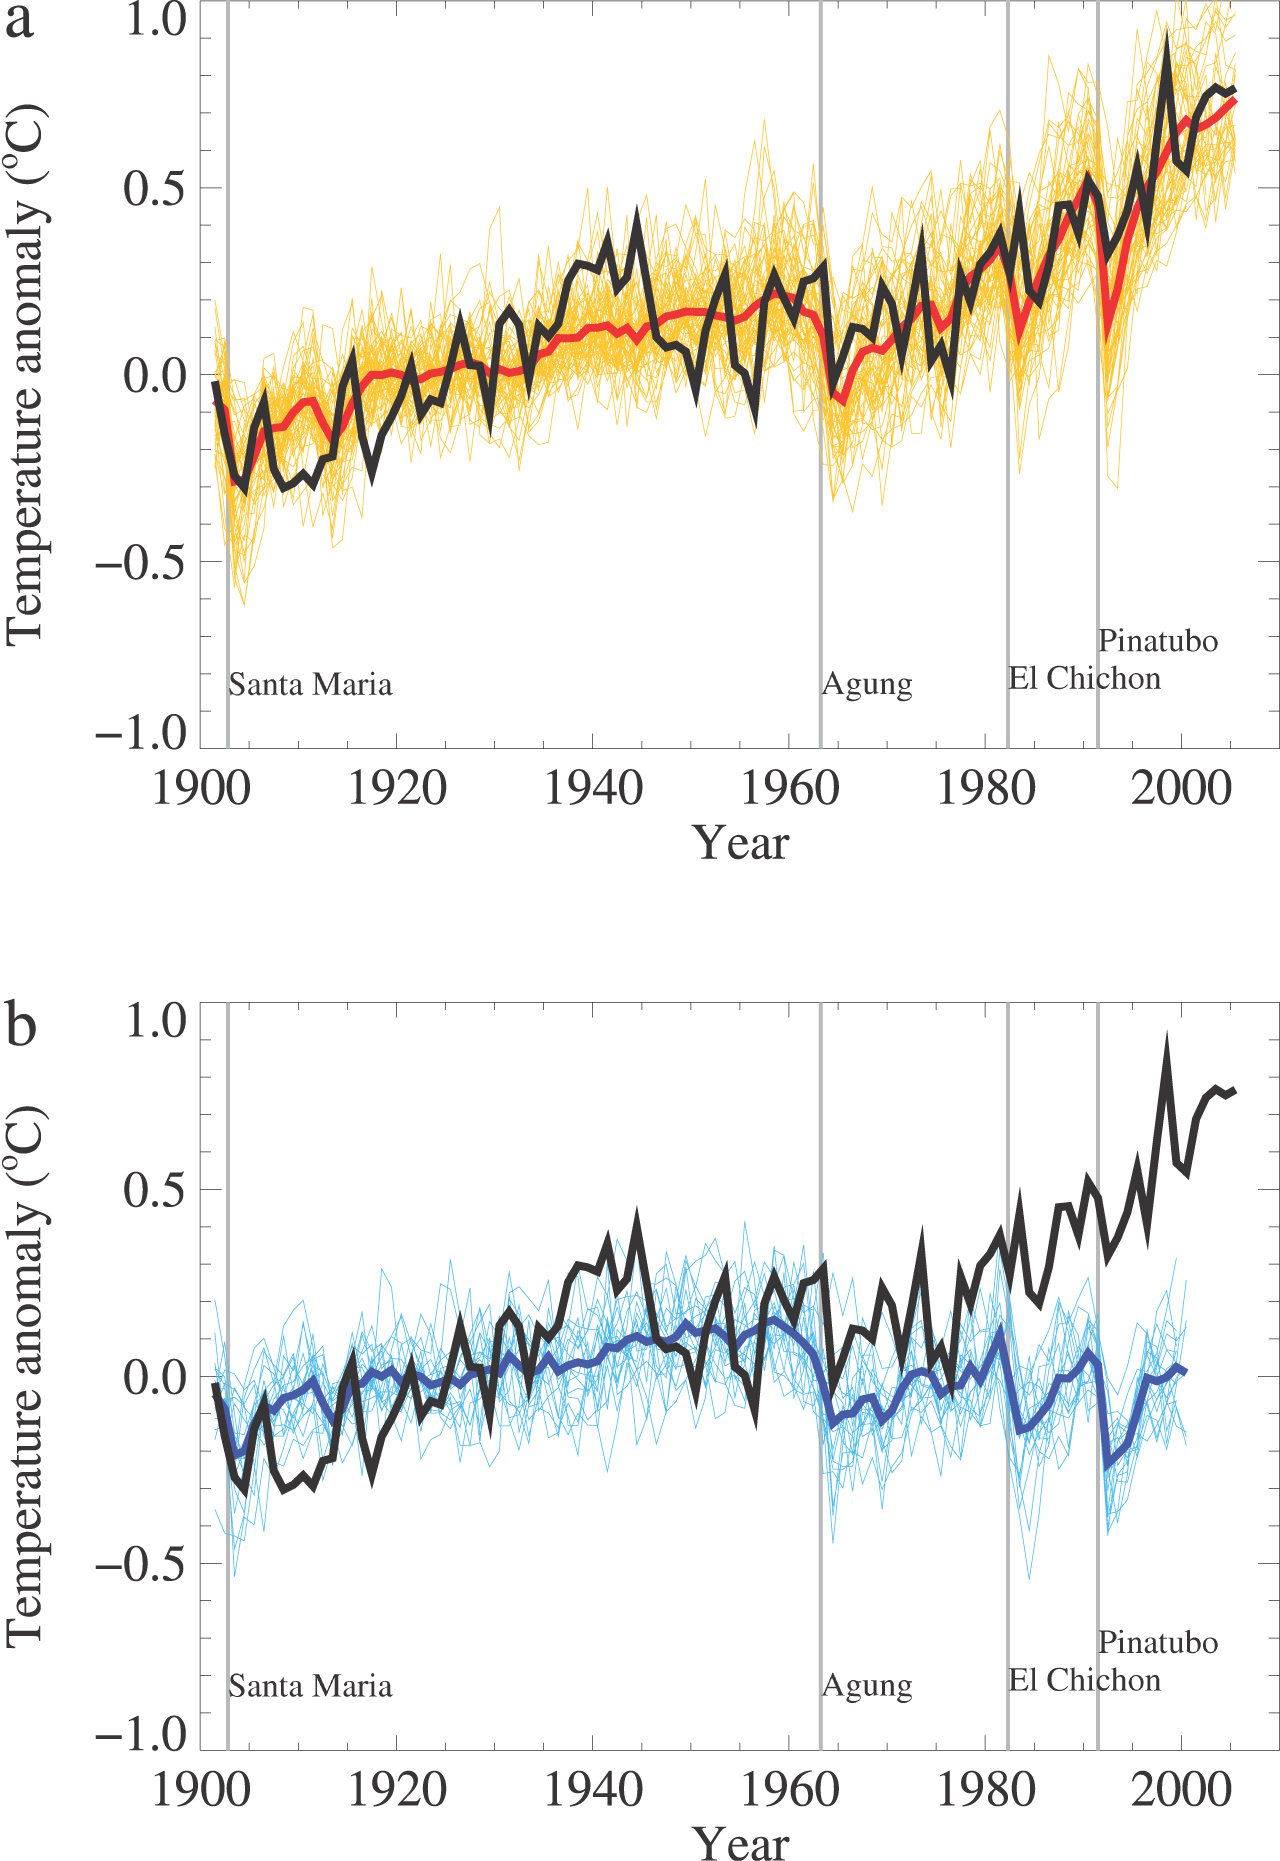 As you can see, the model results for actual forcings (Red line, graph a) very closely follow the observations (black line). Therefore in a graph such as you show, the model results would be shown by a scatter plot that overlapped with the observed data through out its entire range, and which had nearly the same mean for most of it.
Fairly obviously the line labelled "Model Range"is therefore not the model range at all. Rather it is a simple plot based on a projected response function of temperature to CO2 of 3 degrees per doubling. As noted by Sphaerica, that response function is not the climate sensitivity. I note, however, that the IPCC definition of Transient Climate Response states:
As you can see, the model results for actual forcings (Red line, graph a) very closely follow the observations (black line). Therefore in a graph such as you show, the model results would be shown by a scatter plot that overlapped with the observed data through out its entire range, and which had nearly the same mean for most of it.
Fairly obviously the line labelled "Model Range"is therefore not the model range at all. Rather it is a simple plot based on a projected response function of temperature to CO2 of 3 degrees per doubling. As noted by Sphaerica, that response function is not the climate sensitivity. I note, however, that the IPCC definition of Transient Climate Response states:
"The transient climate response is the change in the global surface temperature, averaged over a 20-year period, centred at the time of atmospheric carbon dioxide doubling, that is, at year 70 in a 1% yr–1 compound carbon dioxide increase experiment with a global coupled climate model. It is a measure of the strength and rapidity of the surface temperature response to greenhouse gas forcing."
In other words, the Transient Climate Response is not the immediate response of temperature in the year of the change of CO2 concentration. As such, and contrary to Sphaerica, the graph plotted is not a graph of the Transient Climate Response. To plot that you would need to plot CO2 concentration against lagged temperature. Even then you would still face confounding factors in the effects of other Green House Gases, increases in solar radiation, and most particularly, changes in Aerosol Optical Depth. It is dubious, therefore, that such a plot will give anything better than a vague approximation of the Transient Climate Response. However, if you were to plot the IPCC TCR on the graph for comparison, the IPCC AR4 value for the TCR for a doubling of CO2 is between 1 and 3 degrees C:"Agreement among models for projected transient climate change has also improved since the TAR. The range of transient climate responses (defined as the global average surface air temperature averaged over a 20-year period centred at the time of CO2 doubling in a 1% yr–1 increase experiment) among models is smaller than the range in the equilibrium climate sensitivity. This parameter is now better constrained by multi-model ensembles and comparisons with observations; it is very likely to be greater than 1°C and very unlikely to be greater than 3°C. The transient climate response is related to sensitivity in a nonlinear way such that high sensitivities are not immediately manifested in the short-term response. Transient climate response is strongly affected by the rate of ocean heat uptake. Although the ocean models have improved, systematic model biases and limited ocean temperature data to evaluate transient ocean heat uptake affect the accuracy of current estimates. {8.3, 8.6, 9.4, 9.6, 10.5}"
(Note, this quote is from the Working Group 1 technical summary. The numbers at the end are relevant section of the WG1 report for further details.) In looking at the graph I noticed that the measurement range of CO2 was from 287.50 - 388 ppmv. The temperature range was 0.8 degrees C. That strongly suggests the temperature data was taken from Gisstemp, and that the time interval of the graph was from 1880 to approx 2009. This information, and the information about who produced the graph should always be included in any graph used for teaching (or science in general). I also notice from the large number of temperature values at the lowest CO2 value that the plot was made against the most recent ice core value of CO2 concentration prior to the availability of Mauna Loa data. Using that method instead of plotting against a smoothed value introduces further inaccuracies to the graph. There is some possibility that values other than ice core values where used prior to 1959. If so, that should be specified, and great care taken as many CO2 measurements prior to 1958 are strongly distorted by local sources and sinks of CO2 (factories, roads, forests). In sum, this graph provides an excellent teaching opportunity. Specifically, it can be used to show how so called "skeptics" use incorrect values (3.25 instead of 3 for the IPCC central estimate of climate sensitivity; mislabel data (labeling a mathematical estimate as "Global Warming Models"); do not properly understand the data they are analyzing (ie, presenting it as a plot showing climate sensitivity, when the technique can show Transient Climate Response at best, and is likely to underestimate it); and do not take into account proper caveattes on the data (due to the unmentioned confounding factors). As such, it presents an excellent opportunity to show the difference between the pseudo-science of so-called skeptics and the genuine science as reported on by the IPCC. It also is an excellent opportunity to show that the vast majority of objections to climate science only masquerade as being science based, but are in fact political in nature, employing as they do pseudo-science rather than science to back up their claims. -
Matt Arkell at 12:33 PM on 18 February 2012Breaking News…The Earth Is Warming…Still!
Glenn Tamblyn: The important issue with the geothermal flow is not just its magnitude which is part of the normal energy balance of the planet, but how much that flux could change because it is that that would be the driver of any contribution it might make to change in the ocean heat content. I'm aware of that, however I wanted to get a handle on the magnitude of the difference between the two. If the heat flux (averaged across the entire ocean floor) is ~13% of the total change in heat content, then the changes required in geothermal heat flux would have to be enormous in relation to the average value. While searching for data, I found this page showing the variation across the ocean floor in the geothermal heat flow data. The greatest values are along the East Pacific Rise, and reach no more than ~350 mW/m2. This suggests that enough variability doesn't exist, certainly not on the scales necessary to have a significant impact on OHC worldwide. -
MattJ at 12:29 PM on 18 February 2012Breaking News…The Earth Is Warming…Still!
I can't claim that this article proves my guess was right, but it does encourage me to believe the guess I made a couple of years ago: if there is a successful "geo-engineering" project to save the world from the worst of AGW, it will be accomplished not by spraying aerosols in the air, but by manipulating ocean currents so that the oceans can absorb more of the heat. That said, I still believe that we do not know enough to embark on ANY geo-engineering project yet, we might not know enough for decades to come. We could easily end up just making things worse. -
ejo60 at 12:16 PM on 18 February 2012DenialGate Highlights Heartland's Selective NIPCC Science
The NIPCC project aims raise doubt about climate change, it contains a lot of misinformation, therefore nobody in climate science believes the NIPCC report. But this is different outside science, many folks out there believe the Heartland message that climate change is a hoax. And in this sense the NIPCC has been successful. Also, I can confirm that one of the Dutch authors on the NIPCC report attempted to get more scientists involved. It all fits in the strategy of the Heartland institute, namely to discredit science in order to gain a strategic advantage in a public debate. Last year Nature had an article with since remarkable statements made by Joe Bast, in my opinion most information was known before the documents leaked. link On my blog I keep a collection of articles related to leak at the Heartland Institute. -
scaddenp at 12:01 PM on 18 February 2012Breaking News…The Earth Is Warming…Still!
And another point about the estimation of geothermal energy... the petroleum industry invest heavily in understanding this. It is a crucial input to sedimentary models used for determining if and when a basin could be generating oil and gas. I think they would have noticed and reported loudly if there was any suggestion that the accepted geothermal heat flux rate were underestimated. Volcanoes and associated events are extremely localised heating. -
Glenn Tamblyn at 11:20 AM on 18 February 2012Breaking News…The Earth Is Warming…Still!
wrt to Geothermal Energy, the following from Wikipedia gives some sense of its relative magnitude: "The Earth's internal thermal energy flows to the surface by conduction at a rate of 44.2 terawatts (TW),[33] and is replenished by radioactive decay of minerals at a rate of 30 TW.[34] These power rates are more than double humanity’s current energy consumption from all primary sources, but most of this energy flow is not recoverable. In addition to the internal heat flows, the top layer of the surface to a depth of 10 meters (33 ft) is heated by solar energy during the summer, and releases that energy and cools during the winter. Outside of the seasonal variations, the geothermal gradient of temperatures through the crust is 25–30 °C (45–54 °F) per kilometer of depth in most of the world. The conductive heat flux averages 0.1 MW/km2. These values are much higher near tectonic plate boundaries where the crust is thinner. They may be further augmented by fluid circulation, either through magma conduits, hot springs, hydrothermal circulation or a combination of these." 0.1 MW/km2 is 0.1W/M2. Contrast this with Solar absorbed by the surface at around 161 W/M2, back radiation at around 333 W/M2 and the forcing due to a doubling of CO2 of 3.7 W/M2. Geothermal is present but it is 3 orders of magnitude smaller than the main components of the energy balance in the atmosphere. And while it is conceivable that a major subsea volcano might put out enough heat to cause a circulation, heat flows from diffuse sources like vents are pretty unlikely to to contribute much. And the key issue with Geothermal energy is that, apart from major eruptions, there is no sensible mechanism for why the output wouldfluctuate significantly. What must also be remembered is that when we look at the major ocean currents, they may move slowly but the water volumes are massive. So there is a huge amount of kinetic energy in them that can then drive all sorts of complex circulation behaviour. So secondary circulations like gyres aren't really surprising in the context of the whole ocean, and that their behaviour can change from time to time isn't really surprising either. Matt Arkell. The important issue with the geothermal flow is not just its magnitude which is part of the normal energy balance of the planet, but how much that flux could change because it is that that would be the driver of any contribution it might make to change in the ocean heat content. -
skywatcher at 11:15 AM on 18 February 2012Global Warming: Trend and Variation
#85, a single site is not a good measure of global sea level rise, I'm sure you know that. Global sea level measurements are running at the top of the IPCC projections, showing they most likely underestimated sea level rise. Recent papers support this conclusion, and the IPCC SLR figure is likely to be revised upwards in the next report. So I don't believe your last para unequivocally, I think it is an underestimate! You include a couple of irrelevant points. The 120m SLR that concluded in the Early Holocene is as irrelevant to recent sea level as sea level rise in the Jurassic. Although it has some relevance for showing how much oceans can rise (and how fast - Meltwater Pulse 1A) when you melt ice sheets. The Little Ice Age is similarly irrelevant - what on earth do you suppose is the main reason temperatures have risen ~1C since the LIA, and especially since the 1960s? -
Stephen Baines at 10:44 AM on 18 February 2012Breaking News…The Earth Is Warming…Still!
To emphasize KRs point, one need only look at the fact that temperature within tens of meters away from those vents is back to 3-4C. The vastness of the deep ocean provides enough heat capacity to easily dilute that geothermal heat and maintain a very constant temperature. For those geothermal vents to force upwelling through the permanent thermocline, they would have to exert a wide ranging and persistent effect of temperature that would be very obvious. We simply do not see that. -
Matt Arkell at 10:43 AM on 18 February 2012Breaking News…The Earth Is Warming…Still!
I read this line: But the absolute clincher is that the amount of heat going into the oceans is so great that no other source of heat here on Earth could supply it and was curious to know the numbers. While I had an intuitive sense the statement was correct, having studied geothermal heat as a power source in the past, I felt interested to see just how different the heat fluxes from above and below are, just in case I ever get asked. Now obviously I'm comparing apples and oranges to an extent, there isn't much mixing between the parts of the ocean where these heat flows wind up, but the numbers are interesting nonetheless. The heat flow into the top 700 m from 1993-2003 averages out at 257 TW (from the IPCC report graph), while the geothermal heat flow from oceanic crust is 35 TW (from Pollack, 1993; heatflow of 97 mW/m2). So the geothermal flow is only ~13% that of the additional heat being pumped into the top 700 m, which is quite a small amount. In fact I'm a little surprised that no-one I've ever talked to has asked whether the OHC anomaly could be coming from the bottom up instead. Of course, for this to be the case, the oceans would have to operate on a vastly different mechanism to how they are known to operate, even if the heatflow was sufficient. -
Rob Painting at 10:35 AM on 18 February 2012Breaking News…The Earth Is Warming…Still!
Guardianista2012- "I don't think my suggestion should be dismissed out of hand" Why not? There have been decades of research on this topic. Has it not occurred to you that this may have been seriously considered decades ago and found wanting? It simply does not gel with the observations. I suggest you watch that animation to gain a better understanding of ENSO. And for your information, the tiny contribution of geothermal heat in the very deep sea, the abyssal ocean, is responsible for the upwelling arm of the Thermohaline Circulation. It's not exactly like scientists don't know this. -
Breaking News…The Earth Is Warming…Still!
Guardianista2012 - The amount of energy released by volcanic activity, and in fact by all heat percolating out of the Earth's core, is tiny with respect to the observed heat changes in the climate. Also note that modeling the physics of aperiodic circulations such as the ENSO shows such variations emerging from wind and circulation as we understand it - in other words, the physics of atmospheric and oceanic circulation show ENSO type variations as emergent properties of the system. No need for warming the bottom of the pot whatsoever. Given the stratification shown in ocean temperatures, heat coming from the ocean floor or vents would be easily discernible as warm layers on the ocean floor. No such evidence exists to support your hypothesis. So: there's insufficient energy available from geothermal activity, and no evidence for vents driving circulatory changes. -
Guardianista2012 at 10:17 AM on 18 February 2012Breaking News…The Earth Is Warming…Still!
I don't think my suggestion should be dismissed out of hand. I've found this article, which confirms that geothermal vents do exist:- http://pubs.usgs.gov/gip/dynamic/exploring.html ENSO may be just in the tropics, but there are other less significant upwelling phenomenon all over the world. -
Breaking News…The Earth Is Warming…Still!
skept.fr - "There are no other ways for dissipating energy?" The only way for the Earth climate to dissipate energy (if you correctly delineate the system boundaries, as Glenn Tamblyn has done in this post) is by radiating it to space. The heat content is the total of atmospheric, surface, ocean, and cryosphere segments, with the oceans representing by far the largest portion. Increasing heat content in the oceans isn't dissipating a heat imbalance - it's simply going somewhere in the climate that's harder to directly observe/experience than the atmosphere. And that total imbalance is what is changing our climate over the long haul. That's the entire point of this thread! -
Rob Painting at 10:03 AM on 18 February 2012Breaking News…The Earth Is Warming…Still!
skept.fr - "For example, I don't figure clearly why an energy imbalance would imply just a heat content change in oceans. There are no other ways for dissipating energy?" Increase the levels of greenhouse gases in the atmosphere and less heat escapes to space. The double-whammy is that greenhouse gases trap more heat in the ocean too. The combined effect is less heat being lost to space, and the Earth warms. This warming causes an energy imbalance at the top-of-the-atmosphere (less energy in the form of heat is radiated out to space). The current imbalance is, in effect, future warming in store for us. Where else do you propose energy can be stored on Earth? -
Rob Painting at 09:52 AM on 18 February 2012Breaking News…The Earth Is Warming…Still!
Guardianista2012 -Is there any problem with my suggestion that ENSO events could be sourced from below, though? Yes. ENSO is a tropically-driven phenomenon, is it your contention that these mysterious geothermal vents straddle the equator in the Pacific? Actually there are so many problems with your assertion that it's better you watch this animation and understand how ENSO operates, rather than put forth "what if......", and "maybe......" There is a vast body of scientific literature on ENSO, and there was a recent (2012) review at NCAR which deals with the various proposed mechanisms - I'll see if I can track it down, if you're interested. -
Bob Lacatena at 09:48 AM on 18 February 2012Climate sensitivity is low
Stephen, I didn't even notice that the graph had upped it to 3.25. SirNubWub, I'd almost think you were a denier-in-disguise, playing hard-to-notice tricks with your audience. The number is 3 (or better yet, the range between 2 and 4.5). And transient sensitivity is around 2. And there is absolutely nothing at all behind any such denial argument (and please don't call them skeptics, because they aren't, if they were skeptical they would have researched the issue well enough to figure this out for themselves and not bother to make such a specious argument). -
Stephen Baines at 09:24 AM on 18 February 2012Climate sensitivity is low
It should also be pointed out that the IPCC quotes 3C/doubling as the most likely sensitivity. The value of 3.25 used above is a slight misrepresentation that overstates the mismatch. It is the average of the upper and lower extremes (2 and 4.5 respectively) cited by the IPCC, but the probability distribution is not symmetrical between these extremes. -
Bob Lacatena at 09:08 AM on 18 February 2012Climate sensitivity is low
269, SirNubWub, First, for a high school text I suggest you use log2 rather than natural logs. If you do so, then your constants will actually be the climate sensitivity (3, 1.85 instead of 4.7, 2.73). For the discrepancy, the short answers: 1) The model as described is far too simplistic. For instance, it presumes that the only influence on climate in the past 100 years has been CO2. More specifically, it ignores the opposing anthropogenic negative forcing of aerosols. Unfortunately, as we work for cleaner air we are reducing the aerosols without reducing CO2 emissions. And if we were to stop abruptly, the added aerosols would quickly fall out of the atmosphere while the CO2 would stay active for hundreds/thousands of years. See this page of the IPCC AR4 report and more specifically this diagram. 2) The model presented only measures transient, not equilibrium climate sensitivity. The first is what you get from fairly fast feedbacks, while the latter is what you get if you wait long enough for the system to stabilize (which includes all ice sheet melting, ocean warming, ecosystem transitions, permafrost methane releases, etc.). Transient climate sensitivity is estimated to be about 2˚C per doubling, and equilibrium sensitivity about 3˚C, so your 1.85˚C/doubling number is pretty close, especially after you consider the negative influence of aerosols. Sadly, the ice on Earth is far from finished melting, the carbon cycle is far from equalizing, and the oceans are far from absorbing as much heat as they can. 3) The model presumes that warming is instantaneous. Honestly, very few times in the history of the earth has a forcing of this magnitude been applied this quickly. It is very hard to predict how long it will take for the forcing imbalance to raise the planet to new equilibrium temperatures, even without considering the slow (equilibrium) feedbacks. -
SirNubwub at 08:29 AM on 18 February 2012Climate sensitivity is low
Hello First of all, hats off to this website for its clarity and ease-of use. It has been a great source of information for me. I am developing a high-school physics chapter where I show the back-and-forth debate on AGW. Here is a skeptic's graph that they say shows that observed temps/CO2 levels of the last 100+ years indicate a climate sensitivity of about 1.85. Can you please tell me how the skeptics have their data/graph/conclusions wrong? (please remember that the audience is going to be high-schoolers). the graph can be seen more clearly at http://img152.imageshack.us/img152/6972/zoominco2logwarmingwp3.png I am not here to debate the issue, just to get information and to move on to the next topic. I thank you in advance. muoncounter at 08:15 AM on 18 February 2012Skepticism About Lower Atmosphere Temperature Data
Camburn#33: It is also helpful if you note the age of your cites. These papers are from 2009 and are therefore not news; they may not even be shedding any valid light on current trends.Stephen Baines at 08:01 AM on 18 February 2012DenialGate Highlights Heartland's Selective NIPCC Science
Dennis, I believe all those societies have produced statements that clearly indicate that the position of the NIPCC is incorrect, without naming it directly. Societies like AGU, AAAS and ESA have been increasing their efforts to communicate, but the fact is that there are no "PR machines" to put into gear and there won't be anytime soon. In fact, I'd argue the mission of these organizations makes them uniquely unsuited to doing this task. They do not have the resources to even identify, much less debunk all the misinformation out there. That's why I come to this site! Heartland's sole purpose is to promote positions that are at odds with the science, without concern for whether those positions are correct. They don't have to do the peer-reviewed research, they don't have to administer to the million and one other obligations facing a scientific society. They don't even have to follow the rules of logic or evidence! All they have to do is craft a message and plug into a preexisting echo chamber that has been constructed over a long period of time to amplify messages from other like minded think tanks. The scientific societies do not have access to that echo chamber -- it was not built for them. Places like Sks, or RealClimate go some ways to filling that role.skept.fr at 08:00 AM on 18 February 2012Breaking News…The Earth Is Warming…Still!
The point by #14 Glenn is interesting. Is there an educational web source which explains and if possible quantifies the different exchanges in the oceanic "energy system" (inside ocean, between layers, and also with atmosphere). For laymen, it is quite obscure: there's much attention for atmosphere mechanisms (3% of heat content) and few explanations for ocean (90%). For example, I don't figure clearly why an energy imbalance would imply just a heat content change in oceans. There are no other ways for dissipating energy?Guardianista2012 at 07:52 AM on 18 February 2012Breaking News…The Earth Is Warming…Still!
Thanks Glen, I can see what you're saying there now. There's still a puzzle in my mind why the warm water would get drawn down in the first place, though. Is there any problem with my suggestion that ENSO events could be sourced from below, though? We know there's heat down there, so why wouldn't it permeate to the sea floor and heat the water from below? Obviously, we're talking subtle temp changes but over a whole planet could explain the variable temps we see.Glenn Tamblyn at 07:39 AM on 18 February 2012Breaking News…The Earth Is Warming…Still!
Guardianista2012 Heat will only rise back towards the surface if the water below is warmer than that above. This will depend on how much mixing occurs when the warm water from the surface meets the cooler water at the bottom of the gyres. Just because the lower waters have been heated doesn't automatically mean that they will be warmer than the water above. The heat figures just mean that they are warmer than they had been previously.Stephen Baines at 07:39 AM on 18 February 2012DenialGate Highlights Heartland's Selective NIPCC Science
WheelsOC, I take your point that disengaging is not the correct thing to do. But scientists do engage quite a bit through the IPCC mechanism. Every 5-7 years scientists donate thousands of hours of time to the purpose to providing the clearest view of the consensus. A number of them spend inordinate time addressing public pseudoscience. My point was that you have to pick your battles given these other laudable efforts. I personally don't feel that engaging in report battles is the best way. They reach a limited self-selecting audience and their impact can be manipulated easily. There is no gaurantee that such a report will get the attention it deserves. It's not as if every reputable scientific society has not made a clear statement on the issue and members of the NAS have not chimed in with a letter that got largely ignored. One can make the case that if the IPCC report did not work when addressing the same issues as the NIPCC, why would yet another report succeed? I think Dana's approach here and Sks in general are far better suited to handling the debunking of the NIPCC for truly inquisitive people like yourself. In addition to these debunkings, Sks makes an effort to show how current research keeps showing us over and over that real climate science is moving forward. On the other hand, a good public forum like the Dover trials would be an excellent place to have a give and take about climate pseudoscience. Scientists would gladly participate in that as the ground rules are clear and the aim of the court is to get at the truth, not to press an agenda. Those kinds of fora have been few and far between in the "climate wars" though. It seems to me its a deliberate tactic by those disputing the consensus to avoid such exposure. After all, many on the ID side thought the Dover trials were a clear tactical error.
Prev 1264 1265 1266 1267 1268 1269 1270 1271 1272 1273 1274 1275 1276 1277 1278 1279 Next


