


 Arguments


Future projections of Antarctic ice shelf melting
Posted on 3 July 2018 by Guest Author
This is a re-post from ClimateSight
Climate change will increase ice shelf melt rates around Antarctica. That’s the not-very-surprising conclusion of my latest modelling study, done in collaboration with both Australian and German researchers, which was just published in Journal of Climate. Here’s the less intuitive result: much of the projected increase in melt rates is actually linked to a decrease in sea ice formation.
That’s a lot of different kinds of ice, so let’s back up a bit. Sea ice is just frozen seawater. But ice shelves (as well as ice sheets and icebergs) are originally formed of snow. Snow falls on the Antarctic continent, and over many years compacts into a system of interconnected glaciers that we call an ice sheet. These glaciers flow downhill towards the coast. If they hit the coast and keep going, floating on the ocean surface, the floating bits are called ice shelves. Sometimes the edges of ice shelves will break off and form icebergs, but they don’t really come into this story.
Climate models don’t typically include ice sheets, or ice shelves, or icebergs. This is one reason why projections of sea level rise are so uncertain. But some standalone ocean models do include ice shelves. At least, they include the little pockets of ocean beneath the ice shelves – we call them ice shelf cavities – and can simulate the melting and refreezing that happens on the ice shelf base.
We took one of these ocean/ice-shelf models and forced it with the atmospheric output of regular climate models, which periodically make projections of climate change from now until the end of the century. We completed four different simulations, consisting of two different greenhouse gas emissions scenarios (“Representative Concentration Pathways” or RCPs) and two different choices of climate model (“ACCESS 1.0”, or “MMM” for the multi-model mean). Each simulation required 896 processors on the supercomputer in Canberra. By comparison, your laptop or desktop computer probably has about 4 processors. These are pretty sizable models!
In every simulation, and in every region of Antarctica, ice shelf melting increased over the 21st century. The total increase ranged from 41% to 129% depending on the scenario. The largest increases occurred in the Amundsen Sea region, marked with red circles in the maps below, which happens to be the region exhibiting the most severe melting in recent observations. In the most extreme scenario, ice shelf melting in this region nearly quadrupled.

Percent change in ice shelf melting, caused by the ocean, during the four future projections. The values are shown for all of Antarctica (written on the centre of the continent) as well as split up into eight sectors (colour-coded, written inside the circles). Figure 3 of Naughten et al., 2018, © American Meteorological Society.
So what processes were causing this melting? This is where the sea ice comes in. When sea ice forms, it spits out most of the salt from the seawater (brine rejection), leaving the remaining water saltier than before. Salty water is denser than fresh water, so it sinks. This drives a lot of vertical mixing, and the heat from warmer, deeper water is lost to the atmosphere. The ocean surrounding Antarctica is unusual in that the deep water is generally warmer than the surface water. We call this warm, deep water Circumpolar Deep Water, and it’s currently the biggest threat to the Antarctic Ice Sheet. (I say “warm” – it’s only about 1°C, so you wouldn’t want to go swimming in it, but it’s plenty warm enough to melt ice.)
In our simulations, warming winters caused a decrease in sea ice formation. So there was less brine rejection, causing fresher surface waters, causing less vertical mixing, and the warmth of Circumpolar Deep Water was no longer lost to the atmosphere. As a result, ocean temperatures near the bottom of the Amundsen Sea increased. This better-preserved Circumpolar Deep Water found its way into ice shelf cavities, causing large increases in melting.
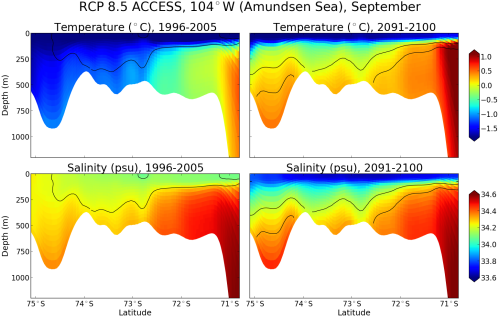
Slices through the Amundsen Sea – you’re looking at the ocean sideways, like a slice of birthday cake, so you can see the vertical structure. Temperature is shown on the top row (blue is cold, red is warm); salinity is shown on the bottom row (blue is fresh, red is salty). Conditions at the beginning of the simulation are shown in the left 2 panels, and conditions at the end of the simulation are shown in the right 2 panels. At the beginning of the simulation, notice how the warm, salty Circumpolar Deep Water rises onto the continental shelf from the north (right side of each panel), but it gets cooler and fresher as it travels south (towards the left) due to vertical mixing. At the end of the simulation, the surface water has freshened and the vertical mixing has weakened, so the warmth of the Circumpolar Deep Water is preserved. Figure 8 of Naughten et al., 2018, © American Meteorological Society.
This link between weakened sea ice formation and increased ice shelf melting has troubling implications for sea level rise. Unfortunately, models like the one we used for this study can’t actually be used to simulate sea level rise, as they have to assume that ice shelf geometry stays constant. No matter how much ice shelf melting the model simulates, the ice shelves aren’t allowed to thin or collapse. Basically, this design assumes that any ocean-driven melting is exactly compensated by the flow of the upstream glacier such that ice shelf geometry remains constant.
Of course this is not a good assumption, because we’re observing ice shelves thinning all over the place, and a few have even collapsed. But removing this assumption would necessitate coupling with an ice sheet model, which presents major engineering challenges. We’re working on it – at least ten different research groups around the world – and over the next few years, fully coupled ice-sheet/ocean models should be ready to use for the most reliable sea level rise projections yet.


The author, Dr Naughten, states that: ‘In our simulations, warming winters caused a decrease in sea ice formation. So there was less brine rejection, causing fresher surface waters, causing less vertical mixing, and the warmth of Circumpolar Deep Water was no longer lost to the atmosphere. As a result, ocean temperatures near the bottom of the Amundsen Sea increased.’ If there is less brine rejection how can this produce fresher surface water? Surely the converse would be true.
I am inclined to the view held by Dr Hansen et al 2016, that a combination of ice-shelf disintegration producing faster glacier discharge and increasing ice sheet surface temperature at its margins produces a fresh water lens on the sea surface, inhibiting overturning circulation, as the cause of warming bottom water formation.
Riduna, I think what they are saying is in the past we typically had lot of sea ice so a very salty top layer of water, but with less sea ice typically forming now the surface is less salty compared to the previous historical pattern, so the circulation pattern has changed for part of the year at least. I could be wrong, its complicated to get ones head around.
I think Hansen is talking about something different about ice shelves around the base of glaciers and glacier flow, so a different mechanism that is also ultimately producing a fresh surface water layer.
Fwiw I think there is a substantial risk of this glacier discharge producing accelerated melting in the Antarctic with multi metre sea level rise this century, maybe 2 metres is my pick. The paleo climate record shows its happened before at similar warming to what we expect this century, so I ask people, why wouldn't it happen now?