


 Arguments
Software
Resources
Comments
The Consensus Project
Translations
About
Support
Arguments
Software
Resources
Comments
The Consensus Project
Translations
About
Support
![]()
![]()
![]()
![]()
![]()
![]()
![]()
![]()
![]()
![]()


![]()


Latest Posts
- 2024 SkS Weekly Climate Change & Global Warming News Roundup #20
- Fact Brief - Does breathing contribute to CO2 buildup in the atmosphere?
- Skeptical Science New Research for Week #20 2024
- Drought fuels wildfire concerns as Canada braces for another intense summer
- At a glance - What ended the Little ice Age?
- Climate change is making hurricanes more destructive
- 2024 SkS Weekly Climate Change & Global Warming News Roundup #19
- Skeptical Science New Research for Week #19 2024
- Climate Adam: How to visualise Climate Change (ft. Katharine Hayhoe)
- At a glance - Tree ring proxies and the divergence problem
- Why India is key to heading off climate catastrophe
- 2024 SkS Weekly Climate Change & Global Warming News Roundup #18
- Skeptical Science New Research for Week #18 2024
- At a glance - Clearing up misconceptions regarding 'hide the decline'
- Pinning down climate change's role in extreme weather
- 2024 SkS Weekly Climate Change & Global Warming News Roundup #17
- Fact Brief - Is Antarctica gaining land ice?
- Simon Clark: The climate lies you'll hear this year
- Skeptical Science New Research for Week #17 2024
- Water is at the heart of farmers’ struggle to survive in Benin
- At a glance - The difference between weather and climate
- India makes a big bet on electric buses
- 2024 SkS Weekly Climate Change & Global Warming News Roundup #16
- EGU2024 - An intense week of joining sessions virtually
- Skeptical Science New Research for Week #16 2024
- How extreme was the Earth's temperature in 2023
- At a glance - Is the science settled?
- What is Mexico doing about climate change?
- 2024 SkS Weekly Climate Change & Global Warming News Roundup #15
- Fact Brief - Did global warming stop in 1998?
Comment Search Results
Search for Greenland GISP2
Comments matching the search Greenland GISP2:
- Arctic sea ice loss is matched by Antarctic sea ice gain
Daniel Bailey at 05:40 AM on 4 June, 2021@Joe Levesque, per NOAA's Arctic Report Card 2017, current Arctic temperature anomalies and low values of Arctic sea ice extent are unprecedented over the past 1,500 years.

Expanding upon that, it's far warmer now in Greenland than it was at any point during the Viking habitation of it. The few Vikings that survived left rather than die there (and the Inuit thrived there the entire time and still do so today).

As a matter of additional fact, it's far warmer now in Greenland than it has been in the past 10,000 years.

Back to you.
- CO2 lags temperature
Eclectic at 22:50 PM on 2 February, 2020In reply to commenter "Map" , from the other thread :-
Map, we must be careful to avoid semantic problems/confusions, so it is best if we all communicate in the standard scientific language (i.e. meaning of terms). You will mislead yourself if you use terms such as "minor ice ages" every 21000 years and "major ice ages" every 43000 years. For that is not what the well-established Milankovitch theory indicates. (See ice-albedo , CO2 feedback, etcetera.)
You haven't said exactly, but you seemed to be referring to Greenland ice cores (such as GISP2 from central Greenland). Their data comes from local conditions ~ not from global temperature changes.
There have been interestingly large/rapid swings in temperature shown in GISP2 data, but these are are mostly around the unusual event of the Younger Dryas . . . and do not reflect a basic global climate change (nor the inflow/outflow of heat energy which is the underlying cause of climate change).
For the sudden rise you mentioned, please permit me to quote climate expert Richard Alley :- "[temperature increase was] for Greenland, and applies moderately well around the North Atlantic, primarily as a wintertime change because there was a rapid shift from wintertime sea ice to wintertime open water in important regions. ... I can provide lots of chapters and verses on all of this, but the skinny version is that when the abrupt shifts happened, they primarily involved circulation rather than greenhouse gases, they didn't do a lot to global mean temperature, but they did do a lot to regional climates in many places, with large, rapid changes in North Atlantic temperatures, rapid shifts in monsoonal rains and in the edges of the tropical rain belts, smaller shifts in northern temperatures away from the North Atlantic, and lagged and opposite shifts in southern temperatures (so northern warming was followed by southern cooling)".
Map, I hope that provides you somewhat of a help. Please note that the big swings in the GISP2 proxy temperature data . . . are often displayed in the Deniosphere (of science-denying websites) ~ where it is implied that it's a world temperature chart. Worse, the GISP2 graph ends at 1855 (yes, eighteen fifty five ~ quite before the modern AGW temperature rise began) . . . and the chart scale is so compressed, that the casual reader is misled into believing past temperatures were much higher than modern times.
Denialist websites, such as WattsUpWithThat [WUWT] are well-known for these types of deceptions & falsehoods. Map, if that's where you've been getting some of your information/misinformation . . . then you have been handicapping yourself. WUWT contains all sorts of propaganda ~ and a lot of mutually contradictory crackpottery . . . and the comments sections there are half-filled with people who are still in complete denial of the basic physics of CO2 radiational properties. Really a snake-pit of intellectual insanity !
- CO2 lags temperature
michael sweet at 20:27 PM on 2 February, 2020MARodger,
Thank you for the reference to the 2006 report in NASA's Earth Observatory, they do say 15F in 10 years. When I found their referenced source of the GISP2 temperature and accumulation data (file did not open on this computer, sorry for no link), the data is all sectioned off in 50-80 year sections so a 10 year claim is not supported. In addition, 15F would be about 8C and there is no change anywhere near that magnitude (in 50 years not 10) in the record. It seems to me that the NASA report has a typo in it.
To address Map's question, this is data for a single location on Greenland and not global data. The temperature change in Greenland was over 20C since the last ice age while Earth average was 4C according to the data in the OP. In addition. there is much more noise in data from a single location than from an average for the entire Earth. Conflating Greenland data for the Earth's average is simply incorrect.
You ask several questions in your last post. It is difficult to respond to several questions separated only by a question mark. Please ask one at a time. Start with the one that is most important to you.
- 1934 - hottest year on record
Eclectic at 12:26 PM on 2 February, 2020Philippe ~ yes, sorry about that effort on your part.
Our good commenter "Map" was perhaps referring to the local regional temperature changes shown in Greenland's GISP2 ice core during the transient fluctuations of the Younger Dryas . . . and he was trying to imply that they were global climate changes "inexplicable by mainstream climate science". My first thought was that he might have been a newbie, grossly uninformed on the topic . . . though there was a wiff of sly science-denialist argumentativeness in his wording. And the latter case has become more evident (only much less sly! ) .
I am sure I am not telling you anything new in all this, Philippe. I just wished to put it on the record, for later readers who come along.
- It's cooling
MA Rodger at 03:09 AM on 14 October, 2019richieb1234 @306,
The GISP2 ice core temperature record is Greenland temperature not global temperature. High Northern latitudes will have cooled more than global averages since the Holocene Climate Optimum (5,000 years ago). As a result, a reconstructed Greenland temperature would show today's Greenland temperatures still below those of the Holocene Climate Optimum.
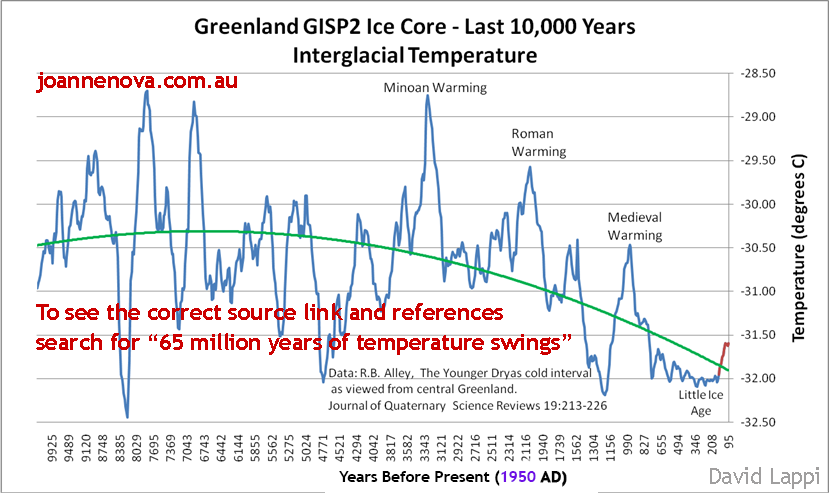
The GISP2 data is often recycled by denialists (the graph below is from your link) suggesting the final data point represents today when it is actually 95 years before 1950 = 1855. CarbonBrief have a recent factcheck of the GISP2 data's misuse by denialists, along with a Greenland temperature reconstruction from multiple ice cores and brought up-to-date with modern instrument data, the today's temperatures being Berkeley Earth 20-year averages to 2013.
Your link also features the infamous IPCC FAR Fig 7.1c saying "it has become so 'inconvenient' they haven't mentioned it since & some scientists have tried to eliminate it." Again FAR Fig 7.1c has been much misused by denialists. Yet it was always a “schematic diagram of global temperature variations” with the “dotted line nominally represents conditions near the beginning of the twentieth century.” If anybody reads the text of IPCC FAR, it would also indicate plainly just how schematic Fig 7.1c was. Additionally, if Fig 7.1c were meant to be an accurate global temperature record, the 0.15 deg C temperature increase shown for 1900-50 would be a bit of a clue.

- Planetary health and '12 years' to act
Daniel Bailey at 02:55 AM on 24 June, 2019
Global temperature reconstructions show this to be untrue.

"how can anyone conclude this current round of warming is entirely manmade?"
Because actual scientists, using the well-understood physics of our world, have established that it is only when the anthropogenic forcing is included that the observed warming can be explained.
Natural vs Anthropogenic Climate Forcings, per the NCA4, Volume 2:

Fun Factoid: Changes in the sun's output falling on the Earth are about 0.05 Watts/meter squared.
By comparison, human activities warm the Earth by about 2.83 Watts/meter squared (AR5, WG1, Chapter 8, section 8.3.2, p. 676).

"What also troubles me is the fact that the Medieval Warm Period was written out of the history books by the IPCC hockey stick graph. As well the impact of the 500 year period of cooling known as the Little Ice Age"
Another meme. Here's the "Hockey Stick For The Most Recent 1,700 Years", from the Trump Administration in 2017:

"the Earth was a lot warmer when the Vikings settled Greenland and Iceland"
Alreay refuted, but here's global temperatures with the period of the Viking occupation of Greenland highlighted:
And here's the temperatures from the GISP2 core from Greenland, with the instrumental temperature measurements taken from that same location added in for context:
"the Earth was a few degrees warmer during the Medieval Warm Period than it is today, then the polar ice cap was smaller and thinner than even now"
Your temperature claims were already refuted, but we have observational data to 1850 and proxy data going back millennia documenting Arctic sea ice extent changes over time.
For example, here's the last 1,500 years, from NOAA's Arctic Report card 2017:
You'll need to raise your game to compete in this venue. In this venue, the onus is on YOU to be able to support your claims (each claim) with source citations, preferably to credible sources. Further, many of your claims are already refuted on separate posts here (thousands exist, use the Search function to find the most appropriate post to make your claims and to stake your reputation on).
I'm sure that the moderation staff would prefer to not intervene here, but I'm equally sure that they will if you continue to post what is essentially a Gish Gallop of memes refuted many times before (PRATT).
Read the Comments Policy and construct your comments to comply with it and my advice to you and all will be fine.
- Models are unreliable
MA Rodger at 20:00 PM on 27 June, 2017NorrisM @1047,
A big long comment from you setting out a lot of stuff. Can I home in on the things you describe as "what also troubles me in everything that I have read so far on climate change." (As you say it is off topic for the thread but...)
(1) The Mediaeval Warm Period. This you describe as being "at least 200 years in at least Greenland and Northern Europe close to or equal to our present temperature." The temperature at the top of Greenland can be reconstructed from ice cores with some accuracy. GISP2, for instance shows results like this graph and some will take the last few thousand years of this graph as proof that recent warming is trivial when compared with previous centuries, as this SkS post describes. Yet the most recent GISP2 data dates from 1855 and when you graft on modern temperature data things look a whole lot different. The idea that Greenland experienced temperatures "close to or equal to our present temperature" is not borne out by the evidence.
2. "During the 1600's and 1700's there was ... skating on the Thames." We do have the CET Central England Temperature record stretching back into the 1600s, temperatures recorded a few dozen miles up the road from the Thames at London. This shows seriously cold winter month have been occuring occasionally throughout the record with the last occuring in 2010. History tells us that Ice Fairs were rare events and they do coincide (almost always) with these exceptional cold CET months. Ice Fairs stopped not because of a Little Ice Age ending or because of global warming but because the old London Bridge was demolished and the banks of the river were embanked. It's all a bit nerdy, but ancient accounts of the Thames freezing continue back in time and continue through the Mediaeval Warm Period (prior to the bridge being built) and are even found for the centuries called by some the Roman Warm Period.
3. You are on much safer ground suggesting that reconciling the temperature record and climate forcing in the first half of the 20th century is not straightforward but very much less safe with the so-called hiatus. There is a lot of comment on these elsewhere within the SkS site. You do raise the idea that if the hiatus was the product of La Nina sucking the warming from the atmosphere and down into the ocean depths. (It is not controversial to state that the years 2007-13 saw lower global temperatures due to La Nina and withut these years the so-called hiatus is truly a non-event.) From this you speculate whether it was potentially the oceans warming the atmosphere 1975-98. You are not the first with such speculation. Bt if there was such a warming from the oceans, there would be evidence of it in the Ocean Heat Content data as it takes a lot of heat to both warm and keep warm the atmosphere. The level of heat required would certainly have to be evident in the OHC data. It is not evident.
- CO2 lags temperature
Tom Curtis at 09:07 AM on 18 February, 2017Adri Norse Fire @541, the graph (not map) that I showed as the third image @536 is the simple mean of:
The following data sources were used in constructing the main plot:
- (dark blue) Sediment core ODP 658, interpreted sea surface temperature, Eastern Tropical Atlantic: M. Zhao, N. A. S. Beveridge, N. J. Shackleton, M. Sarnthein, and G. Eglinton. "Molecular stratigraphy of cores off northwest Africa: Sea surface temperature history over the last 80 ka". Paleoceanography 10 (3): 661-675. doi:10.1029/94PA03354
- (blue) Vostok ice core, interpreted paleotemperature, Central Antarctica: Petit J. R., Jouzel J., Raynaud D., Barkov N. I., Barnola J. M., Basile I., Bender M., Chappellaz J., Davis J., Delaygue G., Delmotte M., Kotlyakov V. M., Legrand M., Lipenkov V., Lorius C., Pépin L., Ritz C., Saltzman E., Stievenard M.. "Climate and Atmospheric History of the Past 420,000 years from the Vostok Ice Core, Antarctica". Nature 399: 429-436. doi:10.1038/20859
- (light blue) GISP2 ice core, interpreted paleotemperature, Greenland: Alley, R. B.. Quaternary Science Reviews. doi:10.1016/S0277-3791(99)00062-1
- (green) Kilimanjaro ice core, δ18O, Eastern Central Africa: Thompson, L. G., E. Mosley-Thompson, M. E. Davis, K. A. Henderson, H. H. Brecher, V. S. Zagorodnov, T. A. Mashiotta, P.-N. Lin, V. N. Mikhalenko, D. R. Hardy, and J. Beer. "Kilimanjaro Ice Core Records: Evidence of Holocene Climate Change in Tropical Africa". Science 298 (5593): 589-593. doi:10.1126/science.1073198
- (yellow) Sediment core PL07-39PC, interpreted sea surface temperature, North Atlantic: Lea, D. W., D. K. Pak, L. C. Peterson, and K. A. Hughen (2003). "Synchroneity of tropical and high-latitude Atlantic temperatures over the last glacial termination". Science 301 (5638): 1361-1364. doi:10.1126/science.1088470
- (orange) Pollen distributions, interpreted temperature, Europe: B. A. S. Davis, S. Brewer, A. C. Stevenson, J. Guiot (2003). Quaternary Science Reviews 22: 1701-1716. doi:10.1016/S0277-3791(03)00173-2
- (red) EPICA ice core, δDeuterium, Central Antarctica: EPICA community members (2004). "Eight glacial cycles from an Antarctic ice core". Nature 429 (6992): 623-628. doi:10.1038/nature02599
- (dark red) Composite sediment cores, interpreted sea surface temperature, Western Tropical Pacific: L. D. Stott, K. G. Cannariato, R. Thunell, G. H. Haug, A. Koutavas, and S. Lund (2004). "Decline of surface temperature and salinity in the western tropical Pacific Ocean in the Holocene epoch". Nature 431: 56-59. doi:10.1038/nature02903
It shows the individual proxies in the background.
The inset shows the following temperature reconstructions over the last 2000 years:
- (orange 200-1995): P. D. Jones and M. E. Mann (2004). "Climate Over Past Millennia". Reviews of Geophysics 42. doi:10.1029/2003RG000143
- (red-orange 1500-1980): S. Huang (2004). "Merging Information from Different Resources for New Insights into Climate Change in the Past and Future". Geophys. Res Lett. 31: L13205. doi:10.1029/2004GL019781
- (red 1-1979): A. Moberg, D. M. Sonechkin, K. Holmgren, N. M. Datsenko and W. Karlén (2005). "Highly variable Northern Hemisphere temperatures reconstructed from low- and high-resolution proxy data". Nature 443: 613-617. doi:10.1038/nature03265
- (thin black line 1856-2004): Instrumental global annual data set TaveGL2v [2]: P. D. Jones and A. Moberg (2003). "Hemispheric and large-scale surface air temperature variations: An extensive revision and an update to 2001". Journal of Climate 16: 206-223.
Over the last 2000 years, the reconstructions are to be preferred, as each uses more than 8 proxies, but there is little difference between the mean of those reconstructions and the mean of the 8 proxies over that period.
Further details about the graph are here.
Almost any modern multi-proxy temperature reconstruction is preferable to taking the value of a single site, or just a few. The one exception is Loehle and McCulloch (which you use). That is because they use a heavilly biased sample of proxies but then take a simple mean of those proxies. As I explain elsewhere, this is equivalent to assuming that "...that 66.7% of the Earths Surface is in the NH extratropics, 22.2% in the tropics, and just 11.1% in the SH extratropics". Probably the best, and certainly the one using the most proxies, is that from the PAGES2000 consortium, shown here compared to four recent reconstructions (top of panel):
- Most of the last 10,000 years were warmer
Tom Curtis at 13:45 PM on 14 June, 2016I am unsure Mike Hillis what point Hillis is arguing with respect to the GISP2 d18O proxy. Is it that it represents "much of the world's climate", or that it represents Northern Hemisphere temperatures, or that it represents North Atlantic temperatures. Whichever is the case he is shown to be wrong by the ice core records. Consider for example the difference between GISP2 and Guliya (from the Tibetan plateau) as shown in this graph of various polar and tropical ice cores:

It is quite clear that if either is representative of the Northern Hemisphere, then both should be highly correlated given that both are NH ice cores. But clearly they are not. Ergo neither is reprentative of NH temperatures. Still less are either representative of "much of the world's" temperature.
By similar reasoning, neither can GISP2 be representative of North Atlantic temperatures. Here are the Holocene d18O records of six Greenland ice cores:

As all draw their precipitation from the North Atlantic, if all represented North Atlantic temperatures they would by isomorphic. Again, clearly they are not, having distinctly different holocene slopes and inflection points. In particular DYE-3 shows a warming trend through the Holocene, while Agassiz and Renland show a more rapid cooling trend. Camp Century warms until 5-6 thousand years before 2000 AD, while the other records show much earlier (although not synchronous) inflection points.
A similar point can be made from the famous Global Warming Art Graphic:

The wide divergence of shapes of the curves preclude any from being a proxy of global temperature except on the coarsest of resolutions. However, even the GISP2 (light blue), North Atlantic sediment core (specified as yellow, but which I see as a very light lime green), and European pollen data (orange) show distinctly different shapes, even though all are Northern Hemisphere records, and all are significantly influenced by North Atlantic temperatures.
Part of Mike Hillis' problem is that North Atlantic temperatures do not vary synchronously. While one part of the NA may be warming, another may be cooling As the precipitation on Greenland comes from a small part of the North Atlantic, not the whole of it; that means Greenland ice cores can only represent the temperature of the whole of the North Atlantic, but only small parts of it. In the case of GISP2 and GRIP, zone of the North Atlantic from which precipitation is drawn varies, shifting to a more southerly (and distant) location when the North Atlantic Oscillation is negative. That means the GISP2 record cannot even be of a single region within the NA (based on Hillis's suppositions), but from two different locations with distinct mean temperatures, leading to an exagerated temperature seesaw based on changes in the NAO.
Further, even close locations such as GISP2 and GRIP (just 28 kms apart) show variations in the detail of the d18O record (See figure 3 here). This may not be due to site specific factors, however. Of five ice cores from the GISP site, the cross correlations over the period 1770-1987 show a high value of 0.552 and a low value of 0.464 (Table 1 here). GISP2 shows a correlations ranging from 0.408 to 0.549 to those GRIP cores. Interestinly White et al show the highest correlation with the mean of the 6 stacks to be with the mean of the coastal temperature record, with a correlation of 0.471 (Table 2, above link). The individual isotope records have correlations ranging from 0.172 to 0.502 (mean: 0.363, data from Table 1). For comparison, there is only a 0.279 correlation to the annual NAO index. The later suggest to me that temperatures over the Greenland Ice Sheet are a more significant factor in the d18O record then are sea surface temperatures at the site of evaporation, although that is still a significant factor.
- Most of the last 10,000 years were warmer
MA Rodger at 16:53 PM on 13 June, 2016scaddenp @90,
Your assessment of δ18O data is surely indisputable.
Mike Hillis @89,
I note that unsnipped @89 you restate what I branded @70 as your proposition (E), an unsupported assertion that the climate myth addressed by the OP is no myth. That is you tell us that, apparently, once "everybody knew that most of the Holocene was warmer than today" and add (now snipped) the implication that you believe (why we know not) that they were correct in that erstwhile position. All very "grassy knoll."
On more particular matters, if I read you right, while you said previously "Easterbrook correctly uses it (ie GISP2 ice core δ18O data) as much more than a local proxy, as does Alley," what you now mean is that "Easterbrook is wrong about the GISP2" and that Alley, who doesn't actually agree with Easterbrook's use of theGISP2 ice core δ18O data after all. is also himself wrong as he is happy to see the GISP2 ice core δ18O data as “a local record“ of temperature at “one site,” an idea that you brand as being “utterly and stupidly wrong.” So you thus presently consider that they are both utterly wrong. (I'm not sure if the use of adjectives “utterly” and “stupidly” are intended to have meaning or have purely an expletive role as you are on record informing the world that “wrong and utterly wrong are the same thing.”) Whatever, both Easterbrook & Alley are now wrong but for different reasons.
Instead, we now have a replacement for your now-defunct proposition (G) which is:- (H) “One thing we do know is that NONE of the moisture that falls on Greenland comes from Greenland, so it (ie. GISP2 ice core δ18O data) is anything BUT a local proxy.” That is, you are saying the data does not provide a record of the site's temperature history. Noting the comment @90, best of luck with that.
- Most of the last 10,000 years were warmer
Mike Hillis at 23:58 PM on 12 June, 2016Easterbrook is an old man. He went to school (and taught school) when the spaghetti graphs looked like this:
https://www.ipcc.ch/ipccreports/far/wg_I/ipcc_far_wg_I_chapter_07.pdf
And everybody knew that most of the Holocene was warmer than today (back then). In those days, the temperature reconstructions (same link) showed only 0.4 C rise from the depths of the LIA to today (then). Now, due to all the GISS and NOAA data tampering, the erasure of the 1970's cooling, etc. they are saying 0.8 C or more. But 0.8 isn't enough for alarmists so they project another 2.0 or 3.0 degrees in the next 10 years and add it to the hockey stick to scare everybody, but we won't get into that. (-Snip-)
Easterbrook is wrong about the GISP2 being global, it's NH, as there is very little circulation between the two hemispheres. Werner et al 2001 shows that 96% of the snow that falls on Greenland comes from the NH and only 4% from the SH. Link here: http://epic.awi.de/18985/1/Wer2001b.pdf with similar percentages for Vostok in reverse.
Easterbrook says global, Alley says north Atlantic, Werner says NH. One thing we do know is that NONE of the moisture that falls on Greenland comes from Greenland, so it is anything BUT a local proxy. If you think Greenland ice cores only tell the temperatures of Greenland, you are quite mistaken.
Still digesting my comment about deposition vs condensation? All these scientists are treating snowfall in Greenland as if it results from condensation. Am I the only one smart enough to see why this is utterly and stupidly wrong? No, meteorologists all know it, and work with this daily (in the winter).
- Most of the last 10,000 years were warmer
KR at 23:15 PM on 10 June, 2016Mike Hillis - I've looked over this thread a couple of times, and I one major question for you:
What is your point?
The archived and published temperature data for Alley 2000, using "...ice-isotopic ratios, borehole temperatures, and gas-isotopic ratios" (emphasis added), indeed starts at 1855 and goes back, entirely appropriate for examining the Younger Dryas cold period - the entire point of the Alley 2000 paper.
Gas-isotopic ratios aren't usable until the firn packs, borehole temps near the surface become increasingly noisy due to local weather, and most of all, Alley wasn't using paleo data for the last few hundred years of temperatures. Whether or not it's possible to extract paleotemperatures from the top few meters of recent snow is simply immaterial - you don't need paleotemperatures when there's an existing instrumental record, and Tom Curtis and others have correctly pointed out that recent years aren't in the published data from that ice core. Easterbrook, Monckton, and others (mis)using the Alley 2000 and GISP2 data made fundamental dating errors in their arguments, local temps aren't global temps, and so the myth discussed in the OP is, indeed, busted.
IMO you made some extremely strong and unsupported claims against the OP in your first post ("this fabrication"), and have since been dancing around the corrections provided to you; trying to retain some kind of issue to be "shocked" about. As far as I can see there is no issue with the OP, and you are now arguing about (possible) data of no interest to Alley 2000, data that wasn't collected or published, data irrelevant to either the paper or to the dating errors made by (among others) Easterbrook and Monckton.
Arguing about the number of angels that could dance on the head of a pin would be just as relevant to the opening post. If you have an actual issue with the OP, please state it - otherwise, you're just making noise.
- Most of the last 10,000 years were warmer
Tom Curtis at 08:50 AM on 10 June, 2016MA Rodger @78, I have done some further investigation and found out that Mike Hillis is correct on one key point. Specifically, when comparing the Alley (2004) data to the Washington University measured samples data, it becomes evident that the first few samples in the Alley data are at approximately:
- 51.39 meters
- 55 meters
- 57 meters
- 58 meters
- 58 meters
- 61 meters
- 62 meters
- 64 meters
- 66 meters
- 68 meters
- 68 meters
- 70 meters
- 72 meters
- 74 meters
(All values other than the first rounded to the nearest meter.)
The issue here is that while all values are well inside the diffusion zone (below the first 20 meters of firn) where diffusive and gravitational diffraction of isotopes occurs, it is not until the 14th (or possibly 13th) value that we find a value below the close off depth at which the firn closes to form bubbles in the ice (specified as 72 meters fo GISP 2 in table 1 of Schwander et al (1997)). Arguable the 8th through 13th values come from the non-diffusive zone of the firn, where "air is not able to equilibriate with the overlying diffusive zone because of the tortuous nature of the firn" (Schander et al 1997), and hence where included air is effectively sealed from the atmosphere even thought not yet enclosed in ice bubbles. It remains that the first seven values are from the diffusive zone where air content is essentially modern, though with some diffraction of heavier isotopes. Ergo it is not possible that the explanation given in the OP (and by myself @ 53) for the 1855 terminal data of the Alley (2004) record as related to the closure of the firn is correct, even in principle.
Of even greater concern is that the Alley values do not allign precisely with the "measured values". Given that Alley (2000a) and (2000b) (of which Alley (2004) is the data record) are derived from Cuffey and Clow (1997), who derive their oxygen isotope data from Grootes et al (1993) of which the "measured values" are the record. It may be that this is because the measured data has been updated for some of the later studies of which it represents the cached data. However, annually resolved oxygen isotope data were available as early as 1995 (indeed, earlier given time from submission to publication), so that is unlikely to be the reason.
The discrepancy is more likely to be due to the fact that in Alley (2004) "Data are smoothed from original measurements published by Cuffey and Clow (1997)" (my emphasis). That being the case, the 1855 terminal data point may include data from later than 1855, as well as earlier. I say "may" because at that point at that time in the "measured values" there are several values per annum so that the smoothed values may come from entirely within 1855, and are unlikely to include values earlier than 1861 (based on the interval to the next value). Regardless, I think the nature of the smooth, and if possible the original data values need to be clarrified with Richard Alley, and the OP corrected to account for that information. This is even more necessary than the need to delete the straight forwardly erronious claim that "The reason is straightforward enough — it takes decades for snow to consolidate into ice".
While I don't mind admitting errors, I must admit some chagrin to discover that Mike Hillis has made true claim based on invalid reasoning (ie, the assumption that only oxygen isotope data goes into the temperature determination). In particular, air pressure in enclosed ice was used to confirm the altitude correction in Cuffey and Clow (1997), for which the relevant data clearly does not come up to the present (see Raynaud et al (1997) figure 1). Evidently no such correction can have been made for the most recent data in the record, but Mike Hillis certainly did not know that.
In passing, my discussion above presents evidence that shows a couple of his more recent claims to be false. His claim @75 that "the core study at the University of Washington was started around 1997" is shown to be egregiously in error, given that the first published paper from that core study was in 1993. His explanation that "Alley stopped his temperature data at 1855 in his paper on the Younger Dryas, not because that's the latest data he had, but more likely because he was writing about an event at the beginning of the Holocene and anything after 1855 was not relevant to the Younger Dryas" is also shown to be false. Alley (2004) does not represent just the data for Alley (2000b), which discusses the younger Dryas, but also Alley (2000a), and more importantly Cuffey and Clow (1997) which discusses the temperature record from the GISP 2 ice core, and which therefore had every reason to be brought as close to the present as possible.
- Most of the last 10,000 years were warmer
Tom Curtis at 11:52 AM on 8 June, 2016MA Rodger @72, I am guessing Alley and Koci (1990) is also not what you are after, as it reconstructs GISP 2 temperatures from measured temperatures in the bore hole. It is still informative:

I have added a line indicating 1855 for easy comparison, and it can be seen that 1855 is about 1.5 C cooler than modern temperatures. As Alley and Koci (1990) was referenced in Alley (2000b), it is further reason as to why Easterbrook should not have made his "mistake".
I have not been able to find dO18 based temperature reconstruction brought up to the late 20th century, but the dO18 values to 1987 are available online. I have used the temperature relationship specified in the University of Washington's annual dataset, along with the temperature relationship specified in Cuffey and Clow (1997), specifically T=(2.15 x dO18) + 43.4. I have compared the running decadal mean to that for the BEST Greenland data:
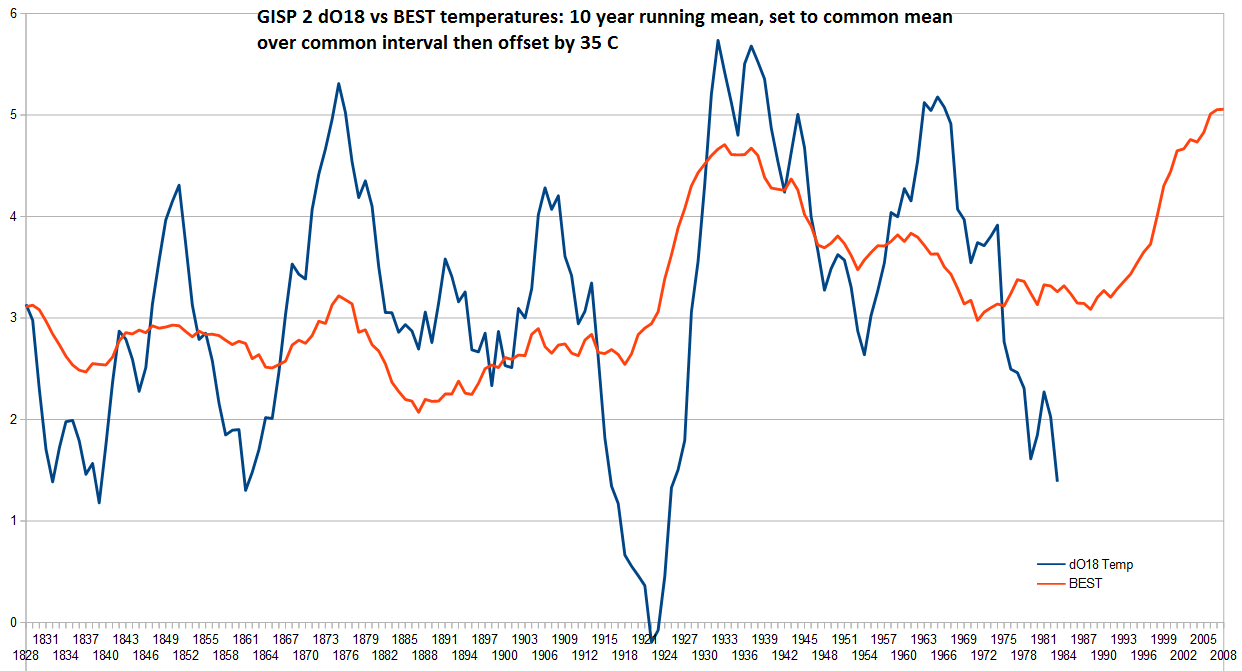
Just to be clear, the initial decade is 1823-1832. The final decade is 1978-1987 for the dO18 and 2003-2012 for BEST. The greater variability of the dO18 record is probably due to a combination of altitude changes, changes in the source moisture for preciptation, along with the fact that the record is from a single site. The temperature difference between 1850-1859 and 2003-2012 is 1.41 C on the BEST record, and is likely to have been similar in the dO18 record, had it been continued to the present. In any event, regardless of the method used (graviational defraction, borehole temperaures, dO18, or regional thermometers) the 1855 temperature is well below modern values.
- Most of the last 10,000 years were warmer
Tom Curtis at 09:02 AM on 1 June, 2016To recap:
Mike Hillis @51:
"I read this thread and am shocked by what I'm reading. The data that Richard Alley uses does not end in 1855, nor does it use 1855 as any sort of "present". Nor does the snow have to be compacted into firn and then the firn into ice, in order to date the annual layers, or for these layers to be usable in isotope measurements. ... I can see where Tom Curtis claimed to have emailed Alley and asked him, and got a reply from Dr. Alley, but also find this to be a copy and paste from another person who emailed Alley, which means Mr. Curtis probably never actually emailed Dr. Alley at all. It's astonishing that nobody has corrected this fabrication so far."
(My emphasis.)
Mike Hillis @57:
"I see where the 1855 comes from now. Somebody, I suppose Easterbrook, is using a data set from a 2004 Alley paper about the Younger Dryas, in which he only uses enough data to clarify that event, starting from 95 years BP and going backwards."
So we are quite clear, Alley (2000) in fact used data only extending to 1855. Easterbrook has continuously misrepresented that data by first purporting it continued through to 2000, and then (when the date of the most recent sample was pointed out), purporting that it continued through to 1905, despite the well known geological convention (and the confirmation by Richard Alley) that "Before Present" refers to years before 1950. In other words, the original article by Gareth, and discussion by me in various comments above have been accurate, and are now acknowledged by Mike Hillis as being accurate.
He has as yet provided no apology for his being "shocked" by the purported misrepresentation of these facts, which he now acknowledges to have been accurately stated. Even worse, he has made no apology for calling either the accurate statement of these facts (or possibly his invention that I claimed to have emailed Alley) a "fabrication".
I guess we can be at least grateful that he now understands the essential point of the article.
He still insists (correctly) that ΔO18 measurements for GISP 2 can be obtained till as recently as 1987 (ie, -37 BP). The data site he uses to prove that, however, states that "Between 1989 and 1993, the Greenland Ice Sheet Project 2 (GISP2) collected several ice cores from near the summit of the Greenland Ice Sheet"; and that "Above 180m depth the measured samples are from the 1989 B core; below 180m the 1990-1993 D core was used". From this we learn that there are at least two other cores from GISP 2 whose data is not listed at that site. Further, he only has evidence for one of those cores (the 1989 Core B) that it continues with data, effectively to the surface. (It excludes the last two year prior to collection, presumably because of the risk of contamination from setting up the site, or because the snow was insufficiently packed to be preserved in the core.) From these facts he cannot determine which core was used by Alley (2000), and nor can he determine that that core had data prior to 1855.
However, regardless of that, there is a reason why the temperature data from Alley (2000) should not include data to the surface, and indeed, not include any data prior to the closure of the firn. Alley (2000) in fact used the temperature data from Cuffey and Clow (1997). Cuffey and Clow did not just use ΔO18 measurements to determine temperature, but the estimated elevation changes as well:
"We can use the elevation histories to infer a history of temperature at constant elevation (the true climatic change), by assuming a constant lapse rate of 6 øC km-1• [Putnins, 1970]. The resulting correction to temperature of the last glacial maximum is small compared to the aleglacial temperature change; the temperature range is about 1.5 øC for 50 km ≥ AL ≤ 200 km. More interesting is the correction to the early Holocene temperature record. Here the correction shows a more pronounced early Holocene temperature maximum with a net cooling through the Holocene of 2.5 ø to 3 øC, if the large marginal retreat history is applicable (Figure 3). The net cooling through the Holocene is 2 øC for AL = 50 km, and in this case the early Holocene is about as warm as the late-mid Holocene."
Cuffey and Clow use a model based on snow accumulation and estimated margin retreat to determine elevation, but note that total gas barometry of the gas included in the ice provides a potential independent check of the elevation history (which they then discuss). This use of included gas as an independent check on elevation history provides a sufficient reason to only use data from when the firn had closed.
Please note that I am not saying that it is the reason. The Cuffey and Clow data may have terminated in 1855 simply because of the actual ice core they used, or for some other stated reason. However, because of the role of estimates in elevation in determining the temperature history, it cannot be assumed that ice from before the closure of the firn was equally suitable for determining the temperature history.
- Most of the last 10,000 years were warmer
Tom Curtis at 14:58 PM on 31 May, 2016Mike Hillis @52, perhaps you would be less shocked if you actually read for comprehension.
Firstly, I have never claimed (nor ever have) emailed Richard Alley. The person claiming to have emailed Richard Alley is the author of the OP, ie, Gareth.
Secondly, neither the article, nor any comment by me, claims that Alley used 1855 as the present. Rather, we have claimed that the fist datum point in the Alley data is at -95 (specifically 0.0951409 thousand years before present), and that the standard age of "the present" in geology used for dating Before Present is 1950. Combining these two facts, we determine by arithmetic that the first datum in the Alley data is at 1855. You may have difficulty reading, and be shocked by, arithmatic - but that is your problem, not mine.
Thirdly, what has been confirmed by Richard Alley in the email to Gareth that when he referred to "years before present" in the data and article with out explicitly stating he was not following the standard custom, he was in fact following the standard custom. Given that it would have constituted an error in the document to do otherwise, that comes as no surprise.
Finally, snow pack exist up to the present and shows annual layers as you note. However, the holes within the snowpack containing the gas do not become air tight and hence preserve a record of prior atmospheric concentrations until decades after the fall of the snowpack. Indeed, not until they have been sealed by compression of overlying the overlying snowpack. How long it takes for that to happen depends on the rate of precipitation, which is slow at the GISP 2 sight at the top of the Ice Sheet.
- Climate's changed before
NN1953VAN-CA at 18:16 PM on 14 November, 2015Response to moderator
Reference are Ice core tables:
Vostok
Greenland
Historical Isotopic Temperature Record from the Vostok Ice Core
Deuterium
Age of content Temperature
Depth the ice of the ice Variation
(m) (yr BP) (delta D) (deg C)
0 0 -438.0 0.00
1 17 -438.0 0.00
2 35 -438.0 0.00
3 53 -438.0 0.00
4 72 -438.0 0.00
5 91 -438.0 0.00
6 110 -438.0 0.00
7 129 -438.0 0.00
8 149 -442.9 -0.81
9 170 -437.9 0.02
10 190 -435.8 0.36
11 211 -443.7 -0.95
12 234 -449.1 -1.84
13 258 -444.6 -1.09
14 281 -442.5 -0.75
15 304 -439.3 -0.22
16 327 -440.9 -0.48
17 351 -442.5 -0.75
18 375 -436.6 0.23
19 397 -430.0 1.33
temperature variation from -1.84 at year 234 BP
to 1.33 at year 397 BP
temperature variation 3.17 time 163 years
for Grenland ice core measurements temperature/ time variation takes longer, it is some 2K years for 3 degrees in temperature difference.
The only reason I reference those two is that there temperature difference is the smallest at those points. Global temperature was different but variation may have been close to those changes.
Sorry if my sentence:
'I do understand nature around me' sounded dismissive as to reply to your statement:
'Just because you don’t understand something doesn’t mean that science doesn’t either.'
your opinion on my understanding.
I was not intended to be dismissive, just stating that I do look around and look for reasons beyond.
Why I mentioned C02 content as stable, for long period of time is to question statements that with present C02 content, GT is expected to be higher, and it is not.
There are other factors as Milankovitch’s cycles, dust in the atmosphere as of volcanic activity or due to meteor hitting the earth, proportion variation in sea/land as at ice age or warm periods. etc
I was not dismissing all other factors which are affecting GT change.Present C02 concentration in the atmosphere is not reflecting GHG theory and that is what I was trying to express.
- Climate's changed before
NN1953VAN-CA at 09:22 AM on 9 November, 2015DSL,
Thank you for direction where to get more information on CO2 lag.
If we accept scientific measurements of samples done by reputable institutions and their findings for the last 5000 years, CO2 level in the atmosphere was between 250 – 280 ppm, except in last 50 years, when it raised to recent level. With CO2 stable as measured, for the past 5000 years it would be reasonable to have stable temperatures for the same period if CO2 was key factor. Measured temperature varied in last 5000 years much more with stable CO2 level, than it changed recently with CO2 gone considerably higher. There are Greenland Ice core findings and Vostok Ice core findings proving much more dynamic changes in temperature than change in CO2 in atmosphere.
Look through tables:
Historical Isotopic Temperature Record from the Vostok Ice Core
http://cdiac.esd.ornl.gov/trends/temp/vostok/jouz_tem.htm
temperature varied from 1.97 below mean and 1.33 above mean. More than 3 degrees for CO2 variation of roughly 30 ppm.
Temperature in central Greenland
LINK
Temperature varies from -32.18 to -28.75 – about the same as for Vostok, more than 3 degrees for the same change in CO2 content. (30 ppm)
CO2 content of almost 400 ppm should cause considerable temperature change if it is major factor, measured temperature increase does not reflect that. - Climate's changed before
Tom Curtis at 08:04 AM on 11 May, 2015skeptic123 @428, last and most offensive first! The GISP2 ice core data represents a regional record only, not a global record. Are you seriously trying to suggest that global temperatures vary as rapidly as do regional temperatures (and regional temperatures with one of the most rapid rates of change of temperature found on the planet)? Further, are you seriously trying to suggest that the magnitude of temperature change from a regional record is also to be found in the global record? If so, you have largely disqualified yourself from the conversation on the basis of complete ignorance of basic relevant facts. If not, you have certainly disqualified yourself from the conversation on the basis of deliberately presenting evidence in a form you know to be misleading.
Taking the former, more generous interpretation, consider this graph of eight full holocene regional temperature proxies:

Individual proxies show rapid variation in temperature of considerable amplitude. Of those, GISP2 (light blue) shows the greatest variation, having the highest peak holocene temperature anomaly, and the lowest most recent temperature anomaly. Because peaks in various records rarely coincide, and some records are always out of phase with others (ie, have troughs where the others have peaks), the arithmetic mean of all 8 proxies shows both much less absolute temperature variation, and much lower rates of temperature change than do individual proxies. Consequently, presenting a single proxy (let alone the most variable proxy) as representative of either absolute magnitude of global temperature change or of rates of temperature change over the holocene is fundamentally misleading (whether from ignorance of the effects of regression to the mean, or intent to decieve).
(As an aside, the overall decrease in the mean temperature over the holocene is largely an artifact of a NH bias in the individual proxies (ie, there are more NH than SH proxies presented), a problem also with Marcott et al. An unbiased sample is likely to show much less, or possibly no decline over that period.)
The same basic problems afflict the Vostock proxy record (blue in the above graph). The absolute temperature magnitude shown in the Vostock record is approximately twice the absolute variation in the global record. Further, periods of rapid decline rarely coincide with other regional proxies so that periods of rapid decline in the Vostock record will coincide with much slower decline (or sometimes even increases) in a global record. Further, your quote from the caption of the Vostock graph that you show is misleading out of context, and not supported by the evidence in any event.
In particular, while rapid temperature changes can occur over only a few decades, the trend over successive decades will often greatly slow or reverse direction. The consequence is that multi-century temperaturetrends are typically very slow. This can be seen in a scatter plot of time intervals vs temperature change in the Vostock record:

While there are some very rapid short duration changes, they are seen to quickly reverse themselves. The result is that changes over a century or more are at rates of -1C per century or less. Typically much less. As the transition from inter-glacial to glacial in the Vostock record requires a temperature change of approximately -6C, that means transitions from interglacial to glacial cannot occure in less than 500 years or more. Indeed, based on a pixel count of the graph of the vostock record, the most rapid interglacial to glacial transition (taken as the interval between 0C and the bottom of the first trough below -4C, or to -6 C, which ever is shorter) takes 6250 years (approx 240 thousand years ago). The next most rapid, and most recent took thirteen thousand years.
Finally, the TAR quote references Alley 93, which analysed early icecore data from Greenland. The rapid transition it found was the Younger Dryas, which was primarilly a North Atlantic phenomenon, and which involved much slower transitions in temperature when averaged across a number of diverse locations. (In 1993, only Greenland proxies were available back so far in time.) It is, therefore, obsolete, having been disproved by more recent data.
(I've run out of time, and will return to the CO2 issue later.)
- The 97% v the 3% – just how much global warming are humans causing?
jwalsh at 14:48 PM on 23 September, 2014Tom Curtis @99
1) I criticized you for using a regional proxy (GISP2) as though it were a global proxy. You implied your use was justified on the basis that tropical ice cores did not exist "they don't last so long". You now claim that you knew about them all along, which makes your original use of GISP2 simply dishonest.
The ice at closer to the equators is much, much rarer, and incidentally only exists at extreme altitudes. Similar criticisms to regional differences apply really. However, in signal quality the arctic and antarctic cores provide much less noisy data. I honestly can't look at your 6-core data and say there was, or was not a Minoan, Roman, or MWP. It just is simply too noisy. Anyone making that claim (and the authors did not) would find it difficult to defend. Not believing in the above periods of warmth is certainly an opinion. I don't share it, and I am hardly alone. Maybe there wasn't. So the reason for the clear Greenland curves is?
We could discuss the Marcott paper all day long. But the simple fact is, it is based on very low resolution data. It is going to be significantly "smoother" by method. Useful to discuss on a centennial scale, maybe, but not decadal. Whereas ALL of the GISP2 data is high resolution. And Greenland temperatures correlate well enough today to global. To endorse the Marcott paper as telling us useful information on the LIA and MWP is not something I, and G. Schmidt it would seem, would do, for those reasons. And how is Gavin Schmidt's thoughts on using the Marcott paper for that reason "out of context"? I can't think of a way for it to be more in context.
I criticized you for (in effect) taking the average of just one proxy as an indicator of changes in global mean surface temperature. You now respond by arguing that taking the average of eight such proxies is of dubious "scientific utility" and that it is a premise that is itself " itself is too absurd to bother" checking the maths.
Taking an average as was done is of limited scientific utility. The criticism of picking one proxy over another is a valid one. I mentioned that as an issue straight away. Here's why it isn't that useful. They vary too much to do that. Say I give two people a tape measure to go measure an object, and one comes back and says it's 2.25 metres, and the second says 4.60 metres. If I actually need to know, would I take the average and proceed? No. I would know that one, or both measurements is flat-out wrong. The same is the case with data like the multi-proxies. You know one or more "must" be wrong. So you dig in a little bit to try and figure out which. Or you throw the whole mess out and start over. The use of proxies like tree-rings and such and whether they are truly accurate enough is a point of contention. There is also the issue that they yield lower resolution data.
- The 97% v the 3% – just how much global warming are humans causing?
jwalsh at 08:00 AM on 23 September, 2014KR @89
1950-1960 is not when anthropogenic contributions become detectable in the climate record, but rather when they become dominant over natural forcings.
This would be a distinction without a difference for the purposes.
GISP2 is a local record, not a global one, recording temps at a single point on the Greenland ice cap. There is no evidence that I am aware of for 1200 year cycles, incidentally - that claim of yours appears to have materialized out of left field.
That the climate has varied wildly in the past is not "out of left field". It is considered to be more established scientific fact than most IPCC statements. The Minoan, Roman, and Medieval warm periods occurred at roughly 1200 year intervals. I acknowledge that the GISP2 is a local record. It is not, however, the only record. And a person would need to describe some proposed mechanism of extreme arctic warming and cooling cycles independent of the rest of planet earth to speculate that it was local. Could there be such a thing? I am not sure. I would be curious to hear one.
Negative anthropogenic forcings have a fairly high uncertainty - but the best estimate is for a climate sensitivity around 3C/doubling of CO2. Claiming that they are small and that correspondingly ECS is low (as you appear to) is a cherry-pick of but one low-likelyhood end of the PDF, and that isn't justified by anything other than wishful thinking.
Considering that there is strong observational evidence to support an ECS estimate of below 3, I am not alone. In fact, I suspect that a FAR greater percentage than 3% of the IPCC themselves would agree there. One need only pick through the IPCC expert reviewer comments to easily demonstrate a lack of clear agreement. I think that the PDF cobbled together from the 10.5 figure is getting an inordinate amount of attention. It would be similar to deciding that any particular PDF for climate sensitivity itself was the "correct" one. As observed my many, AR5 seemed to weight model methods of determination of ECS over observational ones with little justification. This would be, incidentally, in contrast to AR4 with no well-documented reasoning.
Temps have been running below (averaged) model projections for ~15 years - a statistically insignificant time period, while remaining in the 2-sigma model range. That means there has been no invalidation of the models to date.
If you'd like to discuss what is a statistically valid time period, that would be an interesting discussion. Certainly a great deal of ink has been made over the statistically much more "valid" 18 year period of 1980-1998. Do we really need to wait just a few years to consider an 18, 20, or 25 year trend? The IPCC thinks not. How many people have drawn trend lines over CRUT4 data or UAH satellite data? However, if 15 years is too short of a time period to consider making model adjustments, those actually doing so, such as those running them, are being hasty. And the IPCC themselves would be being "hasty" in using short term temperature data to alter their own 20-year temperature projections well below that of the model outputs. And they did exactly that in AR5.
It's worth noting here, that I don't think the IPCC attribution is "way off". Just minorly so. And for the record, I don't rule out climate sensitivity of "4" either, or indeed attribution of AGW of 120%. How would I know? As I said, greater effort would probably spent worrying about convincing the much smaller fraction of scientists who put it well below 50%.
- The 97% v the 3% – just how much global warming are humans causing?
Tom Curtis at 07:38 AM on 23 September, 2014jwalsh @86:
"Yes, there's a tricky limitation with ice cores. The ones at the equator don't last nearly as long. I didn't say they were a perfect match to NH temps (or global). Evidence that the Greenland temperature swings were localized for some reason? None provided. Evidence of the Minoan, Roman, and Medieval warm periods from either historical records and other proxies? Hell yes. But sure, might not be as extreme in swing. Do you have a good explanation for the approximately 1200 year cycles?"
It goes tiresome correcting the errors, lack of evidence and outright falsehoods on which you base your "expert opinion". Never-the-less, here are the results of six near equatorial ice cores from high altitudes:

Here are three of the tropical or subtropical icecores along with three polar icecores:
And here the equivalent ice core (in blue, dO18) from Mount Kilimanjaro, which at 3 degrees, 3.5 minutes south, I think counts as being "at the equator":

You will notice that only Sajama has, what might be considered to be, your 1,200 year cycles. You will further notice the distinct hockey stick in the 6 ice core composite.
Further, I refer you again to the Marcott et al (2013) reconstruction of holocene temperatures, as displayed above along with eight temperature proxies and their arithmetic mean as constructed by Robert Rohde for wikipedia:
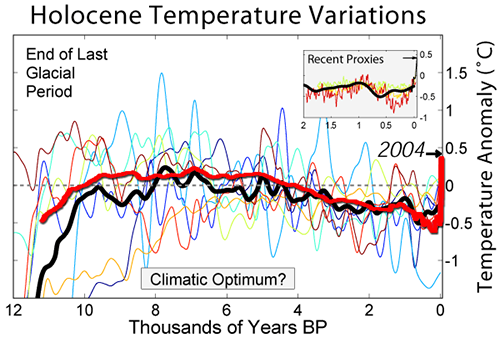
Again, the Roman Warm Period and the Minoan Warm Period, not to mention the 1,200 year cycles are only present in GISP2, and is distinctly not present in the global reconstructions.
The RWP and MWP are distinctly North Atlantic phenomenon, and have significant impact over European temperatures. That they do not have any discernible impact on global temperatures is a spear in the side of any theory that modulation of North Atlantic Temperatures is a significant, let alone a major cause of variance in global temperatures.
So:
"Evidence that the Greenland temperature swings were localized for some reason? None provided."
Evidence the sky is blue? None provided either, and none needed because it is assumed to be well known by anyone well informed on the topic as you claim to be.
"Evidence of the Minoan, Roman, and Medieval warm periods from either historical records and other proxies? Hell yes."
But exclusively restricted to NA (and immediately neigbouring land) proxies showing beyond doubt that they are regional, not global variations in temperature. As we are discussing impacts on global temperatures, your introduction of a known regional temperature proxy with poor correlation with other regional temperature proxies counts as a red herring at best - and is either proof that you are not well informed on the topic, or that you are intent on deception (if you are indeed well informed).
- The 97% v the 3% – just how much global warming are humans causing?
KR at 00:43 AM on 23 September, 2014jwalsh - Several comments here:
1950-1960 is not when anthropogenic contributions become detectable in the climate record, but rather when they become dominant over natural forcings.
GISP2 is a local record, not a global one, recording temps at a single point on the Greenland ice cap. There is no evidence that I am aware of for 1200 year cycles, incidentally - that claim of yours appears to have materialized out of left field.
Negative anthropogenic forcings have a fairly high uncertainty - but the best estimate is for a climate sensitivity around 3C/doubling of CO2. Claiming that they are small and that correspondingly ECS is low (as you appear to) is a cherry-pick of but one low-likelyhood end of the PDF, and that isn't justified by anything other than wishful thinking.
Temps have been running below (averaged) model projections for ~15 years - a statistically insignificant time period, while remaining in the 2-sigma model range. That means there has been no invalidation of the models to date. Add in more accurate forcings (better than the ones used for CMIP5) such as discussed by Schmidt et al 2014, which clarify that short term internal variation is indeed negative right now, and there is every indication that the models are right on track.
---
The gist of your various Gish Gallops here seems to be that you disagree with the IPCC estimates of natural forcings, of indirect aerosols, of internal climate variability, and that you don't like the climate models. All because you "think the IPCC got that wrong". IMO your gut feeling simply doesn't measure up to the evidence.
- 97 hours of consensus: caricatures and quotes from 97 scientists
Rob Honeycutt at 02:02 AM on 9 September, 2014Donny... You have to bear in mind that that graph represents only one small part of the globe. It is a regional record of temperature at the Greenland summit. Also bear in mind where the Greenland summit is. It's well above the arctic circle and thus it's where we expect to see much more rapid swings in temperature.
I'm really amazed that Watts has posted that version of the GISP2 data. He totally knows that the it's wrong where it states that the year 2000 = "present." That should give you a sense of how much Watts cares about accuracy and truth. In fact, of all the versions of the GISP2 data floating around the denialsphere, that one is probably the most misleading of all.
- 97 hours of consensus: caricatures and quotes from 97 scientists
KR at 01:20 AM on 9 September, 2014Donny - That's one of the most misrepresented data sets on the climate blogosphere. See the Crux of a Core series here on SkS.
Long story short: it's a local record of a particular location in Greenland, not a global proxy, often mis-graphed with incorrect proxy endpoints, and shown with a noteworthy lack of the most recent temperatures:

Good data, deceptive presentations, ridiculous interpretations.
- Brandis confuses right to be heard with right to be taken seriously
Glenn Tamblyn at 16:53 PM on 7 May, 2014Warren
Regarding your links - all generated by CO2Science or JoNoova by the way, not links to the actual data sources or papers - you might find these things interesting
Your first link is for ice core data from Greenland. Not the globe. We can't assess the globe from data from just one location.
Here is your image, taken from JoNova. Here is the paper by Richard Alley that the graph is based on. Firstly this graph does not appear in Alley's paper. You can get the actual data here. Notably the data ends in 1905. So most of the warming we are disscussing here isn't included on the graph. And this is Greenland so we can't just add what the global temperature change has been since warming is greater in the Arctic. Here is the record for one station in Greenland that is continuous since the start of the 20th century. Around 2.5 Deg C of warming. So that would possibly put temperatures at Greenland today back to the levels labelled Minoan Warming
\Next look at this graph - I even obtained it from a skeptic website. Vostoc Ice Core data from Antarctica for a similar period. And there are spikes labelled with the same 'warm period' names.
N
Notice the difference between the two graphs. Your graph shows Medieval Warming as a spike around 1050 while the Antarctic data shows a narrow spike around 1550. 1050 was actually quite cool in the Antarctic. The Roman warming was a narrow spike around 100 BC in Greenland but a narrow spike around 350 BC in Antarctica. The Minoan period was around 1300 C in Greenland but around 1700 BC in Antarctica. Is there seems to be a bit of a problem with dates here Warren? No, just with the assumption that we can use one location to tell us what was happening over the entire planet.
- Most of the last 10,000 years were warmer
peter at 10:03 AM on 7 May, 2014the last 10,000 years of GISP2 data
If you have done any form of stock chart or commodity chart analysis you will se that the past 10,000 years shows no up or down trend in global temperatures.(or temperatures of the Greenland Ice Core)
What it does show is Temperature Range of approx 5 degrees - or a sideways trend. That is the Long Term Trend.
Its completely irrelvant as to whether or not Eastwards "present" is 1855.
Focusing on short term trends are extemly misleading and in the case of stocks or commodities can be very expensive.
- We're coming out of the Little Ice Age
Tom Curtis at 07:25 AM on 7 February, 2014TD47 @63, the poster uses just three temperature poxies for the holocene. Two (Agassiz/Renland and GISP2, ie, Alley et al, 2000) are from the north Atlantic region. The former is a composite of four ice cores from the Agassize Ice Cap on Ellesmere Island (just west of the northern end of Greenland) and one ice core from Renland (on the south east coast of Greenland, more or less north of Iceland). They represent the regional signal, therefore, of just one region on Earth, and one of the most variable temperature wise. The author mis-cites the source of the Agassiz/Renland data as Vinther et al (2009), whereas it is in fact Vinther et al (2008).
The third core is the Vostock core from Petit et al (2001). That means all three cores are from polar regions, and exhibit polar amplification. They are therefore not representative of global temperatures. In addition, they represent just two regions, and consequently show the typically large regional fluctuations in temperature which cancel out when averaged across the globe. As a result, they significantly overstate temperature change when compared to global figures.
To compound this problem, there are two errors in the presentation of the proxies. First (unsurprisingly), the GISP2 data is plotted to end in 1905 (determined by pixel count). In fact it terminated in 1855, as discussed here. You should note that Richard Alley has confirmed that the that 1855 is the correct termination of the data. More troubling is the extended, uniform plateau at the end of the Vostok period. Checking the data, I find the last data point is for a gas age of 724 BP (=774 B2K), or 1226 AD. The extended plateau at the end of the data shown in the poster must be samples taken from the firn, ie, the upper region of the ice core where pressure has not yet sealed air gaps, allowing free exhange with the atmosphere. The consequence is that it represents an average temperature over the last few centuries rather than modern temperatures, and completely conceals all variation over that period. Coupling these facts with the fact that the final data point for the Agassiz/Renland composite core is 1960, and there are no proxy data points that actually show recent temperatures.
These flaws (regional, polar amplified proxies PLUS incorrect terminations of ice cores with no modern, regional comparisons) tend to reinforce Andy May's false claim that "...we have not seen unusual warming in the present warm period, relative to other warming events in the last 18,000 years...". In fact recent warming is unusual relative to the past 18,000 years, as is shown by Marcott et al (see second link by the moderator); and may be unprecedented in that period.
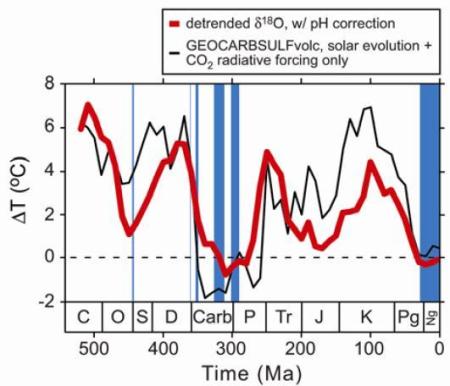
I also note that May has relied on the very obsolete, and obvsiously schematic temperature reconstruction by Scotese rather than an actual, modern reconstruction of temperatures over the Phanerozoic, such as this one by Dana Royer:
The preference May shows for obsolete data, inaccurately presented suggests the poster is of dubious value as an information source.
- Most of the last 10,000 years were warmer
scaddenp at 06:56 AM on 25 November, 2013This has come up before but I cant find it. There is a paper demonstrating that it is regional. Fractionation during precipitation is reason. Anti-phased cooling periods between Antarctica and Greenland would also not be observed in ice core if the proxy was global (and would be challenging comparing GISP2 to tropical glacier icecore and insisting that they represented a single global proxy!).
- Most of the last 10,000 years were warmer
steven foster at 10:07 AM on 24 November, 2013Thank you. I'm going to use the NOAA GISP2 data which has a resolution of 40 data points for every 1000 years for the whole Holocene. It looks like (so far) that the GRIP data has a lower resolution. I will look into the Kobashi suggestion. I did a quick low resolution thumbnail of what it will look like:
https://imageshack.com/i/5bv42dj
I differ with you about Greenand ice core data being a local proxy only. The H and O isotopes in the water represent temperatures of the water from around the world that winds up in Greenland, and don't represent the temperatures on Greenland itself. Water in the oceans has H and O isotopes of a known concentration. But the boiling point of heavy water, as well as heavy oxygen water (H2O^18 rather than H2O^16) are higher than that of normal water, and are found in water vapor in the atmosphere at lower concentrations when the global temperature is low. When the global temperature is high, more heavy water evaporates around the world than when it's cold. But when the water vapor travels to Greenland, it is assumed that it all freezes, regardless of the temperature in Greenland. So the higher the temperatures around the world, the more O^18 and H^2 we find in the ice. So, it's a global proxy, more suggestive of northern hemisphere temperatures, of course, but water vapor doesn't always commit to one hemisphere. The other argument might be that the FREEZING point of heavy water is also higher than regular water, so more of it would snow out of the air before it gets to Greenland, so the temperature of Greenland matters. But snow crystals don't care what isotope of water....actually I need to think about this. Ok I thought about it. None of the water freezes in Greenland. It all freezes long before it gets there, probably as cirrus clouds in the stratosphere, which are already frozen long before. I don't know.
- Most of the last 10,000 years were warmer
Tom Curtis at 12:07 PM on 22 November, 2013steven foster @27 & 28:
1) The chart in my post @ 15 does in fact place the end of the GISP2 data in 1874 (based on pixel count), or five pixels prior to 2010. Placing it six pixels prior to 2010 would have placed it in 1847, a little more accurate but hardly consequential. I doubt it makes any visual difference.
2) I am not sure why you are making this point on the original Alley et al (2000) data when we have the Kobashi et al (2011) data from the same ice core that is:
- Carried through to a more recent date;
- At a higher resolution;
- Includes reconstructed site temperatures from nearby instrumental readings back to 1840
- Includes on site instrumental readings back to 1985
- Is correctly alligned.
Using the Kobashi data we see the warming at the GISP2 site started circa 1750, and was quite slow till the early twentieth century. It then shows a rapid increase, and decline, followed by another rapid increase of equal size.
3) All of this is largely irrelevant because local proxies are not global proxies. Anybody using the denier talking point you mention must be ignoring that basic fact. What the Kobashi reconstruction shows us are the temperatures at one site in Greenland. The do not show us Arctic temperatures in general, and certainly not NH or global temperatures in general. In fact, we do in fact have NH and global temperature reconstructions over that period, which show the twentieth century warming to be much faster than the prior warming as the Earth exited the LIA.
Faced with that fact, the question those rejecting AGW need to ask themselves is, why, after the Earth warmed enough to exit the LIA did it keep on warming? Indeed, why did it not only keep on warming, but warm faster? If the late twentieth century just represented a "recovery from the LIA", why did it not slow down as it approached the prior equilbrium level, but instead accelerated past it?
- Most of the last 10,000 years were warmer
steven foster at 06:26 AM on 22 November, 2013This is quite a thread, I just spent 45 minutes reading and studying through it.
Post 15 brings the GRIP2 chart to modern times using information from the GRIP site, by adding 1.44 C to 1855, but doesn't move the chart over to the left 50 years. I did that myself just now, lining up the chart so the end of the GISP2 data correctly lines up over 1855 rather than 1905.
What I find by doing that is, the modern warming period must have started quite a bit earlier than we normally understand, at least in Greenland. I've been under the assumtion that modern warming started around 1830 to 1840 or so, as many believe. But the data presented on this thread shows 1780 or 1790. The beginning of the modern hockey stick on the revised Easterbrook (editied for 1855-2013 by Tom Curtis here and moved over 50 years by myself (sorry I don't know how to post that here) the temperature appears to bend upwards in the late 1700's, perhaps 1780.
So, we have a long hockey stick with a 1.44 degree C rise from 1780 to now, with roughly the same slope throughout the whole 230 year period. 1780 is long before humans started making much CO2. This thread debunks the 10,000 claim of Monckton, Esterbrook, etc., but adds a new talking point for the deniers to use.....why did modern warming start in 1780?
- Ljungqvist broke the hockey stick
Morgan Wright at 15:52 PM on 19 November, 2013Just some basic fact checking for Tom. The GISP2 data does not start in 1855 as Tom says. At least not the source I used:
.095 thousand years is 95 years.
I only said 1900 as a rough approximation, far from "repeating a well known denier error" (not well known, never seen it before, I may have been the first to ever use it, please cite reference that it's a well known denier error). (-snip-)
- Ljungqvist broke the hockey stick
Morgan Wright at 14:09 PM on 19 November, 2013I just put the GISP2 chart here to show how it compares to the other 3 data sets. Looks like a nice fit. It also looks like some people are having a bad Monday.
Scaddenp that is a great idea, splicing modern Greenland Summit Station temps onto it. I probably should have done that. My bad.
Not a dogpile, more like puppies untying shoes.
- Ljungqvist broke the hockey stick
Tom Curtis at 14:09 PM on 19 November, 2013As some may not want to trouble themselves following links, here is the GISP2 data with the difference in temperature between the end of the data and 2010 at the site appended, for comparison with Morgan Wright's effort @9:

That, however, is not the last word. Since the GISP2 data was analyzed by Alley et al, Kobashi et al (2011) analyzed the same ice core at higher resolution, and to a more recent date. The higher resolution shows some greater temperature excursions in the past. Kobashi et al also directly compare the proxy data with the reconstruction of modern temperatures at the site by Box et al (2010), and to the actual recent instrumental record at the site:

You will notice that the recent temperature was just, and briefly exceded during the MWP, and significantly (approx 3 C) exceeded around 750 C.E. (ie, prior to the commencement of the MWP). That, of course, is of little relevance except as regards temperatures in Greenland. A single site is not the globe. It is not the Northern Hemisphere. It is not even the extra tropical Northern Hemisphere. Pretending that it is, ie, that a single local proxy can substitute for a multi-proxy reconstruction is (at best) incredibly foolish.
An argument that such a local proxy is acceptably representative because "it seems to agree fairly well with the others" is jaw-dropping in its audacity. Such an appearance of similarity is, in fact irrelevant and gives no basis to trust the local proxy in prefference to the reconstruction - especially where they disagree. When the argument is backed by simple errors of fact (the original GISS2 reconstruction extends only to 1855, not 1900), and is followed by appending global temperatures to a local proxy to represent changes in extra-tropical NH temperatures, it is evidently an invitation to inaccurate analysis. The only thing correct in Morgan Wright's analysis is that he did in fact show the GISP2 data from Alley et al.
- Ljungqvist broke the hockey stick
scaddenp at 13:01 PM on 19 November, 2013At risk of dogpiling - but Morgan, have you considered putting modern greenland temperature at the GISP2 site instead of a global average? (and I think the last record in GISP2 is 1855) . Don Easterbrook is the specialist in this nonsense. See here for more (including putting the modern temperature on).
- US school infiltration attempt by Heartland’s IPCC Parody
MA Rodger at 23:06 PM on 1 November, 2013I was a little over-optimistic with what I said @12. The NIPCC Chapter 2 becomes rather quickly dull reading being mainly straw-man-lynchings, misrepresentations and denialist nonsense. How boring is that?
I do wonder if a useful approach to debunking this NIPCC nonsense would be to compare the level of mistakes it manages to present with the level of mistakes within IPCC AR4. Then a short analysis of part of NIPCC would show that these numpties, the denialist 3%, are so error-prone that they create 30,000%* the level of error (* Actual value to be determined). How many mistakes in AR4 WG1? How many pages?Having read section 2.1 of NIPCC, it is truly riven with error. And almost all the citations are rather ancient. One passage is a simple cut-&-paste from Idso's website, a bizarre move as this insertion is new for 2013 in the NIPCC (that is, not in the 2011 version) but the insertion was written in 2000. So it's smack up to date, then.
Well, it is smack up to date compared with some of their "case" that CO2 does not cause warming (apparently). That graph they use from the Journal of Archaeological Science gives part of the Alley 2005 data that is known to provide data only up to 1855. Yet the numpties assume it provides data up to 2000 (which is quite evidently wrong if anyone actually examines the graph) This erroneous assumption of 2000 data results in them concluding that temperature has not been affected much by the 100ppm rise of CO2 over the last 200 years. This is a whopping CO2 rise give the previous 275-285ppm CO2 range during a 4,800 year period which shows large temperature fluctuations (although I'm not sure the Romans ever reached Greenland, or did the Late Bronze Age for that matter). Of course, by 1855 CO2 had yet to rise above 290ppm which sort of pulls the rug from under their "case" that 'CO2 doesn't cause warming'.
So to go through a whole chapter of this level of drivel is perhaps asking too much. I think I'll stick with a section or two. Error is ubiqitous although due process even on a single section will probably require more work than the numpties ever invested.Then, may be it takes a lot of effort to pack in so much error. For instance, the numpties say of Pagani et al 1999:-
"They (Pagani et al 1999) stated their finding “appears in conflict with greenhouse theories of climate change.” In addition, they noted the air’s CO2 concentration seemed to rise after the expansion of the East Antarctic Ice Sheet, also in conflict with greenhouse theories of climate change."
I think that counts as two errors in just the one sentence as "conflict" is neither stated nor implied by Pagani et al 1999.
- Watts Interview – Denial and Reality Mix like Oil and Water
Tom Curtis at 10:28 AM on 29 March, 2013For what it is worth, from an email to A Scott:Scott,
I also have been a little delayed in responding, the reason being I have been working on a comment at SkS, of which more later.
I continue to believe you are trying too hard to find a problem. The reason for having linguistic conventions is so that you do not have to continuously restate details. That is, the convention of year zero BP exists so that scientists do not have to restate the start year every time the report on a new proxy or dating. It follows that if such a convention exists (and it does), if no further information is provided, that is sufficient reason to consider the ages to be stated relative to 1950.
However, seeing you want to be obtuse (I'm sorry, but there is no better word), the facts are:
1) Meese et al 1994 established the standard chronology of the GISP2 icecore, in which "The column Ice Age gives ages in years before 1950 AD, where "0" refers to summer, 1950." The chronology is called the Meese/Sowers chronology because it is correlated with the Sowers et al 1993 chronology of Voskok. That is the standard chronology used thereafter and reference to the Meese/Sowers chronology does not represent a revision after publication for any publication after 1994.
2) Cuffey and Clow 1997 used the Meese/Sowers chronology, including the use of the 0 BP = 1950 convention beyond doubt, given that they state that "the age according to Meese/Sowers, given as years before 1950 AD. "
3) Alley 2000 use the same chronology as Cuffey and Clow. We know this because:
a) They do not mention using a different chronology for the data obtained from Cuffey and Clow, a severe lapse if they had in fact altered the chronology;
b) Present = 1950 is the standard convention, and using a different convention without stating so would have been a significant lapse;
c) Alley has confirmed the use of the Cuffey and Clow dating when inquiries were made;
d) Comparison of the smoothed Cuffey and Clow accumulation rates with the reported Alley et al accumulation rates provides a best match on the assumption that Alley et al used the convention that 0 BP = 1950;
e) Comparison of the Alley et al temperature reconstruction with the smoothed GISP2 d18O values gives the best match if you assume Alley et al used the standard convention; and
f) The youngest gas age (indicating closure of the firn under compaction) for the GISP2 core is 89 BP, corresponding well with Alley's earliest date of 95 BP.I believe the last is relevant because prior to the closure of the firn, water vapour in the atmosphere can penetrate the firn contaminating the data. Once the firn is closed, the relative mass of ice and water vapour ensures the data is dominated by the former.
Against this the only counter evidence is a NOAA page not constructed by Alley which is known to have at least one wrong date. Specifically, it says the start date of the data is -107,175 AD, whereas the earliest date in the data repository is 49981 BP (or 48,032 BC). Given that the NOAA page is out by over 50 thousand years for the start year, are you really going to rest your case on a 145 year discrepancy for the end year? On top of that, you have Easterbrook's claims, when he is not in the positon to know; and the caution of Alley's expression - which is not evidence that it is wrong.
This brings me to the SkS post which bypasses the whole Easterbrook vs the evidence conundrum. In 2011, Kobashi et al created a new reconstruction of GISP2 temperatures using different data from the same ice core. Importantly, they brought the reconstruction up well beyond 1950, and included a direct comparison with Box 2009's reconstruction of site temperatures from regional weather data, and with the automatic weather station on site for the last two decades. In that post, I overlay Alley 2000 with Kobashi 2011, and the overlay clearly shows that onsite temperatures increased by just under 1.5 C between the end of the Alley 2000 data and the end of the 20th century. It further shows that the terminal date in Alley 2000 is in the 19th century.
You may want to do that comparison yourself (along with those mentioned in 2 e & f above), but having done so, surely that is the end of the matter.
Except (a prediction here), it won't be for Easterbrook. He will continue using a single proxy from a highly variable region in preference to using a large number of proxies from across the globe. He will continue to insist that (at best) only the global average temperature increase should be added to his terminal data rather than the actual temperature increase at the site as shown by regional thermometers and by a new analysis of the GISP2 data. Possibly he'll go one worse and insist on using the Greenland average air/firn temperature difference rather than the site specific difference as determined by data. All in all, he will continue to insist that Alley 2000 shows that modern temperatures (early 21st century) are very low relative to the Holocene average.
I make the prediction with considerable confidence because he has been making the same refuted argument for many years, even though I know he has been advised of his mistakes. He is not interested in being accurate - he is interested in selling a message.
- Most of the last 10,000 years were warmer
Tom Curtis at 07:53 AM on 29 March, 2013Lanfear @25, I apologize for the delayed response. It is with good purpose, however. I have had the good fortune of rediscovering a recent paper (Kobaski et al 2011) showing a reconstruction of GISP2 data using a different method from Alley et al (2000). That paper, based on the same ice core as used by Alley et al, carries the reconstruction through to about 1990, something they are able to do because of a higher resolution sampling. Further, they directly compare their reconstruction to the Box 2009 reconstruction of temperatures since 1840 that is used in the main post; and with the AWS temperature record.
The main post here uses the Box data under the assumption that temperature differences determined by the same method are likely to be correct in terms of relative position, but when compared to records determined by other methods there may be biases (possibly unknown) which distort the result. Based on this principle, it adds the temperature difference between the decadal average of 1850-59 (corresponding to the end of the Alley et al temperature proxy) and 2000-09 (the present) to the Alley proxy. Decadal differences are used because of the low resolution of the proxy.
Kobaski et al discuss the issue directly, saying:
"Before the two records are combined with the 4000‐year temperature record, it is necessary to make an adjustment, as firn temperatures are colder than air temperatures by 0.2°C to 2.6°C in Greenland [Steffen and Box, 2001] as a result of the surface radiative cooling and inversion as noted above. As the mean difference between the decadal average reconstructed Summit temperatures and the reconstructed Greenland temperature for the 1845–2005 period is 1.75°C, the AWS and reconstructed Summit temperatures are reduced by 1.75°C (Figure 1)."
(My emphasis)
So you are correct that the cause of the difference is the difference between firn temperature and the surface air temperature.
As to the question about GISP2 temperatures and the MWP, that is more complex. The Kobashi 2011 reconstruction shows greater variability in temperature due to its higher resolution. As a result it shows some temperatues exceeding modern values in the MWP. It also shows a significant peak in temperatures around 700 AD which significantly exceed modern values, although that predates the traditional dating of the MWP:
(Kobashi et al 2011, figure 1. Click on image for higher resolution.)
I have attempted to overlay the Alley 2000 proxy data with the Kobaski 2011 reconstruction for comparison. Doing so clearly shows the difference in resolution. It shows some differences in the result as well. Most notably, the 700 AD peak in Kobashi 2011 corresponds to a trough in Alley 2000. I am certainly not expert enough to say which is likely to be more accurate where the two disagree.
Despite the differences, the curves track each other reasonably closely closely to show. The match should put paid to any doubts that the termination of Alley 2000 is around 1855, and that the 1855 temperature in Alley et al is approximately 1.5 C lower than modern temperatures at the same location:

(Alley 2000 overlayed with Kobaski 2011. Alignment was achieved based on the axis. Click on image for higher resolution.)
- Most of the last 10,000 years were warmer
Tom Curtis at 19:35 PM on 21 March, 2013Lanfear @20, the GRIP and GISP2 icecores where both drilled at the Summit. Hence the difference in temperature as measured at GRIP is a reasonable proxie for the difference at GISP2.
Your chart shows the difference between the absolute temperature in 1895 as measured using the GISP2 ice core proxy, and the absolute temperature as measured at a nearby location using the thermometers in the 2000s, ie, the difference between the end of the GISP2 icecore and the higher of the two blue crosses in last graph in the original post. However, as can be seen in the second last graph, GISP2 temperatures are cold relative to GRIP site temperatures in 1895, so it is far better to take the anomaly as is done in the OP or in the second graph @15. Even that should be taken as indicative only, rather than an exact measure.
- Watts Interview – Denial and Reality Mix like Oil and Water
A. Scott at 13:24 PM on 18 March, 2013Denial Strategy #3: Damage Control by Misrepresenting Data
When one chooses to attack others perhaps it might make sense to bother to get your own facts correct Dana.First - you attack what you claim as "Watts Graph" ... which you know full well was not Watt's at all. You had to copy and paste the URL here and in doing so would have clearly seen it was not Watt's at all:
http://hot-topic.co.nz/wp-content/uploads/2011/01/easterbrook_fig5.png
It is clearly one of Easterbrooks graphics, which would make perfect sense, as it was an article by Don Easterbrook. And the next graphic you show is clearly identified as Easterbrooks - not Watt's - in the inline comment in the graph and the URL.
Then you attack the accuracy, not of the data, but of a legend on the graphic. There are multiple versions of this graphic available on the internet. Many have the same (2000 AD) legend. It is not unique to Easterbrook. And there is a good reason for it.
You claim that 2000 AD is not the correct "present" date - that the data only goes to 1950. Yet you offer only another page at SKS as proof. When we go to that page here we see two more graphs from Easterbrook - adding more evidence yet you knew the source was not Watts.
On that SKS page we also find a NOAA graphic showing the R.B. Alley 2000 GISP 2.
Nope, no legend for what the "present" date is there either - even on the NOAA graphic you use to allegedly support your claims. You post a link below it to the NOAA FTP data for Alley 2000. My ftp is down, but a review of my archived copy shows - nope, zero mention of the "present" date there either. The only reference is "PERIOD OF RECORD: 49 KYrBP - present."We must accept your statement you are correct. Despite your failure to provide evidence that supports your claim. Doesn't mean you're wrong - but does mean you have failed to prove you are right.
(-snip-), lets go direct to the source - to NOAA's GISP 2 Paleo page for Alley 2000 and see what they say.Alley, R.B. 2000. The Younger Dryas cold interval as viewed from central Greenland. Start Year: -107175 AD End Year: 2000 AD
(-snip-).
I'm well informed about this issue as I had the same question long ago when I first started looking at Alley. I went to verify what "current" was and had to dig very deep.
Now I just happen to know you are correct. (-snip-)."
- Is Greenland close to a climate tipping point?
Daniel Bailey at 02:19 AM on 3 August, 2012
Falkenherz, attempts to average-away the melt layers found at the Greenland summit are just another form of hiding-the-decline in the frequency of the melt events. Prior to the event in the 1800's it had been an interval of more than 700 years to the next prior melt event.

[Source]
Given the decline in insolation forcing over time, it becomes correspondingly more rare for a confluence of factors to conjoin to create a melt event. Furthermore, give the unparalleled forcing from the previously-sequestered CO2 bolus mankind has injected into the carbon cycle, overall warming will continue for decades-to-centuries, with summit melt to become a regular occurrence in the near future (Box et al 2012). - Is Greenland close to a climate tipping point?
Byron Smith at 02:35 AM on 2 August, 2012
Bernard - Why pick a double Greenland total surface melt (or near total)? We already have had dozens of warnings quite sufficient to put the world on a "war footing" response. Setting up a new one actually serves to justify ongoing delay and offers a pointless hostage to fortune.
More generally, when quoting the 153 year average period between melting events in the ice cores from Summit camp, it is important to put this into the context given in the actual 1995 paper that established this calculation.
The study is available here and the very first sentence of the abstract ought to be required to be quoted anytime anyone wants to repeat the "150 year" idea. Here is the opening sentence: "The rare melt features in the GISP2, central Greenland deep ice
core have decreased in frequency over the most recent 7000 years." These melt events are not some quasi-clockwork natural cycle thing. The most recent one was in 1889 and before that, the next most recent one was not for another 700-800 years earlier. Why NASA chose to include that misleading quote about this being "right on time" in their press release, I'll never know. - Unprecedented Greenland Ice Sheet Surface Melt
SEAN O at 05:27 AM on 29 July, 2012
Gavin Schmidt as quoted by Joe Romm on :
Climate Progress
The NASA results are clearly unprecedented in the satellite record (and this is obviously what was being referred to), and come at the tail end of a strong increasing trend in summer surface melt area (as seen in data from the Steffen and Tedesco groups).
However, we know Greenland was warmer than today at many intervals in the past – the Early Holocene (from isotopes and borehole temperatures), the last interglacial, the Pliocene etc. so there is no claim that this is something that has never happened in the history of the planet.
Furthermore, the ‘every 150 years’ quote is very strange. The data on Summit melt layers – (discussed in the paper you reference
http://www.igsoc.org/annals.old/21/igs_annals_vol21_year1995_pg64-70.pdf )
and more easily visible here:
http://www.gisp2.sr.unh.edu/DATA/alley1.html
– indicates that the [1889] event was actually the only event in the last ~700 years, and there have only been 6 in the last 2000 years (4 of which were associated with the Medieval Climate Anomaly btw 750 and 1200AD). Hardly a frequently recurring ‘cycle’!
The all-Holocene average that Koenig is referring to includes the warmer Early Holocene where orbital variability was driving warmer northern high latitude summers — and which is not relevant to the expected frequency in today’s climate. - Unprecedented Greenland Ice Sheet Surface Melt
Physicist-retired at 23:51 PM on 28 July, 2012
Regarding the current melt in Greenland, and this quote:
"Ice cores from Summit show that melting events of this type occur about once every 150 years on average. With the last one happening in 1889, this event is right on time," says Lora Koenig...
I’ve looked at the Greenland ice core data for the last 10,000 years. You can see it here:
http://www.gisp2.sr.unh.edu/DATA/alley1.gif
It’s true that if one divides the total number of melt incidents over that 10,000 year record, it does average out to ~1 melt every 150 years or so.
But it’s also true that only one melt event has happened in the last 800 years or so (1889).
Am I missing something here? From that graph, this 97% July melt looks anything but 'typical'. - 2000 Years of Climate Reconstructed from Pollen
robert way at 05:35 AM on 15 February, 2012
You can't take GISP2 and just tack on thermometers onto them. There's so many processes at play that it just doesn't work. Using a model similar to Kobashi et al (2011, of which Jason Box is a co-author) is a better solution, not perfect but better. GISP2 and Kobashi are also using different proxies but anyways...
My issue is with the graph you presented.
Whether you're proving a point that you're right about or not, it doesn't warrant using something that is dubious to support your argument. Yes we know that there wasn't thousands of years where temps in the Arctic were significantly above the present (especially 9000 ca BP like Camburn suggests) but the graph presented above has a series of significant issues:
(1) The temperature provided as Current Greenland Temperature is not comparable with GISP2
From the author:
"The green line represents an estimate of current temperatures in central Greenland. I looked at the nearest station with a 100+ year record in the GISS database (Angmagssalik), and used a Mk 1 eyeball to estimate a 2.5ºC increase over the century (I’d welcome a more accurate estimate, if anyone’s prepared to dig one up). The difference between the green and blue lines is the warming that Easterbrook wants to ignore."
-That's just not acceptable.
(2) A dot was placed for the 2010 temperature on a graph which is not annually resolved. If annually resolved would the dot stick out as much? no... so why show it? You can't compare an instrumental temperature from one year to GISP2 without a rigorous method
(3) Kobashi's paper itself shows that the 2010 temperature was around the average of a few decades over the last 4000 years, yet in the figure shown it is the highest by far over the last 12,000... That isn't true nor is it scientifically accurate.
The reason I bring it up is because I think that this is an example of how proponents get themselves in trouble. That's all I was doing. I was not trying to argue with the main point of your conversation but just needed to point out that being right but using faulty evidence does not help anyone.
Sorry if I was harsh.
Kobashi et al
"The estimated average
Greenland snow temperature over the past 4000 years
was −30.7°C with a standard deviation of 1.0°C and exhibited a long‐term decrease of roughly 1.5°C, which is consistent with earlier studies. The current decadal average surface temperature (2001–2010) at the GISP2 site is −29.9°C. The record indicates that warmer temperatures were the norm in the earlier part of the past 4000 years, including century‐long intervals nearly 1°C warmer than the present decade (2001–2010). Therefore, we conclude that the current decadal mean temperature in Greenland has not exceeded the envelope of natural variability over the past 4000 years, a period that seems to include part of the Holocene Thermal Maximum. Notwithstanding this conclusion, climate models project that if anthropogenic greenhouse gas emissions continue, the Greenland temperature would exceed the natural variability
of the past 4000 years sometime before the year 2100."
RE: Ljungqvist. I saw this paper a few weeks ago. Interesting stuff. Has the most available proxies out of any study and uses a method superior to Mann's work. Concludes the rate of change is greater than any time over the last 1200 years but that periods of warmth on the century scale have equaled present. Interesting stuff. - 2000 Years of Climate Reconstructed from Pollen
robert way at 04:44 AM on 15 February, 2012
I've lost long comments twice now and I don't have time to write another one.
The point about tacking on modern temperatures is about this graph:
http://www.skepticalscience.com/pics/GISP2rescaled997.png
Which is wrong. The tacking on is not done appropriately and the graph cannot be used to substantiate ones argument because of it. Kobashi et al (2011) which I cited provides a better solution to the issue. We all agree there wasn't millennia of warmer temperatures than present. But in the last 4000 years in Greenland there were at least century long portions which were about a degree warmer than present. My point is that it is not as straightforward as the argument that is being made. Natural variability has been larger in the past than we sometimes talk about and it is important for us to point out the irrelevancy of these past warm periods, not argue about which period was warmer than which. Natural variability or not, you can't escape the physics... - 2000 Years of Climate Reconstructed from Pollen
Tom Curtis at 21:47 PM on 14 February, 2012
Robert Way @17, as I desire to be accurate, thank you for mentioning Kobashi et al, which I did not know (or had forgotten) about. Here is the image updated to include Kobashi et al's measured temperatures for central Greenland. It shows the 2001-2010 average (yellow line), but also the 2010 temperature (yellow dot indicated by the red arrow) for comparison:

Click on the image for a clearer view.
Revisiting my comments,
1) The revised figure shows GISP2 temperatures similar to current 9000 years ago, occasionally going as much as 0.5 degrees higher. No past temperature is as high as the 2010 temperature, but as the ice cores only show decadal resolution, that is not significant.
2) Despite the inaccuracy of Renowdon's estimate, at no time in the last 12 thousand years has central Greenland temperatures been 3 degrees C above the current decadal average. Alley et al (the data shown) do not show temperatures more than 1 degree C higher than present, while Kobashi et al's higher resolution reconstruction shows temperatures as much as 1.5 degrees C above present for very brief periods.
3) I cannot for the life of my figure out why Kobashi might take exception to my last comment in my previous post, which is a simple statement of fact. - 2000 Years of Climate Reconstructed from Pollen
Tom Curtis at 15:44 PM on 14 February, 2012
Further to DB's comment (inline @14), here is the temperature record from Greenland (GISP2) showing modern temperatures for comparison:
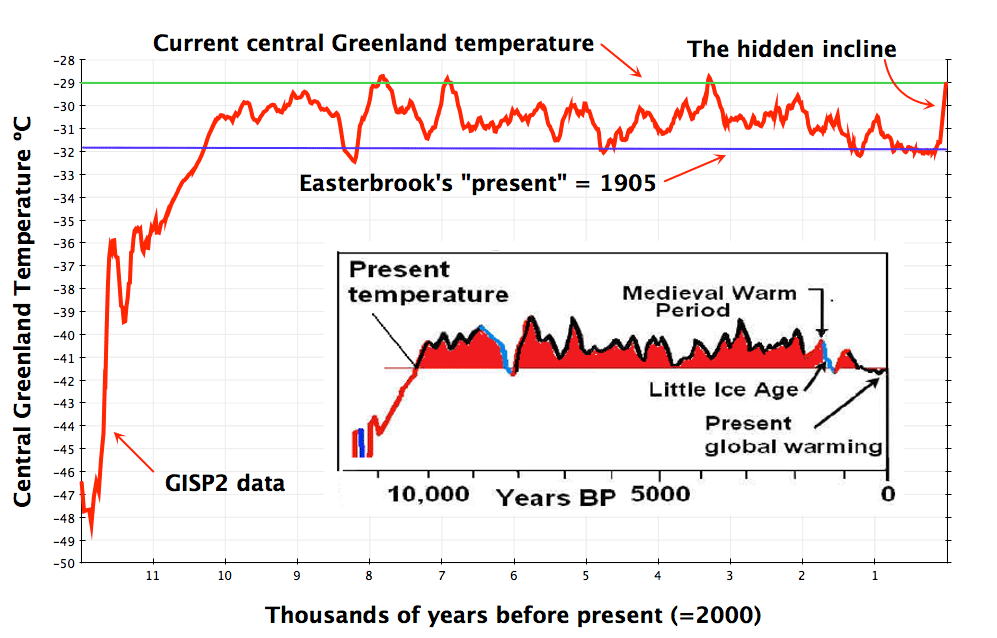
As clearly indicated, by the green line, central Greenland temperatures where not warmer than current temperatures about 9,000 years ago. The green line should not be taken as an exact indicator, based on the methodology used to produce it. But it is accurate enough to show the 3 degree C difference was not universal in the Arctic.
Note also that by convention, reports of modern temperatures in paleo studies are based on 1950 temperatures unless otherwise specified, so the 3 degree difference reported by Camburn may in fact be a 0.5 to 1 degree difference from current temperatures in the 2000s. - A Big Picture Look at Global Warming
ClimateWatcher at 03:38 AM on 6 January, 20125. John Russel the GISP record is regional not global, but it does indicate a fair number of temperature spikes:
"http://upload.wikimedia.org/wikipedia/commons/5/57/Greenland_Gisp2_Temperature.svg" - Michaels Mischief #3: Warming Island
robert way at 04:44 AM on 5 October, 2011
Tom Curtis at 23:54 PM on 4 October, 2011
Pauls @24, I believe it is a mistake to assume ice behavious is a simple function of annual temperatures.
In fairness, the statistical relationship between temperature and sea ice minimums for a year is very strong.
http://clearscience.wordpress.com/2010/11/19/predicting-past-sea-ice-extents/
The issues I have with Middleton are the use of GISP2 and greenland anomalies to characterize sea ice extent. I think I demonstrated somewhere recently that the relationship between ice volume and arctic air temperature is R2 = 0.77 (I was going to do a post on it one time). That's a pretty strong result. Maybe I should respond? haha - Hockey stick is broken
KR at 01:25 AM on 21 September, 2011
Jonathan - Not one of your references supports your assertions.
The Ljungqvist data directly contradicts you, see the New temperature reconstruction thread. Current temperatures are higher than anything in the last millenium.
From your second link, Oppo 2009, the abstract states - "Reconstructed SST was, however, within error of modern values from about ad 1000 to ad 1250, towards the end of the Medieval Warm Period. SSTs during the Little Ice Age (approximately ad 1550–1850) were variable, and approx 0.5 to 1 °C colder than modern values during the coldest intervals." (emphasis added)
The Greenland GISP2 data is interesting, and very limited. See the entire discussion at Crux of a Core, multiple parts. Primarily, that is not a global record.
Please - read the works you link to. Currently you appear to just be making stuff up. - Crux of a Core, Part 2 - Addressing Dr. Bob Carter
SRJ at 20:33 PM on 19 August, 2011
In the blog post it is stated that:
"In this there is no way to infer from GISP2 alone that any rise or fall in the record is a function of global temperature changes without looking at a wider range of site records".
I think the reason that people sometimes get confused and use GISP2 to represent global/large scale temperature changes - is caused by the text in the abstract that is quoted in the GISP2 data file
The abstract states:
"Greenland ice-core records provide an exceptionally clear picture of many aspects of abrupt climate changes, and particularly of those associated with the Younger Dryas event, as reviewed here"
The only data in the file is from GISP2, one needs to read the full article to find out that the statement in the abstract is based on multiple data sets. - The Medieval Warm(ish) Period In Pictures
Eric the Red at 22:35 PM on 13 July, 2011
scaddenp,
You were requesting information on glacial retreat. The first in from Schnidejoch in Central Europe, the second is from Glacier National Park in Montana, and the third is from the Greenland ice cores.
http://www.giub.unibe.ch/klimet/docs/climdyn_2007_grosjean_et_al.pdf
https://www.cfa.harvard.edu/~wsoon/RajeshKoushik10-d/MacGregoretal10-12900yrSwiftcurrentLakeGlacierNatlPark.pdf
ftp://ftp.ncdc.noaa.gov/pub/data/paleo/icecore/greenland/summit/gisp2/isotopes/gisp2_temp_accum_alley2000.txt - The Last Interglacial - An Analogue for the Future?
sentient at 05:08 AM on 26 June, 2011
Then again it just might be worse than we thought.
But what about that 6th interglacial, the one that wasn’t on the half-precessional “clock”. That would be MIS-11 (or the Holsteinian) which according to the most recently published estimate may have lasted on the order of 20-22kyrs, with the longest estimate ranging up to 32kyrs.
Loutre and Berger’s 2003 paper was soon followed by another landmark paper by Lisieki and Raymo (Oceanography, 2005), an exhaustive look at 57 globally distributed deep Ocean Drilling Project (and other) cores (Figure 1), which stated:
“Recent research has focused on MIS 11 as a possible analog for the present interglacial [e.g., Loutre and Berger, 2003; EPICA community members, 2004] because both occur during times of low eccentricity. The LR04 age model establishes that MIS 11 spans two precession cycles, with 18O values below 3.6o/oo for 20 kyr, from 398-418 ka. In comparison, stages 9 and 5 remained below 3.6o/oo for 13 and 12 kyr, respectively, and the Holocene interglacial has lasted 11 kyr so far. In the LR04 age model, the average LSR of 29 sites is the same from 398-418 ka as from 250-650 ka; consequently, stage 11 is unlikely to be artificially stretched. However, the June 21 insolation minimum at 65N during MIS 11 is only 489 W/m2, much less pronounced than the present minimum of 474 W/m2. In addition, current insolation values are not predicted to return to the high values of late MIS 11 for another 65 kyr. We propose that this effectively precludes a ‘double precession-cycle’ interglacial [e.g., Raymo, 1997] in the Holocene without human influence.”
To bring this discussion up to date, Tzedakis, in perhaps the most open peer review process currently being practiced in the world today (The European Geosciences Union website Climate of the Past Discussions) published a quite thorough examination of the state of the science related to the two most recent interglacials, which like the present one, the Holocene (or MIS-1) is compared to MIS-19 and MIS-11, the other two interglacials which have occurred since the Mid Pleistocene Transition (MPT) and also occurred at eccentricity minimums. Since its initial publication in 2009, and its republication after the open online peer review process in March 2010, this paper is now also considered a landmark review of the state of paleoclimate science. In it he also considers Ruddiman’s Early Anthropogenic Hypothesis, with Ruddiman a part of the online review. Tzedakis’ concluding remarks are enlightening:
“On balance, what emerges is that projections on the natural duration of the current interglacial depend on the choice of analogue, while corroboration or refutation of the “early anthropogenic hypothesis” on the basis of comparisons with earlier interglacials remains irritatingly inconclusive.”
The picture which emerges is that the post-MPT end interglacials appear to be populated with dramatic, abrupt global climate disruptions which appear to have occurred on decadal to centennial time scales. Given that the Holocene, one of at least 3, perhaps 4 post-MPT “extreme” interglacials, may not be immune to this repetitive phenomena, and as it is half a precession cycle old now, and perhaps unlikely to grow that much older, this could very well be the natural climate “noise” from which we must discern our anthropogenic “signal” from.
If we take a stroll between this interglacial and the last one back, the Eemian, we find in the Greenland ice cores that there were 24 Dansgaard-Oeschger oscillations (Figure 5, originally figure 1. Sole et al, 2007), or abrupt warmings that occurred from just a few years to mere decades that average between 8-10C rises (D-O 19 scored 16C). The nominal difference between earth’s cold (glacial) and warm (interglacial) states being on the order of 20C. D-O events average 1470 years, the range being 1-4kyrs.
Sole, Turiel and Llebot writing in Physics Letters A (366 [2007] 184–189) identified three classes of D-O oscillations in the Greenland GISP2 ice cores A (brief), B (medium) and C (long), reflecting the speed at which the warming relaxes back to the cold glacial state:
“In this work ice-core CO2 time evolution in the period going from 20 to 60 kyr BP [15] has been qualitatively compared to our temperature cycles, according to the class they belong to. It can be observed in Fig. 6 that class A cycles are completely unrelated to changes in CO2 concentration. We have observed some correlation between B and C cycles and CO2 concentration, but of the opposite sign to the one expected: maxima in atmospheric CO2 concentration tend to correspond to the middle part or the end the cooling period. The role of CO2 in the oscillation phenomena seems to be more related to extend the duration of the cooling phase than to trigger warming. This could explain why cycles not coincident in time with maxima of CO2 (A cycles) rapidly decay back to the cold state. ”
“Nor CO2 concentration either the astronomical cycle change the way in which the warming phase takes place. The coincidence in this phase is strong among all the characterized cycles; also, we have been able to recognize the presence of a similar warming phase in the early stages of the transition from glacial to interglacial age. Our analysis of the warming phase seems to indicate a universal triggering mechanism, what has been related with the possible existence of stochastic resonance [1,13, 21]. It has also been argued that a possible cause for the repetitive sequence of D/O events could be found in the change in the thermohaline Atlantic circulation [2,8,22,25]. However, a cause for this regular arrangement of cycles, together with a justification on the abruptness of the warming phase, is still absent in the scientific literature.”
In their work, at least 13 of the 24 D-O oscillations (indeed other workers suggest the same for them all), CO2 was not the agent provocateur of the warmings but served to ameliorate the relaxation back to the cold glacial state, something which might have import whenever we finally do reach the end Holocene. Instead of triggering the abrupt warmings it appears to function as somewhat of a climate “security blanket”, if you will.
Therefore taking into consideration the precautionary principle, we are left to ponder if reducing CO2’s concentration in the late Holocene atmosphere might actually be the wrong thing to do.
The possibility consequently exists that at perhaps precisely the right moment near the end-Holocene, the latest iteration of the genus Homo unwittingly stumbled on the correct atmospheric GHG recipe to perhaps ease or delay the transition into the next glacial. Under this analysis “Skeptics” and “Warmists” thus find themselves on the mutual, chaotic climate ground where the efficacy of CO2 as a GHG had better be right. - Most of the last 10,000 years were warmer
Tom Curtis at 09:46 AM on 22 May, 2011
NikFromNYC @ 10:
1) The "very misleading" graph shows the actual temperatures as the GRIP site with the small crosses, and the anomaly relative to the GISP2 core with the higher of the two horizontal lines. This can only be misleading to those who read neither the information on the graph, nor the article, which states immediately below the graph:
"The GISP2 series — the red line — appears to be identical to Easterbrook’s version. The bottom black line shows his 1855 “present”, and it intersects the red line in the same places as his chart. I’ve added a grey line based on the +1.44ºC quantum calculated from the GRIP temperature data, and two blue crosses, which show the GISP2 site temperatures inferred from adjusted GRIP data for 1855 and 2009."
It is hard to be clearer than that. Further, to be "mislead", a reader would have to also ignore the information in the graph plotting the temperature change at the GRIP site from 1855 to the present.
2) The clarity and openness with the information in the above article contrasts sharply with the practise of deniers. They either treat the temperature rise evident in the GISP2 core just prior to 1855 as the 20th century temperature rise (as does Easterbrook), or add a bar representing global temperature increase from (typically) 1905. The global temperature increase is significantly smaller than the local temperature increase, and comparing the two is inevitably misleading. Curiously, you find neither of those practises misleading, but find a clear debunking of the worst of them to be misleading because it clearly presents the relevant data. You must be using some non standard definition of "misleading" such as "shows my views on climate to be a house of cards".
3) In addition, Easterbrook's graph is is misleading because it treats a regional temperature index as a global temperature index. As just noted, regional temperatures have greater fluctuations in temperature than do global temperatures; a consequence of the fact that regional temperatures do not vary in synch. As can be seen from this graph of Holocene temperature proxies, regional temperature vary widely, but their average shows little variability:
Indeed, the GISP2 record (light blue on the chart) shows more variability than most regional proxies, a fact that should be well known to any frequent commentator on climate. Even the average on this chart probably shows more variability than the true global mean temperatures because of the low number of proxies, and because the proxies in this chart have a Northern Hemisphere bias (with half the the proxies coming from the NH extratropics).
As clearly indicated on the chart, 2004 temperatures are significantly above the average of even the Holocene Warm Period.
Of course, it is rather difficult for you to comment on Easterbrook's misleading practise of treating a regional temperature proxy as a global record given that you do the same thing in your comment.
3) It is a bit rich you commenting on "misleading ... debunking[s]" when you claim that "If you actually match up the 1855 temperatures, as any sincere effort would require, you get exactly what skeptics claim history is like: a just as hot MWP and a hotter Roman period." As can be clearly seen from your plot, modern regional temperatures on the Northern Greenland ice cap are about as much warmer than the MWP as they are cooler than the Roman WP at that location. And honest description, then, would be that modern temperatures are hotter than the MWP at that location, though the Roman WP was hotter, at that location.
Of course, globally, both where probably warmer than the 1950's, but cooler than the last decade. - Crux of a Core, Part 3... Dr. Ole Humlum
Rob Honeycutt at 02:21 AM on 2 April, 2011
Tom @ 6... Here is where I get some of the information regarding misuses of GISP2 data, and specifically the idea that snow drifts can cause some anomalous readings in the data. It's some material posted on Andy Revkin's Dot Earth blog.
Second, although the central Greenland ice-core records may provide the best paleoclimatic temperature records available, multiple parameters confirm the strong temperature signal, and multiple cores confirm the widespread nature of the signal, the data still contain a lot of noise over short times (snowdrifts are real, among other things). An isotopic record from one site is not purely a temperature record at that site, so care is required to interpret the signal and not the noise. An extensive scientific literature exists on this topic, and I believe we are pretty good in the community at properly qualifying our statements to accord with the underlying scientific literature; the blogospheric misuses of the GISP2 isotopic data that I have seen are not doing so, and are making errors of interpretation as a result.
- Crux of a Core, Part 3... Dr. Ole Humlum
Tom Curtis at 14:46 PM on 1 April, 2011
Rob Honeycutt @5, I am uncertain about the effects of snowdrifts on GISP2. The reason I object to using GISP2 (or any Greenland ice core) as a global proxy (above and beyond my more general objections against using any local proxy as a global proxy) is that Greenland dO18 is known to be unusually variable because of the North Atlantic Oscillation. In one mode of the NAO, the prevailing winds carry warm air onto Greenland from the Atlantic. In the other mode, it carries cold wind from the arctic.
As I understand it, the O18 concentrations in precipitation are a function of the temperature of the water from which the water vapour originally evaporated, and the intervening atmospheric temperatures, and the temperature at the location of precipitation, the upshot is that dO18 gives a record of a regional temperature rather than a site specific temperature. This means that in one mode of the NAO, Greenland ice cores give a record of the temperature across the northern Atlantic and Greenland, while in the other mode, they give a record of temperatures across the Arctic and Greenland. Thus they will exhibit a greater variability than the actual local Greenland temperatures themselves; and a far greater variability than most other local temperature records. - Most of the last 10,000 years were warmer
alecpiper at 01:46 AM on 18 March, 2011
You guys still miss the basic point. Over the past 25,000 years there have been major changes in temperature (up to 14 deg C) over 40 years without any anthropogenic influence. Recent temperature changes pale into insignificance when compared to the past.
Studies also show a close correlation between GISP2 (Greenland Ice Core project) and other glaciers. Samples from GICP are representative of world changes. See Dr Easterbrooks readable paper. http://wattsupwiththat.com/2011/01/24/easterbrook-on-the-magnitude-of-greenland-gisp2-ice-core-data/ - The Earth's Sixth Mass Extinction May Be Underway
ClimateWatcher at 07:20 AM on 15 March, 2011
#27
Firstly, current temperatures have already equaled those of the HCO, AKA the Holocene Altithermal (Hansen, 2011).
The context was the Mesopotamian era which took place near thirty degrees north. The Holocene optimum was due to orbital variation and we should recall that it was a period of more extreme climate in this regard - the northern hemisphere summers were hotter and longer AND the winters were colder but shorter. Thus the range of extremes was greater and the transition experienced a greater rate of change. Global averages do not reveals this behavior. And of course, the Southern hemisphere experience a nearly opposite cycle. In any event the Mesopotamians certainly experienced a higher than average temperature during their advancement of civilization.
There are other factors to note about the reference, though. This is not a peer reviewed publication for one. Further, the temperature series is at odds with both the borehole proxy data ( which was a global land date set):
http://www.geo.lsa.umich.edu/~shaopeng/2008GL034187.pdf.
It is also at odds with the Greenland ice core data:

Secondly, emissions are trending at the IPCC "High" emissions level.
Look again - I was pointing out that the temperature trends are all below even the IPCC "Low" scenario.
If the emissions are in fact increasing at a greater than modeled rate,
 , while temperatures are rising at less than the "low" scenario, then this is an indicator of even less forcing, or sensitivity, or both.
Lastly, it was exactly the climate stability of the HCO that allowed the development of agriculture.
Given what we know of the orbital variation, Mesopotamia encountered more sunshine for a longer period from spring through fall, but less sunshine than today during winter. For Mesopotamia, we may then surmise that warmer overall temperatures and longer summers aided agriculture, even though winters were colder and weather more extreme.
and the ensuing desertification to come as a result
I know of no basis for the claim of desertification above. Do you have a reference to one? The greatest example of desertification that I know of is the Sahara:
http://en.wikipedia.org/wiki/Sahara#Climate
which according to fossil records enjoyed a wet period during the Holocene Climatic Optimum - corresponding with the local wamrth! The cause of the Wet Sahara was likely more due to dynamic factors (shifting of the inter tropical convergence zone northward) rather than being due to thermal conditions, but even so, the desertification took place when hemispheric temperatures fell. I have not seen any compelling model that would indicate desertification. That is as it should be. Precipitation occurs largely where the dynamics of surface convergence can foster lifting, not something in the domain of climate models. - Crux of a Core, Part 1b
Tom Curtis at 18:23 PM on 4 March, 2011
Here is a detail of Rob Honeycutt's image @25 so that the extent to which temperature fluctuations in northern and southern polar regions are antiphased during the Holocence can be clearly seen:

And for completeness, ice cores over the Holocene for a Greenland, a Northern Chinese (Northern Hemisphere), two Andian (Tropcical), and two Antarctic (Southern Hemisphere)to give some idea as to the extent of regional variability involved:

- Crux of a Core, Part 1b
Rob Honeycutt at 09:05 AM on 4 March, 2011
Yup. Here it is... Bond event 5:
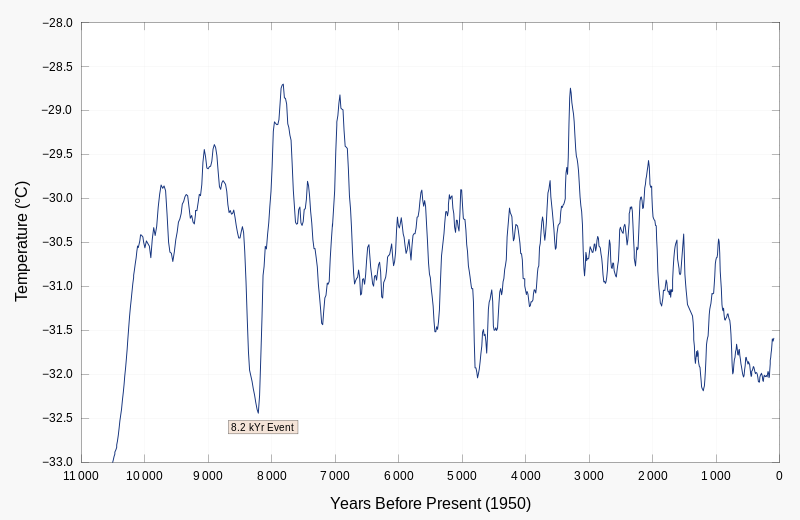
- Crux of a Core, Part 1b
muoncounter at 14:36 PM on 3 March, 2011
"between 135,000 and 110,000 years before present ... temperatures dropped from 2C warmer than they are today to 5C cooler in less than a few centuries"
You really have to look carefully at time resolution for events that old. Do the original data justify hundred year resolution at >100k yr bp?
"massive temp fluctuations"
Even in GISP2 temp data, the big warmup from about 12.5kyr bp to 10.2kyr bp was 'only' ~17C in 2300 yrs, about 0.07C/decade. We're doing 2x that globally now; 5x that in the northern hemisphere. - Crux of a Core, Part 1b
garythompson at 14:21 PM on 3 March, 2011
i've read the SkC original posting, the WUWT rebuttal and now the SkC rebuttal of the rebuttal and enjoyed all of them and learned some from each. thanks rob for your time in posting these articles.
with regard to Dr. Hall changing the scales of the Vostok data to match the GISP2 data i didn't have an issue with this. he stated in the rebuttal that he did this and the reason for doing it. the purpose in doing this, as i understand it, was to show that both data sets had similar inflection points and showed common periods of warming and cooling. and the fact that greenland and antartica showed similar trends speaks to the theory that maybe both local temperature sets give a picture of the entire global temperature trends. Dr. Hall also notes that there are periods where the two set diverge in their trends as you stated in this post.
and with regard to unprecedented temperatures of the 20th century - i'd say that antartica has seen warmer temperatures as the vostok data shows. but i agree with the posting here that you can't take that local temperature set and extrapolate that to the rest of the planet. but to my knowledge there isn't another proxy that dates back as far as these ice cores so until we get that for another part of the globe it must be feasible that the rest of the earth was warmer than the 20th century during these periods shown in the vostok data. if there are other proxies that show data contrary to this i'd appreciate a link so i can check it out. i'm trying not to get OT here but i'm trying to raise the point that since we are data limited for these long times in the past we can't rule something out that is supported by the only data we have. - Crux of a Core, Part 1 - addressing J Storrs Hall
Tom Curtis at 12:40 PM on 3 March, 2011
Charlie A, your whole case comes down to not understanding the difference between attribution and analysis. Rob Honeycutt never says that J Storrs Hall did not correctly attribute the GISP2 ice core to the GISP2 site. He clearly indicates, however, that in his analysis, Hall treats the GISP2 records as though it were a global record.
That Hall does treat the GISP2 record as though it were a global record is obvious in his comparisons between the variability in the GISP2 ice core and the recent rise in global temperatures. That comparison is explicit in Hall's article in which he refers to the "hockey stick", and in which he says temperatures continue "... up in the 20th century at least another half a degree."
To start with, global temperatures rose by 0.8 degrees from the 1850's to the 2000's (the actual interval between the end point and modern times), or by 0.9 from the 1900's to the 2000's (the interval Hall thought to exist). So even if a comparison between local and global temperatures were valid, Hall has understated the temperatures increase by 40%. That sort of misinformation seems not to vex you, but as it is part of a critical point at issue, it shows a complete disregard for accuracy in Hall's analysis.
More to the point however, as Hall is using a local record, he should have stated the additional increase in local terms. In other words, the state increase should have been 1.44 degrees (1850's to 2000's decadal average) or 3.7 degrees (1855 to 2010). In either case, the rise in Greenland temperatures in the 20th century would have had only two parallels in the chart, both (I believe) caused by events relating to the melting of the continental Ice Sheets following the preceding glacial.
Now, either Hall new the difference between local temperatures and global temperatures or he didn't. If he did, then he knowingly understated the 20th century temperature rise by a factor of between 3 and 6 on a crucial point in his analysis; and is consequently a liar. If he did not, then Honeycutt's claim that "Hall presents GISP2 as if it were a global record ...". By arguing that Honeycutt is wrong about that, you implicitly argue that Hall is deliberately dishonest. There is no way around that logic.
Honeycutt, not one to stoop to ad hominem, has taken the charitable interpretation that Hall is confused on the difference between local and global tempertaures. You apparently are not so charitable. However, whether Hall is dishonest or incompetent is a side issue. Your restricted focus on that issue alone shows that you are trying to distract readers from Honeycutt's devastating critique of Hall's argument. - Crux of a Core, Part 1 - addressing J Storrs Hall
Charlie A at 04:38 AM on 3 March, 2011
The above is from WUWT.
Note the "Central Greenland: caption in the upper right.
Compare with the Skeptical Science version, below:

Fig. 1: GISP2 as presented on Watts Up With That, conflating a local record with a global record.
Notice the removal of the "Central Greenland" caption.
==================
Let's move on into the article a couple of paragraphs:
Rob Honeycutt claims "Hall presents GISP2 as if it were a global record and makes no attempts to clarify that it is not nor does he even hint that he has any inclination that this is the case."
A simple scan of the article Honeycutt links to,Hockey Stick Observed In NOAA Ice Core Data shows the error of Mr. Honeycutt's statement.
The data is introduced as "It gives us about as close as we can come to a direct, experimental measurement of temperature at that one spot for the past 50,000 years." - Crux of a Core, Part 1 - addressing J Storrs Hall
Charlie A at 16:49 PM on 2 March, 2011
Rob Honeycutt -- I'm trying to understand your article. In particular, I'm trying to figure out the source of your Figure 1, with your caption of "GISP2 as presented on Watts Up With That, conflating a local record with a global record."
The only source I have found for that is the link you provided, http://wattsupwiththat.files.wordpress.com/2009/12/noaa_gisp2_icecore_anim_hi-def3.gif
In that link, however, the chart is clearly labeled "Data Source: GISP2 Ice Core, Central Greenland".
It seems like you removed the "Central Greenland" label, and then accused Watts of conflating local and global records. Did you indeed do this?
Please identify the source of your Figure 1, so your readers can judge for themselves what sort of conflation is going on.
The other WUWT link you provided also very clearly talks about this being for 1 point on the earth. - Crux of a Core, Part 1 - addressing J Storrs Hall
Tom Curtis at 13:27 PM on 2 March, 2011
Charlie A @31, first let me second scaddenp's comment which is exactly to the point.
Let me add, first, that Hall feeling slighted about not being called "Dr" is extraordinarily precious from somebody who dismisses climate scientists as "The Hockey Team" and dismisses (his straw man version of) their theories as "poppycock".
More substantively, it is very noticeable that when he compares Antarctic and Greenland ice cores, he does so over the period of the Last Glacial Maximum. Unsurprisingly, there is a correlation between temperature differences between the LGM and the Holocene (the last 10 thousand years). But even during the last glacial there are clear anti-correlations between the three ice cores, even between the two Greenland ice cores on a scale of thousands of years. Therefore his failure to show a comparison of GISP2 and Vostok over the period of the Holocene with sufficient resolution is very damming.
Such a comparison can be made in Figure 3 above. Vostock is shown in Dark Blue, GISP2 in light blue. If you look closely you will see that they are anti-correlated for most of the holocene. That means their average will have far fewer and smaller fluctuations then either seperately. The rapid rises and declines in the Greenland ice core during the Holocene are not global events, but the equivalently precipitous rise in late twentieth century temperatures is.
Finally, he claims "The 20th-century warming was hardly unprecedented, and doesn’t call for unusual explanations." Let's leave aside that greenhouse warming is not an unusual explanation. The fact of the matter is that any change of climate needs some explanation. For global temperatures to change by up to a degree or more without explanation would violate conservation of energy. As it happens, the only substantive explanation is anthropogenic emissions of Green House Gases.
(On a side note, Hall's PhD is in "computer science", which may well make him a skilled programmer, but it does not make him a scientist despite his claims.) - Crux of a Core, Part 1 - addressing J Storrs Hall
Tom Curtis at 13:25 PM on 27 February, 2011
Beryényi Péter, are reproduced @17:
1) The first point to notice is that Stott et al 2004 is one of the plots (dark red) reproduced in Figure 3 of the main article. The full list of data in that figure is here.
You will notice that the Western Tropical Pacific only rose above the (global) 2004 temperatures anomally 5,000 years ago, and again 10,000 years ago. At those times, the only Southern Hemisphere data in the above graph (Vostok and Epica) were both significantly below modern temperatures. The net effect is that the average is noticably below 2004 temperatures. That probably overstates the Holocene Climactic Optimum temperatures in that there is a NH bias in the data.
The point is, cherry picking two local temperature indices and claiming they represent the global temperature is no more principled than cherry picking one.
2) As per the convention, the "present" in paleoclimate reconstructions is 1950. Stott et al do not mention more recent dates for their data, so the most recent datum on the graph is for 1950. As can be easily verified at GISS, current temperatures in the western Pacific are at least 0.5 degrees warmer than they were in 1950 (comparison of 12 year average centered on 1950.5 with 12 year average ending in 2010).
Again, the Western Pacific has only been warmer than this a couple of times, and not during the HCO.
The Western Pacific was between 1 and 2 degrees warmer in 2010 than in 1950, making it much warmer than any point on that chart, but issues of resolution mean this may not be an appropriate comparison.
Finally, in response to your questions:
a) Several examples of cooler locations at those times can be found in Figure 3 above. Indeed, GISP2 (light blue in figure 3) is anticyclical to the Western Pacific data, so that the large peaks in the Western Pacific temperatures coincide with troughs in the Greenland temperatures, so your question is based on a false premise; and
b) The anticyclical nature of GISP2 and Western Pacific shows the majority of the variation to be regional in nature, and therefore likely to have primarily regional causes. So, while there may be some connection, you do not show that there is and your question is based on the false assumption of synchrony between GISP2 and Western Pacific temperature peaks. - Crux of a Core, Part 1 - addressing J Storrs Hall
Daniel Bailey at 12:27 PM on 27 February, 2011
Re: Berényi Péter (13)
Your comment was deleted due to your contextual usage of the phase "if you actually understand". Those who have a history of pushing the envelope of compliance with the Comments Policy, as you have, will necessarily receive a greater level of comment scrutiny, and less benefit of the doubt, than others do.
I reproduce your comment below sans offending phrase:
____________________________________________________________________
Berényi Péter at 08:21 AM on 27 February 2011
"This clearly tells us that oxygen isotope ratios (like the ones used for GISP2) are measuring a local record of temperature for the summit of the Greenland ice sheet, and are not a global proxy"
I see. Oxygen isotope and Mg/Ca data from foraminifers retrieved from sediment cores in the western tropical Pacific Ocean are probably not global proxies either. It just shows that not only some pretty cold places got even colder, but one of the warmest spots as well.
2004 Nature, 431, 56-59
DOI: 10.1038/nature02903
Decline of surface temperature and salinity in the western tropical Pacific Ocean in the Holocene epoch
Stott, L., Cannariato, K., Thunell, R., Haug, G. H., Koutavas, A., Lund, S.

However, if it is cooler today at both places than it used to be several thousand years ago while global average temperature is higher right now, it follows there should be other places on Earth where it was cooler back then. Could you kindly show us several such examples from the literature?
More importantly, if... the gradual cooling in the tropical western Pacific since the Holocene Thermal Maximum (HTM), as it is shown in Fig. 3. Stott 2004 has been driven by changes in the tilt of the planet, please share this knowledge with us. - Crux of a Core, Part 1 - addressing J Storrs Hall
70rn at 00:11 AM on 27 February, 2011
Jason Box, PhD from the Byrd polar research center, has as a blog here; - http://www.meltfactor.org/blog/?p=294 - showing the current 2010 greenland ice sheet temperature anomaly at 2.4 degrees above average.
It's hardly good science to put in the current curve atop figure 1 for comparison, but no worse than slapping on the global trend for the same period. It would be intersting to see if some one could smooth the contemporary trend into the GISP2 curve to give a better idea where we're at currently.
Failing that, getting his curve onto this site might be nice, at the very least. - Hockey stick is broken
LandyJim at 22:50 PM on 18 January, 2011
Here is another reputable reference for the GISP2 Ice Core Data sets from Richard Alley
ftp://ftp.ncdc.noaa.gov/pub/data/paleo/icecore/greenland/summit/gisp2/isotopes/gisp2_temp_accum_alley2000.txt
And here is the abstract from the top of at work.
ABSTRACT:
Greenland ice-core records provide an exceptionally clear picture of
many aspects of abrupt climate changes, and particularly of those
associated with the Younger Dryas event, as reviewed here.
Well-preserved annual layers can be counted confidently, with only 1%
errors for the age of the end of the Younger Dryas 11,500 years before
present. Ice-flow corrections allow reconstruction of snow accumulation
rates over tens of thousands of years with little additional uncertainty.
Glaciochemical and particulate data record atmospheric-loading changes
with little uncertainty introduced by changes in snow accumulation.
Confident paleothermometry is provided by site-specific calibrations
using ice-isotopic ratios, borehole temperatures, and gas-isotopic ratios.
Near-simultaneous changes in ice-core paleoclimatic indicators of local,
regional, and more-widespread climate conditions demonstrate that much
of the Earth experienced abrupt climate changes synchronous with
Greenland within thirty years or less. Post-Younger Dryas changes
have not duplicated the size, extent and rapidity of these
paleoclimatic changes. - Hockey stick is broken
LandyJim at 13:50 PM on 18 January, 2011
Sadly this debate is the classic example of some people ignoring reality. The Hockey Stick is a misleading graph that has no place anymore in the argument. It was created with some wrong assertions and a lack of accurate data that led to the now infamous graph.
I find it incredulous that a so called respected researcher could be fooled by his error so painfully. The Medieval Warm Period and the Little Ice Age are well documented and reported periods of the last 1000 years. To adjust data sets to start just as the climate was cold and then warmed is misleading.
There are graphs out there that paint a different picture:


This next graph shows the temperature records take from the Vostok Ice Cores and have appeared in numerous publications, including Science, over the last couple of years. The current temperature is 0 on the graph with the variation above and below this as either a positive or negative value. It is for 10,000 years and clearly shows a high degree of variation in average temperature
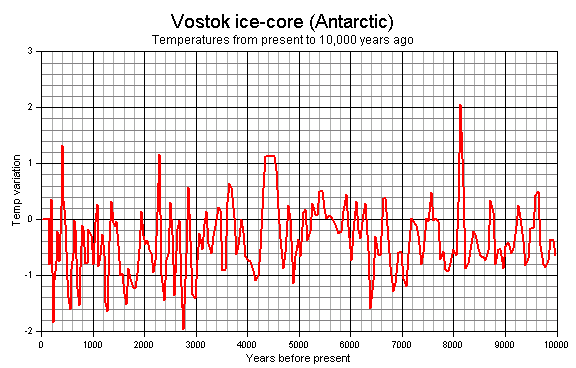
Then we have Ice core data from Greenland's GISP2 Ice Core which clearly shows that our current understanding of how the climate naturally varies over time leaves a lot to be desired. This graph was produced by Climate Change researchers and clearly does not support the anthropogenic argument.

When it comes to discussing climate, we should not be looking at trends in data for 10, 30 or even hundred year block of time, but we must study the data for thousands of years worth. The planet does not work on human timescales so our observations must reflect this fact.
Bleating about the impact man has or is not having is pointless, we must simply stop polluting our environment and let nature sort the rest out. We need to make significant changes to how we deal with environmental matters, quick fixes are not intelligent or likely to work, only long term, thought out and sustainable changes will achieve any measure of success. - Understanding the CO2 lag in past climate change
gallopingcamel at 07:53 AM on 8 January, 2011
Alec Cowan (@119),
The correlations I was talking about are really striking. You seem to doubt me so take a look at this:
http://www.gisp2.sr.unh.edu/DATA/Bender.html
I hope you will agree that a correlation between high latitudes in both hemispheres goes a long way to counter the argument that what goes on in Greenland can be dismissed as a local phenomenon. - Understanding the CO2 lag in past climate change
gallopingcamel at 01:29 AM on 8 January, 2011
Daniel Bailey,
As you point out in your response to my last comment (#100) my data only applies to Greenland. While this is a relatively small region, there is a good correlation between the GISP/GRIP results and Vostok in Antarctica. Also, the GISP2 data clearly shows historic events (Minoan Warm Period etc.) that occurred in lower northern latitudes.
I am working on the high latitudes in Russia and Canada. Give me a little time as I do have a day job. - Are ice sheet losses overestimated?
The Inconvenient Skeptic at 11:44 AM on 17 November, 2010
@Robert,
I appreciate that you recognize the relevance of the MWP in this particular discussion. I promise to stay strictly on Greenland with regards to the MWP.
I will take issue with your statement that:
"What the mass loss for Greenland "should be" is completely irrelevant."
Let us start on what we should be able to agree upon. The ice loss during the MWP was of a comparable magnitude to what is currently happening. We should also agree that the MWP in Greenland was a natural occurrence. That leaves us with a situation in the recent past that naturally had comparable ice loss to the current day.
This leaves open the possibility that the current warming is natural in cause. This is partially why I am curious about the behavior of the ice sheets during the 1940-1950 period. Many NH glaciers experienced significant retreat during this period.
That makes understanding the natural sheet loss very relevant. If the sheet loss was as great in 1940, then it is very hard to say that CO2 emissions have caused an "unnatural" rate of loss today.
Comparing to the GISP2 would require a comparable smoothing as to what the ice core had. Since most ice cores are heavily smoothed showing a single year is meaningless.
A more comparable one would be GRIP which runs until 1989. That is close to the 1990 point you have on the smoothed GISP2. Certainly there is no sudden increase evident in the GRIP data. Since this is much closer to single year data it is a better comparison to the single point compared to the GISP2 you linked. (many will be amused by that from long discussions on my site)
The GRIP data shows that the 1930-1940 period were very warm. That is why the sheet loss from that period is relevant. I argue that it could easily have been of comparable magnitude to the current ice loss. If that is the case then CO2 levels have had little impact.
I hope that you recognize that I am not just arguing for the sake of arguing. My own analysis of the data indicates that there is reason to believe that the current warming is natural.
I would also note that the orbital forcing is cooling summers and warming winters. They do go hand in hand.
John Kehr
The Inconvenient Skeptic - Are ice sheet losses overestimated?
robert way at 08:45 AM on 17 November, 2010
John Kerr,
Another way to approach this question is that the maximum amplitude in sea level change from the MWP potential maximum (21 cm greater than present) to the LIA potential minimum (26 cm lower) is 47 cm and can be as small as 31 cm over the last 2000 years (Grinsted et al 2010). The expected sea level rise according to Grinsted et al (2010) if there is NO additional warming (this doesn't include 2010s warm year) is between 21 to 44 cm by 2100. So not even including any additional warming we see, we will sea a sea level rise which is as great as the amplitude between the highest of the MWP and the lowest of the LIA by 2100. Kinda supercedes your natural variability theory doesn't it?
Lets dive a little deeper. You may not be a glaciologist but i'm sure you have heard about dynamical ice changes which are underway in Greenland and West Antarctica correct? These ice changes are irreversible in West Antarctica (particularly in Pine Island Bay) where the bed slopes downward into the interior of West Antarctica. The losses from this region ARE accelerating, the same as they are from portions of Greenland grounded below sea level. The mechanisms are WELL-UNDERSTOOD and continued oceanic and atmospheric warming will hasten the removal of buttressing ice shelves/grounding lines and thereby accelerate flow into the oceans.
But back to your initial premise. It is true that climate throughout the holocene has been to some degree variable. And it is true that the timing of the hypsithermal is different in different regions thereby causing periods of warming in the past. But since the Hypsithermal you DO NOT see spikes in sea level of 2 meters. You see *relative* stability. Oscillating climate patterns superimposed on a downward orbital signal. You can pick a core or two out as much as you want, but unless you are able to give some sort of comparison to current temperatures then its irrelevant. I could take your GISP2 core and do this:
http://www.skepticalscience.com/pics/Gisp2Graphedited.png
but that doesn't make it right. Showing half the evidence doesn't either...
Finally,
Nowhere in the article does it talk about AGW. We don't use ice losses to diagnose and attribute AGW. We use empirical evidence from a multitude of places. Just because ice losses are able to detect associations with warmth does NOT mean that we are saying this is how we PROVE it is man-made. - CO2 lags temperature
sentient at 04:46 AM on 24 October, 2010
You know, in science, there was once this thing we called the Theory of Multiple Working Hypotheses. Anathema (a formal ecclesiastical curse accompanied by excommunication) in modern climate science. So, in juxtaposition to the hypothesis of future global climate disruption from CO2, a scientist might well consider an antithesis or two in order to maintain ones objectivity.
One such antithesis, which happens to be a long running debate in climate science, concerns the end Holocene. Or just how long the present interglacial will last.
Looking at orbital mechanics and model results, Loutre and Berger (2003) in a landmark paper (meaning a widely quoted and discussed paper) for the time predicted that the current interglacial, the Holocene, might very well last another 50,000 years, particularly if CO2 were factored in. This would make the Holocene the longest lived interglacial since the onset of the Northern Hemisphere Glaciations some 2.8 million years ago. Five of the last 6 interglacials have each lasted about half of a precession cycle. The precession cycle varies from 19-23k years, and we are at the 23kyr part now, making 11,500 years half, which is also the present age of the Holocene. Which is why this discussion has relevance.
But what about that 6th interglacial, the one that wasn’t on the half-precessional “clock”. That would be MIS-11 (or the Holsteinian) which according to the most recently published estimate may have lasted on the order of 20-22kyrs, with the longest estimate ranging up to 32kyrs.
Loutre and Berger’s 2003 paper was soon followed by another landmark paper by Lisieki and Raymo (Oceanography, 2004), an exhaustive look at 57 globally distributed deep Ocean Drilling Project (and other) cores, which stated:
“Recent research has focused on MIS 11 as a possible analog for the present interglacial [e.g., Loutre and Berger, 2003; EPICA community members, 2004] because both occur during times of low eccentricity. The LR04 age model establishes that MIS 11 spans two precession cycles, with 18O values below 3.6o/oo for 20 kyr, from 398-418 ka. In comparison, stages 9 and 5 remained below 3.6o/oo for 13 and 12 kyr, respectively, and the Holocene interglacial has lasted 11 kyr so far. In the LR04 age model, the average LSR of 29 sites is the same from 398-418 ka as from 250-650 ka; consequently, stage 11 is unlikely to be artificially stretched. However, the June 21 insolation minimum at 65N during MIS 11 is only 489 W/m2, much less pronounced than the present minimum of 474 W/m2. In addition, current insolation values are not predicted to return to the high values of late MIS 11 for another 65 kyr. We propose that this effectively precludes a ‘double precession-cycle’ interglacial [e.g., Raymo, 1997] in the Holocene without human influence.”
To bring this discussion up to date, Tzedakis, in perhaps the most open peer review process currently being practised in the world today (The European Geosciences Union website Climate of the Past Discussions) published a quite thorough examination of the state of the science related to the two most recent interglacials, which like the present one, the Holocene (or MIS-1) is compared to MIS-19 and MIS-11. The other two interglacials which have occurred since the Mid Pleistocene Transition (MPT) also occurred at eccentricity minimums. Since its initial publication in 2009, and its republication after the open online peer review process again in march of this year, this paper is now also considered a landmark review of the state of paleoclimate science. In it he also considers Ruddiman’s Early Anthropogenic Hypothesis, with Rudddiman a part of the online review. Tzedakis’ concluding remarks are enlightening:
“On balance, what emerges is that projections on the natural duration of the current interglacial depend on the choice of analogue, while corroboration or refutation of the “early anthropogenic hypothesis” on the basis of comparisons with earlier interglacials remains irritatingly inconclusive.”
As we move further towards the construction of the antithetic argument, we will take a closer look at the post-MPT end interglacials and the last glacial for some clues.
An astute reader might have gleaned that even on things which have happened, the science is not that particularly well settled. Which makes consideration of the science being settled on things which have not yet happened dubious at best.
Higher resolution proxy studies from many parts of the planet suggest that the end interglacials may be quite the wild climate ride from the perspective of global climate disruption.
Boettger, et al (Quaternary International 207 [2009] 137–144) abstract it:
“In terrestrial records from Central and Eastern Europe the end of the Last Interglacial seems to be characterized by evident climatic and environmental instabilities recorded by geochemical and vegetation indicators. The transition (MIS 5e/5d) from the Last Interglacial (Eemian, Mikulino) to the Early Last Glacial (Early Weichselian, Early Valdai) is marked by at least two warming events as observed in geochemical data on the lake sediment profiles of Central (Gro¨bern, Neumark–Nord, Klinge) and of Eastern Europe (Ples). Results of palynological studies of all these sequences indicate simultaneously a strong increase of environmental oscillations during the very end of the Last Interglacial and the beginning of the Last Glaciation. This paper discusses possible correlations of these events between regions in Central and Eastern Europe. The pronounced climate and environment instability during the interglacial/glacial transition could be consistent with the assumption that it is about a natural phenomenon, characteristic for transitional stages. Taking into consideration that currently observed ‘‘human-induced’’ global warming coincides with the natural trend to cooling, the study of such transitional stages is important for understanding the underlying processes of the climate changes.”
Hearty and Neumann (Quaternary Science Reviews 20 [2001] 1881–1895) abstracting their work in the Bahamas state:
“The geology ofthe Last Interglaciation (sensu stricto, marine isotope substage (MIS) 5e) in the Bahamas records the nature of sea level and climate change. After a period of quasi-stability for most of the interglaciation, during which reefs grew to +2.5 m, sea level rose rapidly at the end ofthe period, incising notches in older limestone. After briefstillstands at +6 and perhaps +8.5 m, sea level fell with apparent speed to the MIS 5d lowstand and much cooler climatic conditions. It was during this regression from the MIS 5e highstand that the North Atlantic suffered an oceanographic ‘‘reorganization’’ about 11873 ka ago. During this same interval, massive dune-building greatly enlarged the Bahama Islands. Giant waves reshaped exposed lowlands into chevron-shaped beach ridges, ran up on older coastal ridges, and also broke off and threw megaboulders onto and over 20 m-high cliffs. The oolitic rocks recording these features yield concordant whole-rock amino acid ratios across the archipelago. Whether or not the Last Interglaciation serves as an appropriate analog for our ‘‘greenhouse’’ world, it nonetheless reveals the intricate details ofclimatic transitions between warm interglaciations and near glacial conditions.”
The picture which emerges is that the post-MPT end interglacials appear to be populated with dramatic, abrupt global climate disruptions which appear to have occurred on decadal to centennial time scales. Given that the Holocene, one of at least 3 post-MPT “extreme” interglacials, may not be immune to this repetitive phenomena, and as it is half a precession cycle old now, and perhaps unlikely to grow that much older, this could very well be the natural climate “noise” from which we must discern our anthropogenic “signal” from.
If we take a stroll between this interglacial and the last one back, the Eemian, we find in the Greenland ice cores that there were 24 Dansgaard-Oeschger oscillations, or abrupt warmings that occurred from just a few years to mere decades that average between 8-10C rises (D-O 19 scored 16C). The nominal difference between earth’s cold (glacial) and warm (interglacial) states being on the order of 20C. D-O events average 1470 years, the range being 1-4kyrs.
Sole, Turiel and Llebot writing in Physics Letters A (366 [2007] 184–189) identified three classes of D-O oscillations in the Greenland GISP2 ice cores A (brief), B (medium) and C (long), reflecting the speed at which the warming relaxes back to the cold glacial state:
“In this work ice-core CO2 time evolution in the period going from 20 to 60 kyr BP [15] has been qualitatively compared to our temperature cycles, according to the class they belong to. It can be observed in Fig. 6 that class A cycles are completely unrelated to changes in CO2 concentration. We have observed some correlation between B and C cycles and CO2 concentration, but of the opposite sign to the one expected: maxima in atmospheric CO2 concentration tend to correspond to the middle part or the end the cooling period. The role of CO2 in the oscillation phenomena seems to be more related to extend the duration of the cooling phase than to trigger warming. This could explain why cycles not coincident in time with maxima of CO2 (A cycles) rapidly decay back to the cold state. ”
“Nor CO2 concentration either the astronomical cycle change the way in which the warming phase takes place. The coincidence in this phase is strong among all the characterised cycles; also, we have been able to recognise the presence of a similar warming phase in the early stages of the transition from glacial to interglacial age. Our analysis of the warming phase seems to indicate a universal triggering mechanism, what has been related with the possible existence of stochastic resonance [1,13, 21]. It has also been argued that a possible cause for the repetitive sequence of D/O events could be found in the change in the thermohaline Atlantic circulation [2,8,22,25]. However, a cause for this regular arrangement of cycles, together with a justification on the abruptness of the warming phase, is still absent in the scientific literature.”
In their work, at least 13 of the 24 D-O oscillations (indeed other workers suggest the same for them all), CO2 was not the agent provocateur of the warmings but served to ameliorate the relaxation back to the cold glacial state, something which might have import whenever we finally do reach the end Holocene. Instead of triggering the abrupt warmings it appears to function as somewhat of a climate “security blanket”, if you will.
Therefore in constructing the antithesis, and taking into consideration the precautionary principle, we are left to ponder if reducing CO2’s concentration in the late Holocene atmosphere might actually be the wrong thing to do. - Climate Change: Past, Present, and Future
Daniel Bailey at 13:59 PM on 5 October, 2010
Re: doug_bostrom (76)
Thanks, Doug. The graph, not found in the paper (nor can I locate it on the GISP2 website), must be what he was referring to.
The graph hardly has the resolution to make any claims about the Central Greenland location of the core during the LIA or the MWP, let alone any further extrapolation outside that area.
Maybe I can find it on Alley's website.
Re: scaddenp (77)
Nice hauling out the secret weapon!
The Yooper - Hockey stick is broken
gallopingcamel at 14:06 PM on 27 September, 2010
scaddenp, (From "Lies, Damn Lies & the IPCC)
My problem with MBH 08 & 09 plus the hundreds of subsequent papers and commentaries including those by my ex-colleagues such as Gabby Hegerl or distinguished statisticians such as Tamino is their ignorance of the historical record.
The first test of any paleo-climate reconstruction should be whether it portrays past climate in a plausible way. Any set of proxies that disagrees with history should immediately be discarded.
Specifically, I mean that at least the following warm periods should be seen:
Minoan, Roman (2), Medieval and Modern.
Cold periods should include:
Dark Ages and Little Ice Age.
For proxies that go back into pre-history, one would expect to see the Younger Dryas. While we don't have a true historic record of this there is a good archaeological record of the Clovis people.
You should be honest enough to recognize that MBH et seq. fail this test in dismal fashion, yet there are some proxies that portray the historical and even pre-historical (Younger Dryas) temperatures quite well. You don't have to believe they are correct but at least admit that they pass the initial acid test of being consistent with history and archeology.
The proxies I find credible are ice cores. As the historical record in the southern hemisphere is thin, one can only check a tiny part of the Antarctic ice core record against history. It is quite a different story in the northern hemisphere where we have the Greenland ice cores.
Here is a "ftp" link to Richard Alley's (2000) ice core data for central Greenland:
I downloaded this file and prepared a number of plots over different time periods. This is quite time consuming so you can get the same information from the following site and learn about the Eisenhower administration at the same time:
http://www.foresight.org/nanodot/?p=3553
Your comments will be appreciated as I plan to visit NOAA in Asheville, North Carolina in mid October to discuss this and related issues. - Global warming and the unstoppable 1500 year cycle
gallopingcamel at 13:46 PM on 21 September, 2010
thingdonta,
Your words shine like "...a good deed in a naughty world."
Merchant of Venice, (William Shakespeare).
1. OK, climate change is happening.
2. The atmosphere causes average temperatures to be ~33 Kelvin higher than without the atmosphere. Let's call that the "Greenhouse Effect".
3. CO2 has an effect on global temperatures but not enough to to explain the observed variations on any time scale.
What thingdonta says is totally vindicated by the Vostok ice core records but just for light relief here is Richard Alley's lesser known ice core data going back only 50,000 years for central Greenland. This data set shows the recent "Hockey Stick" but also the warm period that allowed Vikings to colonize Greenland and the subsequent cold period that destroyed their mini-civilization:
http://www.foresight.org/nanodot/?p=3553
For those who are inclined to doubt the Foresight Institute, you can make your own analysis by retrieving the raw data from NOAA:
ftp://ftp.ncdc.noaa.gov/pub/data/paleo/icecore/greenland/summit/gisp2/isotopes/gisp2_temp_accum_alley2000.txt - The Past and Future of the Greenland Ice Sheet
Berényi Péter at 06:03 AM on 22 August, 2010
#57 Peter Hogarth at 01:18 AM on 22 August, 2010
One of the points of this post is that there is plenty of evidence and peer reviewed research which shows that the Greenland Ice Sheet volume has varied in step with the NH high latitude temperature variations in the past, see Vinther 2009
Yes, no question about that. However, it is the rate of change we are talking about here.
I have copied Figure S2 b here from the Supplementary information to Vinther 2009.

As you can see depositional elevation over the Greenland ice sheet has decreased by 200 m during 8 millennia when both local air and sea surface temperatures were 2-3°C higher than today. That translates to a rate of -2.5 m/century. The area of the ice sheet is about 1.78×10⁶ km2. Therefore the century scale loss of ice volume was 4400 km3 what makes 4000 km3 meltwater. Surface area of all the seas is 3.6×10⁸ km2, therefore it implies an eustatic sea level rise at a rate of about 11 mm/century. Hardly alarming, even if we take into account that holocene melt rate was highly variable, for short periods it could have been 3-4 times the average.
Eight thousand years of ice sheet response is a bit better sample from a climatic point of view than a decade. You guys are making a fuss about weather noise. - The Past and Future of the Greenland Ice Sheet
Peter Hogarth at 02:24 AM on 22 August, 2010
Berényi Péter at 01:05 AM on 21 August, 2010
You state: “However, people here are denying both air and sea surface temperatures were considerably warmer in the Arctic during the Holocene Climatic Optimum than they are today just to make the present feeble warming unprecedented and alarming”
I do not think this is generally being denied, though we should quantify “considerably warmer”. The high resolution ice core data from Greenland and nearby (eg GISP2, NGRIP, Agassiz) is proxy evidence that Northern Greenland temperatures were up to 3 degrees warmer around 8000 years ago than the average for the 20th century, (your suggestion of regional variations is also validated by the evidence, eg Agassiz shows a more pronounced “Holocene Climactic Optimum”).

The Bednarski 1989 paper you cited, and many other more recent ones also provide convincing circumstantial evidence (such as driftwood deposits) that at least some of these coastal Arctic areas which are now ice bound were bounded by areas of open water for at least some periods since the last glacial. This is generally accepted and is consistent with the proxy temperature data.
The current global decadal temperature trend is upwards, and appears “amplified” in the high latitude NH. If the current or centennial trend is sustained as modeling suggests, Greenland temperatures will exceed post glacial Holocene temperatures in a relatively short timescale. The word “feeble” is perhaps inappropriate given the likely persistent nature of GHG forcing. The recent Arctic temperature rise is not unprecedented over geological timescales, but is highly significant compared to the past 2000 year proxy records (see Kaufman 2010 update and the zoomed in ice core record from Agassiz (Vinther 2009) and GISP2 (from Alley 2004 update).

It should be emphasized, that the orbital parameter forcing which is thought to have driven the gradual fall in NH temperatures since the post glacial temperature maximum is not global in effect, it is not clearly apparent in the deep sea sediment alkenone temperature proxy records for much of the rest of the globe (as is clear in Rimbu 2003) and is not apparent in the Antarctic ice core records.
The Greenland Ice Sheet mass is currently diminishing at an accelerating rate due to localized warm waters and warm currents transported from lower latitudes Hannah 2009, Di Iorio 2009, Straneo 2010, Rignot 2010 as well as recent rapidly warming Arctic air temperatures. The recent rapid change in positive forcing from increasing anthropogenic GHGs is a new factor not present in previous glaciation/deglaciation cycles. It is effectively a global effect (rather than a high latitude effect such as NH insolation) – which combines with the effects of other forcings. The oversimplistic point you make about higher relative NH insolation forcing levels in the past does not strictly hold.
Perhaps more importantly, the massive ice sheets that covered much of the NH in the last glacial period did melt (in most places completely) over the “deglaciation” time span, and we know rapid changes in temperature have been triggered by a combination of the slow change in solar forcing combined with positive feedbacks possibly from changes in the Atlantic Meridional Overturning Circulation and/or changes in GHG. This shows how sensitive our climate can be to proportionally small changes in forcing. I also do not expect the massive central Greenland ice sheet to vanish overnight, but the relatively rapid recent increased rate of loss is of legitimate concern and should not be belittled. - The Past and Future of the Greenland Ice Sheet
Rob Painting at 21:19 PM on 21 August, 2010
BP, the Stott graph shows SST cooling from 11 to 10 kyr BP onwards, whereas the Greenland ice core record has a thermal optimum between 8 to 6 kyr BP.

There is also evidence of the Northern coast of Greenland being free of sea ice between 8.5 to 6 kyr BP. See here beach ridges, striated boulders & marine sediment - The Past and Future of the Greenland Ice Sheet
Berényi Péter at 00:54 AM on 20 August, 2010
#11 chris at 02:25 AM on 1 August, 2010
it’s worth being a little more considered about the data on the progression of Greenland temperatures during the 20th century
You are right. Fortunately we have some data on past temperatures over Greenland. If you visit the NOAA Paleoclimatology page, you may find supporting data there for Kobashi et al. 2010 GISP2 1000-Year Ar-N2 Isotope Temperature Reconstruction.
There is also a nice paper on more than two centuries of instrumental temperature record in Greenland, directly from CRU.
JOURNAL OF GEOPHYSICAL RESEARCH, VOL. 111, D11105
doi:10.1029/2005JD006810, 2006
Extending Greenland temperature records into the late eighteenth century
B. M. Vinther, K. K. Andersen, P. D. Jones, K. R. Briffa, and J. Cappelen
Received 24 October 2005; revised 11 January 2006; accepted 28 February 2006; published 6 June 2006.
They also have supporting data published, as all such studies should.
The ice core reconstruction is from Greenland summit and covers the years from 1000 AD. to 1993 AD., while Vinther at al. have a full reconstruction of monthly temperatures along the south and west coast of Greenland (Ilulissat, Nuuk & Qaqortoq) from 1852 to 2005 based on instrumental record.
I have converted both datasets to temperature anomalies and have calculated a 11 year running mean for the latter one to match the lower resolution of ice core data. Here it is:

The match between the ice core proxy and the instrumental record is reasonably good for the overlapping period. Part of the difference may be due to the distance between the two sites (up to 1000 km).
We can see temperatures over Greenland in the 1930s were a bit higher than today. They were even higher around 1140.
If we have a broader look, to the entire holocene, we can see temperatures were up to 3°C warmer than today several times, with somewhat less snow accumulation.

Still, the Greenland ice sheet has not collapsed and the sea never flooded London. - Part Three: Response to Goddard
chris at 07:57 AM on 21 July, 2010
HumanityRules at 01:58 AM on 21 July, 2010
Yes Kobashi et al is interesting. However it's worth noting that there’s a big difference between what happens in Greenland (especially on the ice sheet summit at GISP2 where Kobashi et al are sampling), and the Arctic as a whole. So for example, while it’s true that the evidence suggests that Greenland was warm in the 30’s and 40’s, the evidence also strongly indicates that (i) the Arctic as a whole is a good bit warmer now than during the 40’s, and (ii) that Arctic sea ice retreat was minimal then, and much more significant now. Note that you can’t tell from Kobashi et al’s data how GISP2 surface temperatures in 1940 compare to current Greenland summit temperatures since their data only goes to 1950; likewise you can't tell (from their data anyhow!) the relation of current Greenland warming to natural variability.
Other than that, there’s no question that there are quasiperiodic natural fluctuations (especially involving volcanic eruptions, and solar and ocean current variation) in Greenland/Arctic temperatures but these are now “piggy-backing” on a pretty large rising anthropogenic temperature trend. Here’s some detail:
(i) A recent multiproxy temperature reconstruction (Kaufmann et al, 2009) indicates that the last decade was the warmest in the Arctic for the last 2000 years, and 20th century warming has strongly reversed a long term (and extremely slow 0.22 oC per 1000 years) cooling trend. Contemporary temperature measures indicate that the Arctic as a whole is warmer now than during the mid-20th century, even if Greenland itself may be not much warmer (and accordingly Arctic sea ice retreat was likely minimal during the time of the apparent Greenland summit temperature max).
(ii) The Greenland ice sheet is very sensitive to volcanic (and also solar) variability and Kobashi et al highlight these as well as ocean current variability as the likely source of quasiperiodic fluctuations. This interpretation is quite similar to a related study of Greenland temperature (Box et al, 2009) which also found that Greenland was around as warm (and possibly a tad warmer) during 1930-40 than now. We should also consider the possible role of black carbon [e.g. McConnell et al (2007)] which has its largest warming effect when it is deposited on snow/ice. Black carbon can be directly identified in Greenland cores and was deposited at high levels during the 30’s and 40’s. This, together with the recovery of temperatures suppressed by high volcanic activity from the late 19th century through the early part of the 20th century, are likely contributions to the observations of enhanced Greenland warming, in an Arctic that wasn’t as warm as now.
(iii) So one does need to be careful with attributing temperature variations at the summit of the Greenland ice sheet. These are not necessarily related to phenomena that influence Arctic temperatures overall. Obviously in the present widescale warming both Greenland and the Arctic as a whole are warming. One of the potentially concerning observations of Box et al is that Greenland tends to retain a phase relationship with overall N. hemispheric warming, such that it eventually rises to a temperature anomaly around 1.6 times that of the N. hemisphere ("NH polar amplification"). It’s way below that now, and if this relationship holds up Greenland has got quite a lot of warming (1-1.5 oC) just to “catch up”.
Kaufman DS, et al. (2009) Recent warming reverses long-term Arctic cooling. Science 325:1236–1238.
Box, J. E.et al (2009) Greenland Ice Sheet Surface Air Temperature Variability: 1840–2007. Journal of Climate, 22, 4029-4049.
McConnell, J.R. et al. (2007) 20th-Century Industrial Black Carbon Emissions Altered Arctic Climate Forcing Science 317, 1381-1384. - Hockey sticks, 'unprecedented warming' and past climate change
chris at 00:29 AM on 16 December, 2009
Figure 1 is pretty misleading -
Inspection of Alley's data in the NCDC archive [*] shows that the most recent temperature data point for the GISP 2 core is for around 100 years before 2000.
According to the temperature reconstruction from the ice sheet this temperature was -31.6 oC.
In the intervening period, the Greenland ice sheet temperature (2 metre surface height) has risen by around 1.5 oC, averaged over the whole ice sheet [**]. It’s likely that the ice sheet summit area where GISP 2 is, has warmed more than this (NASA GISS analysis puts the warming at the Grenland summit where the GISP 2 core was drilled to more than 2 oC [***]
So if we are comparing like with like [i.e. the temperature at the Greenland ice sheet summit at GISP 2 at the “height” of the MWP (-30.5 oC), and the temperature at the Greenland ice sheet summit at GISP 2 at the turn of the 20th century (-31.6 oC), we should really consider the temperature change since then at the same location. This is at least 1.5 oC warmer and likely at least 2 oC warmer.
So current temperatures at the Greenland summit at the GISP 2 site are warmer than for the height of the MWP (by 0.5 to 1.0 oC or more) according to the Alley’s data, and taking account of the temperature record of the last 100 years.
[*] ftp://ftp.ncdc.noaa.gov/pub/data/...gisp2_temp_accum_alley2000.txt
[**]
Box JE et al. (2009) Greenland Ice Sheet Surface Air Temperature Variability: 1840-2007 J. Climate 22, 4029-4049
[***]
http://data.giss.nasa.gov/gistemp/maps/
(make your own map – e.g. compare the current (5 year temperature average to the 5 year temperature average around the start of the 20th century) - High CO2 in the past, Part 2
Riccardo at 19:24 PM on 4 November, 2009
Steve L,
concerning time resolution, it should be noted that there are ice cores with annual or sub-annual resolution for the last 100 thousands years (GISP2 and NGRIP ice cores in Greenland). The resolution gets worst going back in time but at least from the onset of the ice ages cycles it stays below a few centuries or less, depending on the specific site.
But anyway, the real problem with this skeptic argument is physics. What should be the plausible mechnism for a rapid emission of CO2 of the order of a few decades? And also, to not be detected the CO2 must be reabsorbed by the climate system in a few decades as well, while we know, instead, that it stays in the atmosphere much longer.
Here we notice a general attitude of the skeptics, immagine a mechanism which can not be ruled out a priori but that is far from being plausible. The trick is that in this way the burden of the proof stays upon "AGW theorists". It's far easier to immagine a weird hypotesis than prove it's unplausible or plain wrong. - Climate time lag
Mizimi at 05:00 AM on 13 July, 2009
"In the late 1980s and early 1990s, rapid and large climate changes had been identified in Full Glacial sediments from the North Atlantic (Figure 9; Heinrich 1988; Bond et al. 1992). The Greenland ice core also showed evidence of similar variability (Dansgaard et al. 1993). These results convinced many people of the importance of abrupt climate changes (Weart 2003); that is,the climate may change as a step function. Efforts were made to relate these results to climate “episodes” that had been known for many years, such as the Younger Dryas Period (e.g. Wright 1989; Broecker et al. 1988). However, much of this work was done in the North Atlantic region,where large outbreaks of icebergs and pack ice could amplify the actual climate changes.
Subsequently, climate variability of this timescale was also identified in postglacial sediments from some ocean cores in the North Atlantic, and it was suggested that Holocene climates varied significantly at a periodicity of roughly 1500 years during both interglacial and glacial times, as well as during the transition between them (Figure 9; Bond et al., 1997, 2001). This has important consequences for the identification of possible causes. The spatial distribution of the changes must be known, and this has occupied many people for the last decade.
We therefore suggest that the dominant millennial-scale climate frequency in the Holocene is not 1500 years, but rather circa 1,000 ± 100 years.
This circa 1,000 ±100-year periodicity actually matches better with the record of 14C variations in the atmosphere and 10Be. Cross-spectral analysis of the North Atlantic IRD marine record and cosmogenic nuclide records (14C and 10Be; proxies for solar variability and ocean ventilation changes) shows power at 300-500 and 900 to 1100-year frequency bands during the past 12,000 years (Bond et al., 2001). Hughen et al. (2000) suggest that climate variations such as the Younger Dryas are synchronous with atmospheric 14C changes, interpreted by the authors as ocean circulation changes. This suggests that these climate transitions are associated with major changes in the carbon cycle (Kutzbach notes Figure 19; Stuiver et al. 1995). Therefore it is possible that a weak periodic solar and/or ocean forcing in frequency bands of 300-500 and 900- 1100 years may be the dominant forcing during the Holocene when ice-sheets are less significant
components of the climate system. The dominant ca 1500-year periodic signal during glacial regimes could have an internal origin and could explain why this periodicity does not show up in the 14C nor the GISP2 18O record of the past 12000 years (Stuiver et al.1995; Schulz and Paul 2002). Although a ca 1500-year periodic signal has been observed in some marine and terrestrial
records (Bianchi and McCave 1999, Hu et al. 2003), we have argued above that individual records may simply be lacking some particular warming or cooling event."
"Millennial-scale climate variations in the Holocene "
by K Gajewski explores the apparent periodicity of climate changes ..the 1500year cycle referred to above.
Climate Variabilityand Change Past, Present and Future
Sorry about the address!! It gives some interesting views on 'step' changes in climate during the holocene period. - Do cosmic rays cause clouds?
m_b at 23:47 PM on 25 August, 2008
Terry Sloan is careful to make clear that they have never said that there is no connection between cosmic rays and cloud formation. He just believes it's not the whole story when explaining cloud formation.
Even Sloan believes the strong negative correlation with historical temperature reconstruction's vs radionuclides and radiocarbon in ice cores is interesting and requires further investigation.
Personally I can't escape the logic that these beryllium-10 and radiocarbon ice deposits (formed from GCR interactions in our atmosphere), indicate that GCR's either directly, or indirectly have some effect, or show an unknown effect on our climate. That GCR's come from outside our planet, dictates logically to me that climate is strongly influenced by external factors.
When I look at the massive sudden drops, and sudden increases in temperature from the GISP2 Greenland Ice Core data at the start, and the end of the Younger Dryas (only approx 12,000 years ago), I am left speechless... these huge changes in temperature take place in mere decades, the extreme being a 5 deg change in just three years!
I certainly need something better to explain these sudden cooling events, and more importantly, the sudden warming events, than Co2.
On a side issue, periods in our past showing these large Be-10 levels, formed from CR's, are increasingly being pointed to as a possible explanation for massive globalised Gene duplication events appearing at the same time, and postulated to be one of (if not the main) driver of evolution.


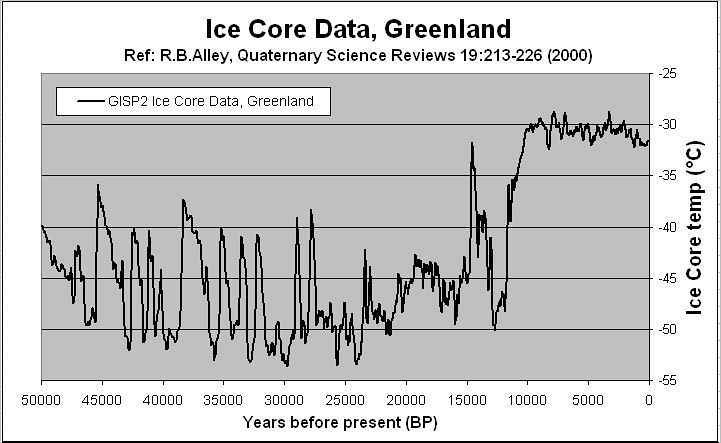
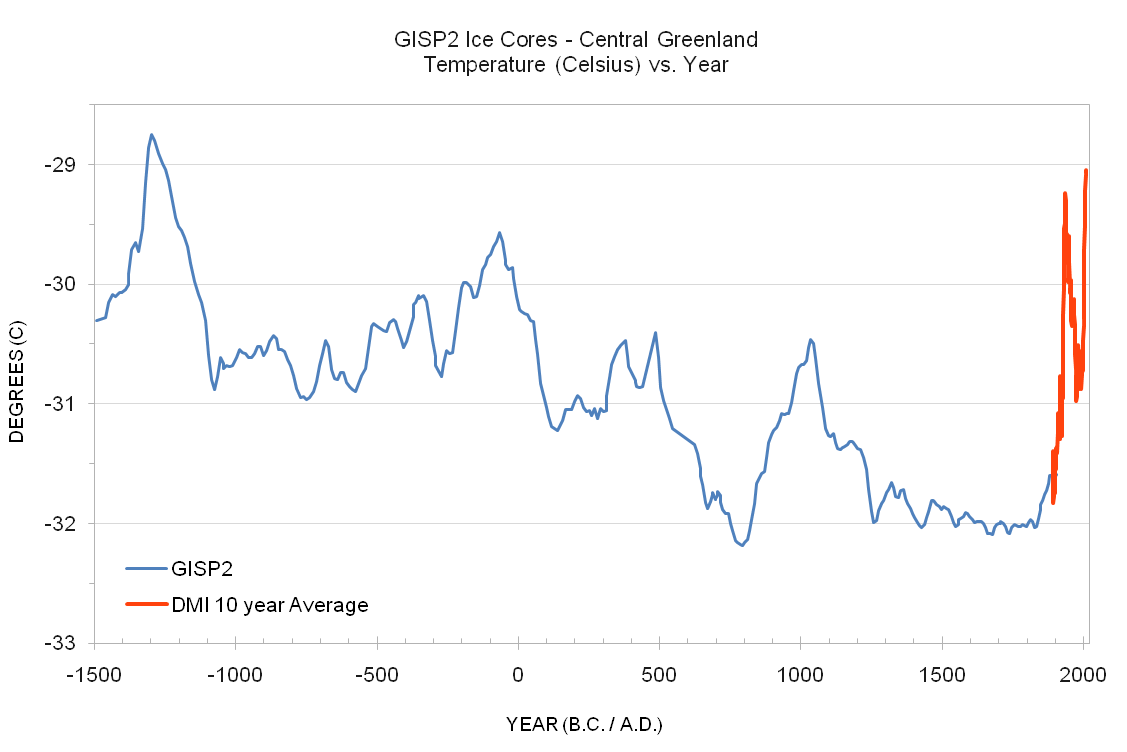
THE ESCALATOR

(free to republish)