


 Arguments


Confusing Greenland warming vs global warming
What the science says...
This argument uses temperatures from the top of the Greenland ice sheet. This data ends in 1855, long before modern global warming began. It also reflects regional Greenland warming, not global warming.
Climate Myth...
Most of the last 10,000 years were warmer
Even if the warming were as big as the IPCC imagines, it would not be as dangerous as Mr. Brown suggests. After all, recent research suggests that some 9,100 of the past 10,500 years were warmer than the present by up to 3 Celsius degrees: yet here we all are. (Christopher Monckton)
This argument is based on the work of Don Easterbrook who relies on temperatures at the top of the Greenland ice sheet as a proxy for global temperatures. That’s a fatal flaw, before we even begin to examine the use of the ice core data. A single regional record cannot stand in for the global record — local variability will be higher than the global, plus we have evidence that Antarctic temperatures swing in the opposite direction to Arctic changes. Richard Alley discussed that in some detail at Dot Earth last year, and it’s well worth reading his comments. Easterbrook, however, is content to ignore someone who has worked in this field, and relies entirely on Greenland data to make his case.
Most of the past 10,000 [years] have been warmer than the present. Figure 4 shows temperatures from the GISP2 Greenland ice core. With the exception of a brief warm period about 8,200 years ago, the entire period from 1,500 to 10,500 years ago was significantly warmer than present.
This is Easterbrook’s Fig 4:
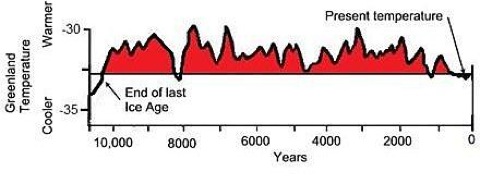
It’s a graph he’s used before, in various forms, almost certainly copied and altered from the original (click image below to see source: the NOAA web page for Richard Alley’s 2000 paper The Younger Dryas cold interval as viewed from central Greenland, though DE credits it as “Modified from Cuffy and Clow, 1997″, misspelling Kurt Cuffey’s name in the process:

Easterbrook continues:
Another graph of temperatures from the Greenland ice core for the past 10,000 years is shown in Figure 5. It shows essentially the same temperatures as Cuffy and Clow (1997) but with somewhat greater detail. What both of these temperature curves show is that virtually all of the past 10,000 years has been warmer than the present.
This is his Fig 5:
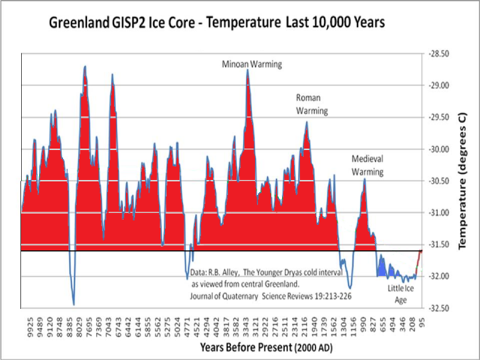
Easterbrook plots the temperature data from the GISP2 core, as archived here. Easterbrook defines “present” as the year 2000. However, the GISP2 “present” follows a common paleoclimate convention and is actually 1950. The first data point in the file is at 95 years BP. This would make 95 years BP 1855 — a full 155 years ago, long before any other global temperature record shows any modern warming. In order to make absolutely sure of my dates, I emailed Richard Alley, and he confirmed that the GISP2 “present” is 1950, and that the most recent temperature in the GISP2 series is therefore 1855.
This is Easterbrook’s main sleight of hand. He wants to present a regional proxy for temperature from 155 years ago as somehow indicative of present global temperatures. The depths of his misunderstanding are made clear in a response he gave to a request from the German EIKE forum to clarify why he was representing 1905 (wrongly, in two senses) as the present. Here’s what he had to say:
The contention that the ice core only reaches 1905 is a complete lie (not unusual for AGW people). The top of the core is accurately dated by annual dust layers at 1987. There has been no significant warming from 1987 to the present, so the top of the core is representative of the present day climate in Greenland.
Unfortunately for Don, the first data point in the temperature series he’s relying on is not from the “top of the core”, it’s from layers dated to 1855. The reason is straightforward enough — it takes decades for snow to consolidate into ice.
And so to an interesting question. What has happened to temperatures at the top of Greenland ice sheet since 1855? Jason Box is one of the most prominent scientists working on Greenland and he has a recent paper reconstructing Greenland temperatures for the period 1840-2007 (Box, Jason E., Lei Yang, David H. Bromwich, Le-Sheng Bai, 2009: Greenland Ice Sheet Surface Air Temperature Variability: 1840–2007. J. Climate, 22, 4029–4049. doi: 10.1175/2009JCLI2816.1). He was kind enough to supply me with a temperature reconstruction for the GRIP drilling site — 28 km from GISP2. This is what the annual average temperature record looks like (click for bigger version):

I’ve added lines showing the average temperatures for the 1850s (blue) and the last 10 years (red), and the difference between those is a warming of 1.44ºC. I’ve also added the two most recent GISP2 temperature data points (for 1847 and 1855, red crosses). It’s obvious that the GRIP site is warmer than GISP2 (at Summit Camp). The difference is estimated to be 0.9ºC on the annual average (Box, pers comm).
Let’s have ago at reconstructing Easterbrook’s Fig 5, covering the last 10,000 years of GISP2 data. It looks like this (click for bigger version):
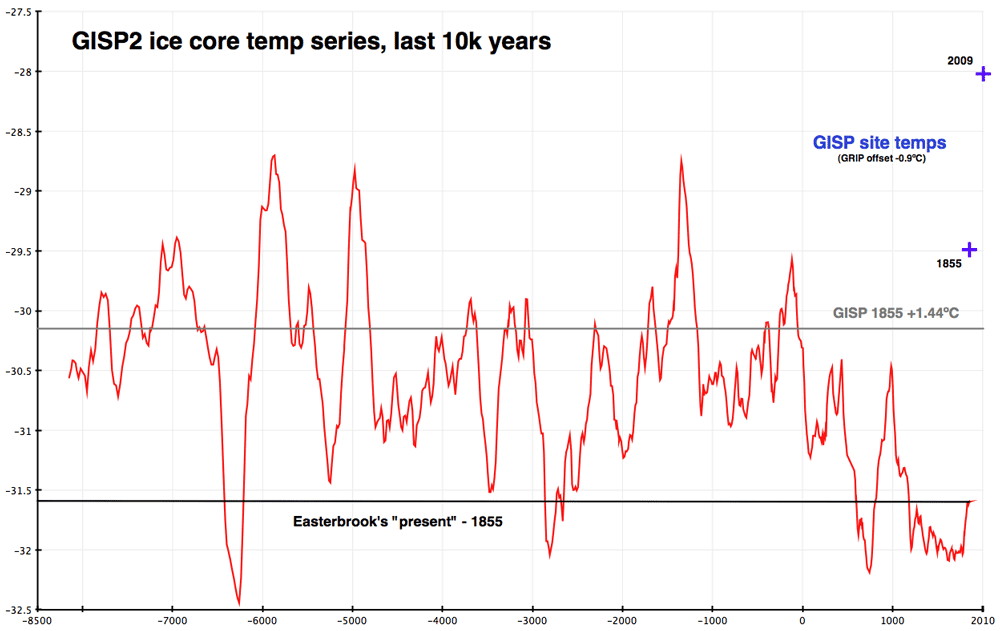
The GISP2 series — the red line — appears to be identical to Easterbrook’s version. The bottom black line shows his 1855 “present”, and it intersects the red line in the same places as his chart. I’ve added a grey line based on the +1.44ºC quantum calculated from the GRIP temperature data, and two blue crosses, which show the GISP2 site temperatures inferred from adjusted GRIP data for 1855 and 2009.
Two things are immediately apparent. If we make allowance for local warming over the last 155 years, Easterbrook’s claim that “most of the past 10,000 [years] have been warmer than the present” is not true for central Greenland, let alone the global record. It’s also clear that there is a mismatch between the temperature reconstructions and the ice core record. The two blue crosses on the chart show the GISP site temperatures (adjusted from GRIP data) for 1855 and 2009. It’s clear there is a calibration issue between the long term proxy (based on ∂18O measurement) and recent direct measurement of temperatures on the Greenland ice sheet. How that might be resolved is an interesting question, but not directly relevant to the point at issue — which is what Don Easterbrook is trying to show. Here’s his conclusion:
So where do the 1934/1998/2010 warm years rank in the long-term list of warm years? Of the past 10,500 years, 9,100 were warmer than 1934/1998/2010. Thus, regardless of which year ( 1934, 1998, or 2010) turns out to be the warmest of the past century, that year will rank number 9,099 in the long-term list. The climate has been warming slowly since the Little Ice Age (Fig. 5), but it has quite a ways to go yet before reaching the temperature levels that persisted for nearly all of the past 10,500 years. It’s really much to do about nothing.
1855 — Easterbrook’s “present” — was not warmer than 1934, 1998 or 2010 in Greenland, let alone around the world. His claim that 9,100 out of the last 10,500 years were warmer than recent peak years is false, based on a misunderstanding or misrepresentation of data.
The last word goes to Richard Alley, who points out that however interesting the study of past climate may be, it doesn’t help us where we’re heading:
"Whether temperatures have been warmer or colder in the past is largely irrelevant to the impacts of the ongoing warming. If you don’t care about humans and the other species here, global warming may not be all that important; nature has caused warmer and colder times in the past, and life survived. But, those warmer and colder times did not come when there were almost seven billion people living as we do. The best science says that if our warming becomes large, its influences on us will be primarily negative, and the temperature of the Holocene or the Cretaceous has no bearing on that. Furthermore, the existence of warmer and colder times in the past does not remove our fingerprints from the current warming, any more than the existence of natural fires would remove an arsonist’s fingerprints from a can of flammable liquid. If anything, nature has been pushing to cool the climate over the last few decades, but warming has occurred.
See also: MT at Only In It For The Gold. My thanks to Richard Alley and Jason Box for their rapid response to my questions.
NOTE: This rebuttal is an edited version of a blog post first published by Gareth Renowden at Hot Topic.
Intermediate rebuttal written by Gareth
Update August 2015:
Here is a related lecture-video from Denial101x - Making Sense of Climate Science Denial
Last updated on 4 August 2015 by MichaelK. View Archives


Here is my very crude attempt to recreate the graph to modern times, and I would very much like to hear what mistakes I have done along the way.
FWIW I'm not a scientist, so there...
Anyway, the reason for my effort is that I have for some time been a bit annoyed that the current temperature (2009) grafted on the last graph in the text is not directly from the GISP/dome, rather it is derived from GRIP. This IMO makes it a bit weaker as a argument when presented to a layman/'skeptic' even if it does have a sound scientific methodology behind it.
So after some hunting I found some near surface temp measurements here; from the summit, which AFAIK is where GISP2 was drilled. The station numbers are documented here.
I threw the data in a spreadsheet and took the average from (after converting each timepoint to decimal) 2005.813 - 2011.813, which gave me -28.3°C. Incidently, and not necessarily meaningfully, the max temperature of the last 3 years are all above 0°C and 'rising'.
Anyhow. I take that average and add it as a data point in to the Alley record linked in the text as for 2008 and get the following graph:
The trend is for Alley data only (-9000 - 1880), just as reference.
I'm sure I have made some grave errors in the process, and would appreciate constructive input. Thanks.
Lanfear @20, the GRIP and GISP2 icecores where both drilled at the Summit. Hence the difference in temperature as measured at GRIP is a reasonable proxie for the difference at GISP2.
Your chart shows the difference between the absolute temperature in 1895 as measured using the GISP2 ice core proxy, and the absolute temperature as measured at a nearby location using the thermometers in the 2000s, ie, the difference between the end of the GISP2 icecore and the higher of the two blue crosses in last graph in the original post. However, as can be seen in the second last graph, GISP2 temperatures are cold relative to GRIP site temperatures in 1895, so it is far better to take the anomaly as is done in the OP or in the second graph @15. Even that should be taken as indicative only, rather than an exact measure.
Tom Curtis@21
Yes, I agree with you that to properly compare (or splice in this case) apples with apples, using GRIP to project the temperature into current time.
So, is the problem (with my attempt at extending the GISP2) to modern time, that GISP2 is showing a different temperature than what the AWS a the summit is producing, perhaps the actual surface (or should that be the firn) temperature vs. 2m above?
And to get my facts correct, the proper splicing shows that the current temperature is higher than any point in the MCA, but we have some spikes going above current temperature BCE?
PS. Is there a reason why this article does not show up in the argument list?
Lanfear @22, AWS?
Tom Curtis@23
AWS - Automated Weather Station. More information is in the last link of my message @20.
Lanfear @25, I apologize for the delayed response. It is with good purpose, however. I have had the good fortune of rediscovering a recent paper (Kobaski et al 2011) showing a reconstruction of GISP2 data using a different method from Alley et al (2000). That paper, based on the same ice core as used by Alley et al, carries the reconstruction through to about 1990, something they are able to do because of a higher resolution sampling. Further, they directly compare their reconstruction to the Box 2009 reconstruction of temperatures since 1840 that is used in the main post; and with the AWS temperature record.
The main post here uses the Box data under the assumption that temperature differences determined by the same method are likely to be correct in terms of relative position, but when compared to records determined by other methods there may be biases (possibly unknown) which distort the result. Based on this principle, it adds the temperature difference between the decadal average of 1850-59 (corresponding to the end of the Alley et al temperature proxy) and 2000-09 (the present) to the Alley proxy. Decadal differences are used because of the low resolution of the proxy.
Kobaski et al discuss the issue directly, saying:
So you are correct that the cause of the difference is the difference between firn temperature and the surface air temperature.
As to the question about GISP2 temperatures and the MWP, that is more complex. The Kobashi 2011 reconstruction shows greater variability in temperature due to its higher resolution. As a result it shows some temperatues exceeding modern values in the MWP. It also shows a significant peak in temperatures around 700 AD which significantly exceed modern values, although that predates the traditional dating of the MWP:
(Kobashi et al 2011, figure 1. Click on image for higher resolution.)
I have attempted to overlay the Alley 2000 proxy data with the Kobaski 2011 reconstruction for comparison. Doing so clearly shows the difference in resolution. It shows some differences in the result as well. Most notably, the 700 AD peak in Kobashi 2011 corresponds to a trough in Alley 2000. I am certainly not expert enough to say which is likely to be more accurate where the two disagree.
Despite the differences, the curves track each other reasonably closely closely to show. The match should put paid to any doubts that the termination of Alley 2000 is around 1855, and that the 1855 temperature in Alley et al is approximately 1.5 C lower than modern temperatures at the same location:
(Alley 2000 overlayed with Kobaski 2011. Alignment was achieved based on the axis. Click on image for higher resolution.)