Climate Science Glossary

Term Lookup

Enter a term in the search box to find its definition.

Settings

Use the controls in the far right panel to increase or decrease the number of terms automatically displayed (or to completely turn that feature off).

Term Lookup

Settings


All IPCC definitions taken from Climate Change 2007: The Physical Science Basis. Working Group I Contribution to the Fourth Assessment Report of the Intergovernmental Panel on Climate Change, Annex I, Glossary, pp. 941-954. Cambridge University Press.

Home Arguments Software Resources Comments The Consensus Project Translations About Support

Twitter Facebook YouTube Mastodon MeWe

RSS Posts RSS Comments Email Subscribe


Climate's changed before
It's the sun
It's not bad
There is no consensus
It's cooling
Models are unreliable
Temp record is unreliable
Animals and plants can adapt
It hasn't warmed since 1998
Antarctica is gaining ice
View All Arguments...


Username
Password
New? Register here
Forgot your password?

Latest Posts

Archives

Monckton Myth #10: Warming in the Pipeline

Posted on 11 February 2011 by dana1981

Monckton Myths (200 x 70 pixels)As part of an ongoing series looking at Christopher Monckton’s response to Mike Steketee and as a new addition to the Monckton Myths, this post examines Monckton’s arguments about the amount of warming remaining "in the pipeline" from the CO2 we've already emitted.  Monckton's point #23 in response to Steketee is mainly a misunderstanding of Steketee's argument:

"Even if the world achieved what so far has proved beyond it - a mechanism to stabilise greenhouse emissions at 450 parts per million of CO2 - global temperatures still will rise by an estimated 2C"

Monckton responded by saying

"Just 0.7 C° of warmer weather is still to come, at equilibrium."

Monckton is Correct!  So is Steketee

In actuality, both are essentially correct on this point.  As Tim Lambert has noted, Monckton is misunderstanding Steketee's point (which to be fair, is not phrased very precisely), which is that if atmospheric CO2 reaches 450 ppm in the atmosphere, at equilibrium the planet's average temperature will warm 2°C above pre-industrial levels.  As discussed in the Advanced "CO2 effect is weak" rebuttal, the equilibrium change in surface temperature is calculated using the following formula:

dT = ?*5.35*ln(C/Co)

Where 'dT' is the change in the Earth's average surface temperature at equilibrium, '?' is the climate sensitivity, usually with units in Kelvin or degrees Celsius per Watts per square meter (°C/[W/m2]), 'C' is the concentration of atmospheric CO2, and 'Co' is the reference CO2 concentration.  So if we want to know the equilibrium temperature change in this scenario, we simply plug in the appropriate values (the  most likely climate sensitivity value is approximately 0.8°C/(W/m2):

dT = 0.8*5.35*ln(450/280) = 2°C

Monckton, on the other hand, is calculating how much surface warming remains "in the pipeline" from the CO2 we've already emitted, due to the thermal lag of warming the oceans, and the fact that there is still a planetary energy imbalance.  We can calculate this by instead plugging in the current CO2 concentration (390 ppm) into the formula above:

dT = 0.8*5.35*ln(390/280) = 1.4°C

Since the surface air has warmed about 0.8°C above pre-industrial levels thus far, there remains approximately 0.6°C warming "in the pipeline" from the CO2 we've emitted to this point, roughly consistent with Monckton's calculations (0.7°C).

So to this point, aside from a misunderstanding as to what Steketee was arguing, we're all in agreement! 

All Good Things Must Come to an End

Unfortunately, Monckton doesn't quit while he's ahead, and continues:

"However, various climate extremists have published papers saying that equilibrium warming will not occur for 1000 years....The IPCC itself only expects about 57% of equilibrium warming to occur by 2100....Bottom line, then: by 2100 we can expect not 2 C° of further “global warming” as a result of our emissions so far, but 0.4 C° at most."

Did you spot the glaring error in this argument?  Monckton has simply multiplied the 0.7°C warming he estimated "in the pipeline" by 0.57.  Of course, the 0.7°C in the pipeline is based on the current atmospheric CO2 concentration, not the concentration in 2100!  Monckton appears to be confusing the equilibrium temperature we will eventually reach based on today's CO2 levels with the temperature the planet will reach in the year 2100, which will depend on atmospheric CO2 changes between now and then.

As long as the atmospheric CO2 concentration doesn't increase over the next 90 years, Monckton is correct.  Making that happen, however, would require a radically rapid reduction in human CO2 emissions.  It would basically require that everyone everywhere stops using electricity and driving cars immediately.  Simply put, it's completely unrealistic, and Monckton is wrong.  The fact that we're already committed to 1.4°C of surface warming highlights how important it is to start reducing our greenhouse gas emissions immediately.

IPCC Reality is not Pretty

Monckton has also made a questionable statement about the equilibrium warming to occur by 2100, according to the IPCC.  Let's examine IPCC Scenarios A1F1, A2, and B1, which correspond to atmospheric CO2 levels of approximately 950, 850, and 600 ppm in 2100.  Here are the corresponding IPCC projected surface temperature changes:


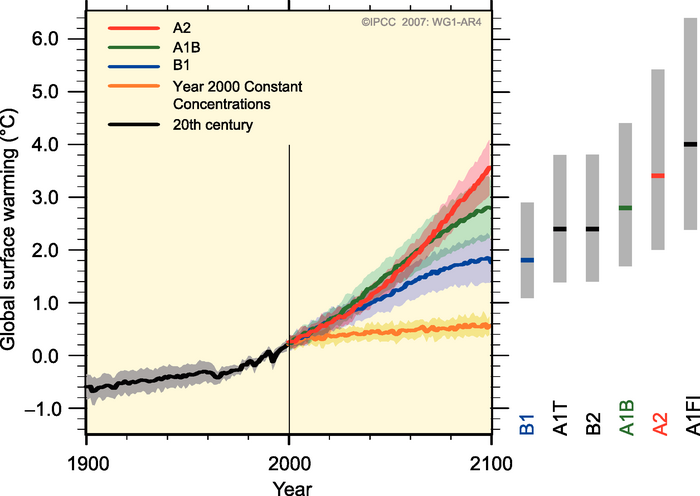
Figure 1:  Projected global surface warming from 2000 to 2100 in various IPCC scenarios

We can estimate the equilibrium surface temperature changes (?Teq) in each scenario by plugging the atmospheric CO2 levels into the formulas above, and compare to the IPCC projected temperature change by 2100:

Table 1: Percent of Equilibrium Temperature Change by 2100 in 3 IPCC Scenarios


As you can see, according to the IPCC, for these three emissions scenarios, between 75% and 90% of the equilibrium warming will occur by 2100.  These numbers are consistent with the IPCC report itself (Chapter 10 of WGI), which estimates that approximately 80% of the equilibrium warming will be realized by 2100. 

Monckton's claim of 57% of equilibrium warming being realized by 2100 appears to be inconsistent with the actual IPCC projections.  It's worth noting that CO2 isn't the only factor to change in these scenarios.  For example, global methane emissions rise much more in Scenarios A1F1 and A2 than B1, which helps explain the relatively smaller fraction of equilibrium warming experienced in Scenario B1 by 2100.  It's also worth noting that equilibrium temperature change calculations are only realized when we manage to stabilize atmospheric CO2 concentrations.

Long-Term Climate Sensitivity

One final flaw in Monckton's argument is that the IPCC equilibrium climate sensitivity value is based on relatively fast-acting feedbacks.  A 2008 study led by James Hansen found that climate sensitivity to "fast feedback processes" for a doubling of atmospheric CO2 is 3°C, but when accounting for longer-term feedbacks (such as ice sheet disintegration, vegetation migration, and greenhouse gas release from soils, tundra or ocean), if atmospheric CO2 remains at the doubled level, the sensitivity increases to 6°C based on paleoclimatic (historical climate) data.  This long-term climate sensitivity is more appropriate in the timeframe (1,000+ years) Monckton references.

So Close, Yet Still So Wrong

Ultimately, while Monckton started out well in his calculation of the amount of "warming in the pipeline", he proceeded to make a fatal error by assuming that atmospheric CO2 levels will not increase over the next 90 years.  This is a particularly significant error considering that Monckton would prefer that we continue in a business-as-usual scenario which will lead to atmospheric CO2 levels more than doubling over the next 90 years.

0 0

Printable Version  |  Link to this page

Comments

Comments 1 to 26:

  1. The 'in the pipeline' phrase is often misused to suggest it is stored in the oceans (well by the less well educated contrairians), curious to see Monckton effectively argue this as thermal inertia. I am also fairly sure part of the "in the pipeline" is assumed to be non CO2 positive forcings masked by atmospheric particles such as sulphates and the like, so in theory as we clean our emissions while we lose positive forcing from black carbon we decrease the negative forcing from particulate pollution (I am wandering a touch here to be fair)
    0 0
  2. Text just above the figure should refer to B1, not B2. The 'warming in the pipeline' idea always seemed to me too open to interpretation. It is the 'CO2' in the pipeline that is the problem.
    0 0
  3. I used the term "in the pipeline" simply because it's a commonly-used phrase (but true that it's often misunderstood). It simply refers to the unrealized warming from the CO2 we've already emitted, and is unrealized because of the thermal inertia of the oceans. enSKog - good catch, I corrected the reference to Scenario B1.
    0 0
  4. I personally would be interested in knowing where Monckton came up with the 57% figure - the IPCC doesn't seem to use any numbers similar to that at all: http://www.ipcc.ch/publications_and_data/ar4/wg1/en/spmsspm-projections-of.html Unless they cited such 'warming in the pipeline' figures in another section. They do discuss here though that even if 2000 levels were kept, we'd expect a temperature increase of ~0.3-0.9 (likely 0.6) degrees Celsius by 2100. Monckton's claim of 0.4˚C at most is barely defensible within that range - the 0.4˚C part at least, not the "at most." Good article Dana, as always; one error though, just grammatical: second to last paragraph, I think "fod" should be "for."
    0 0
    Moderator Response: [DB] Fixed text; thanks!
  5. Good :) A thought came to me, and perhaps this is where he gets the 57% figure - about 1.4˚C is expected from a climate sensitivity of 3˚C and current CO2 levels, and 0.8˚C has been realized. Guess what 8/14 is?
    0 0
  6. RE: dorlomin "The 'in the pipeline' phrase is often misused to suggest it is stored in the oceans (well by the less well educated contrairians), . . ." I take it that you believe Kevin Trenberth to be among the, 'less well educated contrairians'? Or is it just the phrase, 'in the pipeline' that should not be used to define the theory of stored heat in the Oceans? And Kevin is talking about vast amounts of heat being stored in the Oceans (albeit yet to be detected/found). Kind Regards, -Peter
    0 0
  7. barnErubble - The phrase "in the pipeline" has been an issue, because of the easy misinterpretation. See the terminology discussion on the Case Study of a Climate Scientist Skeptic thread. There is warming that has occurred and the measurement thereof (Trenberth has been concerned about poor measurements of ocean temperatures, in particular deep ocean temps and calibration issues - while fairly recent, and with ongoing calibration issues, they don't match what we expect in all respects). It seems possible that much of the energy is in the deep ocean, but that's an issue of ongoing investigation. And there is unrealized warming; the warming that has to happen to remove the current radiative imbalance. The latter is what is normally referred to as "in the pipeline" - it's not heating that is hiding under a bush somewhere, but rather hasn't occurred yet but will unless the radiative imbalance is removed. It's heat accumulating in the rather large thermal inertia of the oceans - it takes a long time for a small imbalance to warm a large ocean. The Earth has to heat by a certain amount for IR leaving the atmosphere to equal the energy coming in. And of course, if we continue to increase the radiative imbalance with CO2, global warming will continue to play catch-up, and continue to rise.
    0 0
  8. Monckton's personal climate science is also being challenged by skeptics.
    0 0
  9. @ #8-that was a very interesting article. It seems that the Denialist Cult's "Broad Church" approach to membership is beginning to come back & haunt them. After all, how else can we explain Monckton being attacked-by his own camp-for going "too far" & simultaneously "not going far enough". Oh, the Schaudenfraude of this moment is too great to pass up :)!
    0 0
  10. Could one not make the same delayed response argument for solar activity that still remains above the levels seen at any time in the first 50 years of the 20th century. Why has this rise in solar levels ( even though they are lower now than they were 20 years ago) not played a part in the rise of temperatures over the last 200 years?
    0 0
  11. @ Mozart-all I can suggest is that you look at a comparison of 20th century sunspot numbers vs 20th century temperatures. You'll see that sunspots & temperatures match extremely closely for at least the 1st half of the century, then get increasingly separate as you proceed into the 2nd half of the century. Fact is, if we were going to see any thermal inertia from the sun, we would have seen it around the 1950's & 1960's-after sunspots peaked-yet warming during this period was relatively slow. The rate only picked up *after* the period where we'd expect that thermal inertia to no longer be in effect (about 10 years). If I've got this wrong, then I hope someone will correct me.
    0 0
  12. Also, Mozart, sunspot data shows that the highest average sunspot numbers were actually around the 1930's to 1950's. Every decade since has seen lower average sunspots than at this earlier time.
    0 0
  13. I'm simply referring to the total solar irradiation number, which is still well above 1900 levels. Because of the breakdown in correlation between this number and temperature in the second half of the century, "something else" had to be causing the warming. That something else is CO2, and the argument is made here that we have more to come from the existing CO2 increase. But in calculcating the base temperature increase for the 20th century,which creates the parameter for CO2 response, is it really reasonable to assume the solar effect is zero? Put another way, is it more likely that the solar effect is being amplified and/or supressed....or is it more likely changes in solar irradiation are simply irrelevant.
    0 0
  14. #10: "Why has this rise in solar levels ... not played a part in the rise of temperatures over the last 200 years? " It did play a part. See It warmed before 1940 and Human fingerprint in the seasons, among other threads dealing with solar warming. As always, a little reading and research shows that climate scientists aren't ignoring these obvious questions.
    0 0
  15. I'm referring to the relationship between CO2 and temperature for the 20th century. The 0.57 degrees centigrade rise, is linked to a 23.7% rise in CO2. But the solar irradiation number in 2000 was higher than in 1900, which should account for some of the rise? So is the basic relationship weaker? To simply ignore the effects of solar, because it doesn't correlate well in the last 30 years seems unwise....particularly as it was solar irradiation fluctuations that took us in and out of the little Ice Ages. Let me pose the question in a different way. If a new Carbon level has a delayed response, do we believe a step to a new plateau level in solar irradiation is played out immediately, over ten years, over 50 years?
    0 0
  16. #15: "To simply ignore the effects of solar... " No one is ignoring the effects of solar (where did I hear that before?) See How we know the sun isn't or any of the threads that show all the forcings are used in warming calculations. "As always, a little reading and research shows that climate scientists aren't ignoring these obvious questions."
    0 0
  17. SOF #8 - nice article, thanks. Good to see Monckton Myths mentioned there! Mozart - two things. 1) The solar radiative forcing over the past century has been about 10 times smaller than the CO2 radiative forcing. A smaller forcing means thermal inertia causes less of a lag. 2) Solar irradiance hasn't increased in over 60 years now. Even with a radiative forcing as large as CO2, most of the warming is realized within that timeframe. But with changes as small as the solar irradiance increase, most of the warming is realized within 5-10 years.
    0 0
  18. Thanks dana I appreciate that answer, and it makes sense. But I guess the net of all of that is the 20th century relationship CO2 to temperature is somewhat weaker than a 23.7% rise in CO2 produces a 0.57 degree C rise. Maybe a 0.35% rise? Conversely it has to increase the CO2 response for the last 30 years. Muoncounter my only problem with the link you site is the solar response is in fact derived from an assumed CO2 response. Given that's the variable most in dispute....the reasoning seems a bit circular. "So now to calculate the change in temperature, we just need to know the climate sensitivity. Studies have given a possible range of values of 2 to 4.5°C warming for a doubling of CO2 (IPCC 2007), which corresponds to a range of 0.54 to 1.2°C/(W-m-2) for λ. We can then calculate the change in global temperature caused by the increase in TSI since 1900 using the formulas above."
    0 0
    Moderator Response: Also use the Search field to find the Post "Climate time lag."
  19. Apologies...."Maybe a 0.35% rise" should read "Maybe a 0.35 degree rise". An edit function would be helpful.
    0 0
  20. Oops...and "site" should read "cite". I'm humbled.
    0 0
  21. #9 Marcus and #17 dana 1981..........There's a lesson here. I wasn't researching Monckton, I was just browsing through the blogrolls on several websites. "We are a service for journalists and the online climate community. Our team of researchers will provide a rapid response service for climate science stories. We go straight to peer-reviewed science and the relevant scientists to get their opinions. Right now we are in the early stages of developing the site." "We (at carbonbrief.org) are a project of the Energy Strategy Centre." "The Energy Strategy Center...is the communications unit at the European Climate Foundation." "(The) Energy Climate Foundation aims to provide climate and energy policies that greatly reduce Europe's greenhouse gas emissions, and help Europe play an even stronger international leadership role in mitigating climate change." And, there's a second lesson here. Some of what is said in Europe, stays in Europe...when just doing standard googling, stateside.
    0 0
  22. mozart - I recommend you look over the 'Climate sensitivity is not specific to CO2' section here. I discussed the 'efficacies' of various climate forcings - how effective they are in changing global temperatures. If anything, solar irradiance has a lower efficacy than CO2, so comparing the response to solar irraidance to the response to CO2 is a reasonable thing to do.
    0 0
  23. #18: "Conversely it has to increase the CO2 response for the last 30 years." Of course it has to increase. Atmospheric CO2 concentration is a strongly concave up function of time. CO2 concentration drives radiative forcing by the log of the ratio of current year CO2 to a reference level (usually the 'pre-industrial' 280 ppm). Some have argued (see Monckton #3) that warming must slow because the log function is concave down, but CO2's upward concavity trumps. So even after taking the natural log of this ratio, we still see a concave up temperature vs. time. Hence the slope of the temperature graph increases. See sample graphs here.
    0 0
  24. Thanks for clarifying that Dana & Muon. I knew I only had part of the story. Any look at CO2 vs solar forcing for the last 120 years shows that CO2 easily swamps solar. Its worth noting that solar forcing grew from almost zero during the Maunder/Dalton Minimum periods up to the highs of the mid-20th century, yet that produced-at best-a +0.6 degree warming over a period of about 200 years. By contrast, we've seen a +0.6 degree warming in just the last 60 years-with +0.5 degrees of that being in the last 30 years-which represents an almost 10 times more rapid warming trend than from Solar "alone" (I say alone, though for the period of 1900-1950 CO2 was almost certainly playing a minor role). IMO, that really does highlight how powerful greenhouse gases are at boosting temperatures-compared to solar forcing alone-something further reinforced by a consideration of how much hotter our planet was 500 million years ago-in *spite* of the sun being significantly cooler than today.
    0 0
  25. To simply ignore the effects of solar, because it doesn't correlate well in the last 30 years seems unwise....particularly as it was solar irradiation fluctuations that took us in and out of the little Ice Ages.. Mozart, with this and other questions, you are inquiring about what is called attribution. You would do well do look at the IPCC WG1 Chp9 for the science in review. However, to get some idea about relative effects consider that solar change from pre-industrial is estimated at 0.12W/m2 whereas CO2 alone is estimated at 1.66W/m2 let alone other man-made gases. Also LIA has volcanic effects. Furthermore, while there was an LIA in Southern Hemisphere, it would appear to be not as cold. The mountain glacier features look very different.
    0 0
    Moderator Response: [muoncounter] fixed open html link tag.
  26. OK, let's have a look at it. First of all Stefan–Boltzmann law is I = ε·σ·T04 (1) where I is power flux (W/m2), ε is emissivity (a number between 0 and 1), σ = 5.67×10⁻⁸ Wm-2K-4 is the Stefan–Boltzmann constant and T0 is surface temperature. Now, effective temperature of Earth is about 255 K (-18°C) while its average surface temperature is 288 K (15°C). I = σ·Teff4 (2) From (1) and (2) for its equilibrium effective emissivity we get ε0 = (Teff/T0)4 ~ 0.61 (3) If some more CO2 is put into the atmosphere, effective emissivity is decreasing, so it should be compensated for increasing surface temperature to preserve radiative balance. I0 = ε0·σ·T04 = (ε0-Δε)·σ·(T0+ΔT)4 (4) From (4) we get Δε = 4·ε0/T0·ΔT (5) whenever ΔT is small compared to T0. On the other hand we have ΔT = λ·5.35·log(C/C0) (6) as above, where λ is the equilibrium climate sensitivity while C and C0 are the current and preindustrial CO2 concentrations (measured in ppmv) respectively. From (5) and (6) we have the effective emissivity anomaly as a function of climate sensitivity and CO2 concentration. Δε = λ·21.4·ε0/T0·log(C/C0) (7) Forcing (relative to preindustrial CO2 level) due to CO2 induced effective emissivity anomaly is ΔF = λ·21.4·ε0·σ·T03·log(C/C0) (8) As a 1 W/m2 radiative imbalance implies a monthly heat accumulation of 0.134×10²² J in the climate system, monthly heat accumulation due to CO2 forcing is ΔQmonth = λ·2.87×10²²·ε0·σ·T03·log(Cmonth/C0) (9) We have monthly data (some interpolated) for atmospheric CO2 concentration as measured at the Mauna Loa Observatory, Hawaii since March, 1958. In (9) λ is unknown, but all the other terms are given. Therefore it makes sense to define Dmonth = 2.87×10²²·ε0·σ·T03·log(Cmonth/C0) (10) ΔQmonth = λ·Dmonth (11) As vector D is given (λ is an unknown constant), we can write ΔQ = λ·D (12) Of course actual heat gain is less than that. The surface is also warming and radiative losses increase with the fourth power of temperature. It's easy to verify that heat flux anomaly due to a temperature anomaly ΔT is ΔI = 4·ε0·σ·T03·ΔT (13) Fortunately we also have average surface temperature anomalies at NASA GISS (from January, 1880). Using the same conversion as above, we can define R, monthly heat loss due to a temperature anomaly as ΔRmonth = 0.536×10²²·ε0·σ·T03·ΔTmonth (14) Heat retained by the greenhouse effect either goes to space or is sequestered into the ocean. Fortunately we also have some data regarding OHC (Ocean Heat Content). It is only the heat content of the upper 700 m, but as it is reasonably sure change of heat content of the entire climate system is proportional to this quantity, let the coefficient be μ. Therefore we have vector S, although this one is only with a quarter year resolution. Of course we can resample D and R to match it. Due to unknown offsets the balance is still not perfect, there is also an unknown linear function of time, so we can write λ·D - R - μ·S = α·t + β (15) where t is time, α and β constants. It is only true as far as ASR (absorbed Shortwave Radiation) is constant. Of course it is not, but if it has no trend, it has no influence on climate sensitivity calculations. So the next task is to choose λ, μ, α and β that minimizes DS-αt-β-R)2. It is basically a system of linear equations with four unknowns and if solved, it comes out as λ = 0.64. This climate sensitivity corresponds to 2.37°C equilibrium warming for a doubling of CO2 concentration. However, μ = 0.08 is deep below 1, which is impossible. It would mean all the heat stored in the climate system is only 8% of what is found in the upper 700 m of oceans. Not only there is no missing heat, but a lot of excess heat is measured. Therefore OHC before mid 2003 (large scale deployment of ARGO floats) is almost certainly mismeasured and the flat curve seen since is typical of the entire epoch. It means heat exchange between the atmosphere and ocean is either very slow or the surface warming is actually much less than measured. λ is sensitive to surface temperatures (not so much to OHC), so if there is an UHI effect of about 0.25/doubling of local population density even in rural areas, equilibrium climate sensitivity is less than 0.5. It would mean the pipeline is practically empty, which is consistent with the low effective heat capacity or very long response time of oceans found above (I mean long, compared to the half century for which we have reliable CO2 data). If soot is also considered, it leaves even less room for a high value of λ, as it increases ASR and does have a trend.
    0 0

You need to be logged in to post a comment. Login via the left margin or if you're new, register here.


The Consensus Project Website

THE ESCALATOR

(free to republish)


© Copyright 2024 John Cook
Home | Translations | About Us | Privacy | Contact Us