


 Arguments


What caused early 20th Century warming?
What the science says...
| Select a level... |
 Basic
Basic
|
 Intermediate
|
 Advanced
| ||||
|
Early 20th century warming is due to several causes, including rising CO2. |
|||||||
Climate Myth...
It warmed before 1940 when CO2 was low
"Of the rise in temperature during the 20th century, the bulk occurred from 1900 to 1940. It was followed by the aforementioned cooling trend from 1940 to around 1975. Yet the concentration of greenhouse gases was measurably higher in that later period than in the former. That drop in temperature came after what was described in the National Geographic as 'six decades of abnormal warmth'." (James Schlesinger)
At a glance
The Twentieth Century climate was a veritable Smorgasbord of natural and manmade factors. They vied with or against one another, driving temperatures in various directions at different times. Conditions were on the cool side up until the 1920s. That was followed by a sustained warming through to the late 1940s. From then until the late 1970s, periods of warmer and cooler conditions alternated. Thereafter, we saw the erratic but one-way climb of temperatures that has persisted through to the present day.
This was also the period during which CO2 emissions from use of fossil fuels really took off, from 1.5 billion tonnes a year in 1900, through 6 billion tonnes in 1950, 25 billion by 2000 and 44 billion now. How well do those figures correlate with what was going on in Earth's climate system at the time?
Planetary climate is affected by a number of factors. Examples include solar variability, the amount of volcanic activity, fluctuating ocean currents, cyclic variations in Earth's orbit, the strength of the Greenhouse Effect and the amount of sunlight reflected by Earth's surface. Some are forcings - factors that dictate and change the total energy within the climate system. Others are feedbacks - they respond in various ways to those changes.
Both forcings and feedbacks operate on a variable timescales - from years to millennia. That variability means they may sometimes reinforce one another and at other times cancel each other out. To assess why the climate behaved in a certain way at a certain time, all must be examined.
In the case of the 1920-1940 period, the increase in global temperature is thought to have been largely caused by three of the above factors. The amount of solar energy reaching the top of Earth's atmosphere rose steadily from 1920-1940. Although the amount of change was small, it was certainly not negligible. Volcanic activity produces atmospheric aerosols that can have a cooling effect by partly blocking out the sun. Lower than normal volcanic activity, as was the case in the 1920-1940 period, would result in less of those airborne coolants. Our early, albeit relatively low greenhouse gas emissions also contributed to the warming. Regional factors played a role in increasing temperatures in some parts of the world, too. Most notably, changes in ocean currents led to warmer-than-normal sea temperatures in the North Atlantic.
Anyone who has been around for long enough to recall the chemical smogs of the 1950s and early 1960s will know that pollution can be deadly. In one smog, in London in December 1952, between 4,000 and 12,000 people died, victims of severe respiratory disease. Governments responded. Over the next two decades numerous Clean Air Acts were passed. Pollution levels fell accordingly. But such pollutants, just like volcanic gases, are aerosols that have that same cooling effect. Clearing them away removed that effect and tore off the mask behind which CO2 emissions had been hiding - and off we went on our warming journey.
Please use this form to provide feedback about this new "At a glance" section. Read a more technical version below or dig deeper via the tabs above!
Further details
It is a widespread misconception that anthropogenic global warming has been the dominant factor driving climate during all periods of the twentieth century. It is clear that anthropogenic carbon emissions are the reason we are warmer today than we were in the mid-1800s. But here we are considering the whole 20th century. As has obviously been done with respect to the more recent, post 1970s warming, to examine the evolution of climate through the whole 20th Century it is necessary to investigate all potential causes of climate forcing and establish how they have interacted. In addition to greenhouse gas emissions, other key variables to consider include:
- solar variability
- volcanic activity
- aerosol concentrations - both natural and anthropogenic
- changes in albedo
- fluctuations in oceanic currents
- orbital factors (Milankovitch cycles)
These factors operate on various timescales and interact variably with one another, but despite such complexities, climate science has drilled down into the pre-1940s period and has identified the key reasons for the warming at the time.
In the early 20th century, while CO2 levels were much smaller, they were rising despite emissions being a fraction of what they are today. Solar activity was on the rise throughout this period, amounting to a change in incoming radiation of approximately a watt per square metre.
Also, after a burst of volcanic activity in the late 19th century (think Krakatoa etc), there was a relatively quiet volcanic period in the early 20th century. These were two dominant factors in the warming from 1900 to 1940 (fig. 1).
However, those factors have played little to no part in the warming since 1975. Solar activity has declined since that time whereas temperatures have continued climbing. Volcanoes have been relatively frequent in the last few decades and if anything, have exerted a cooling effect that has somewhat masked the CO2 warming effect. The 1991 eruption of Mt Pinatubo is an example.
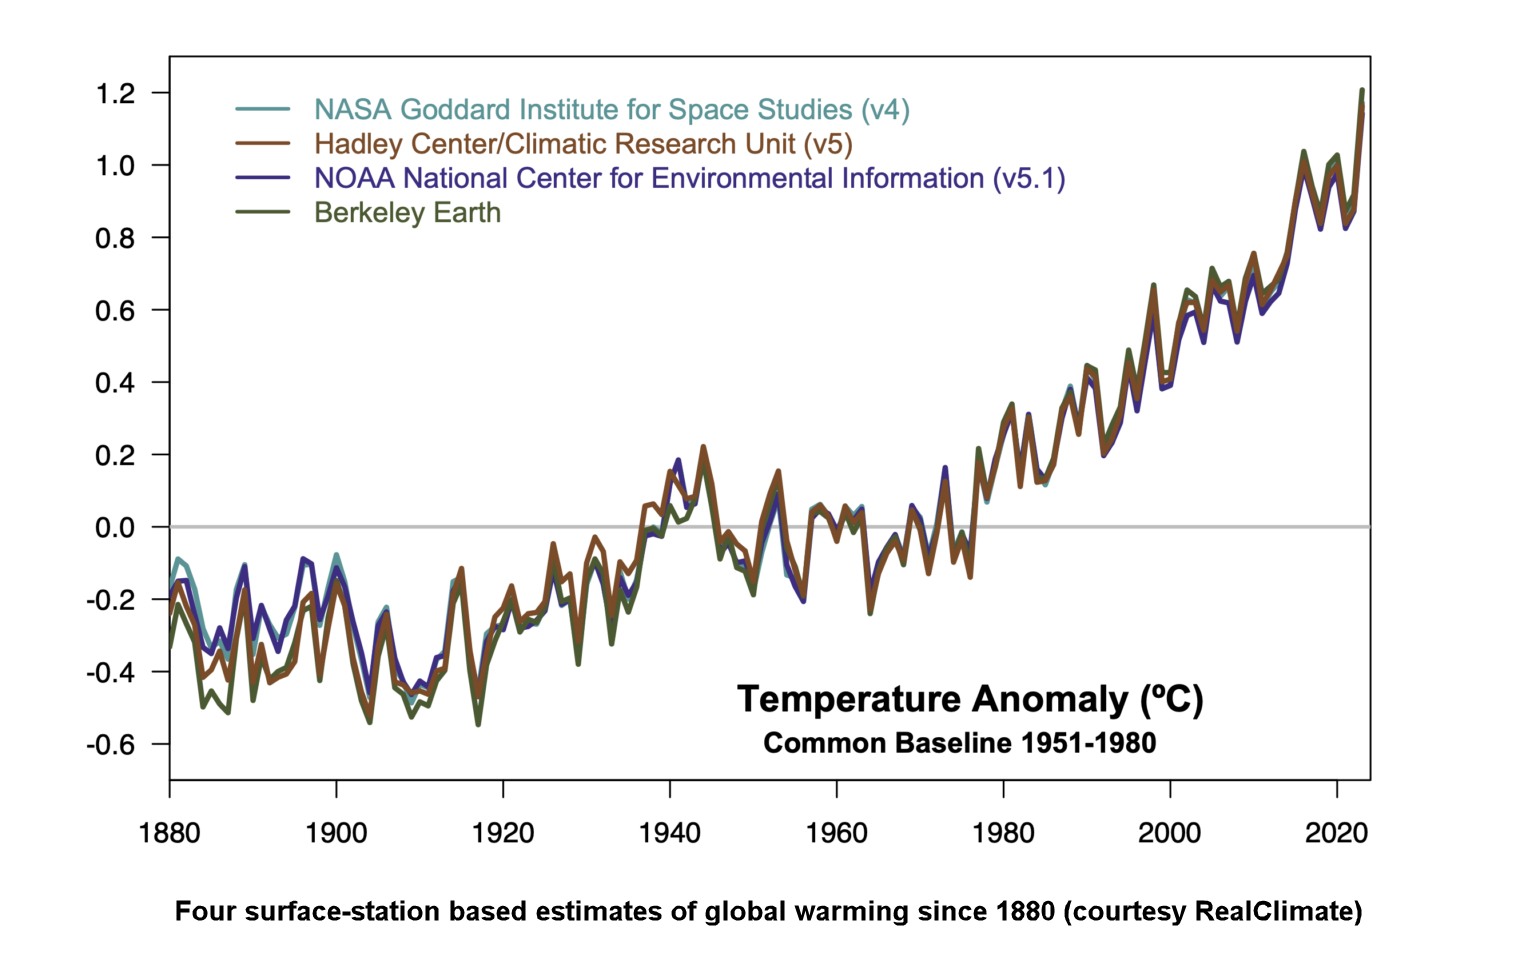
Figure 1: Multiple independent global surface temperature products show a very coherent pattern of temperature change over the 1880-2023 period. While there is overlap in the weather station inputs and ocean data, the methods for correcting for missing data, inhomogeneities, spatial sampling etc. are independent. Graphic: Realclimate.
Papers studying climate change over the early 20th century
In, "Estimation of natural and anthropogenic contributions to twentieth century temperature change" (Tett et al. 2002), the authors commented: "During 1907–57 we found that there was negligible net anthropogenic warming with the effect of greenhouse gases largely being balanced by other anthropogenic forcings. Therefore, in this period, the warming was largely naturally caused. The late century warming was largely explained by greenhouse gases offset by the effect of volcanic aerosol and the indirect effect of anthropogenic aerosols. Over the entire century natural forcings make no net contribution as they warm early in the century and cool from the 1960s on."
In the paper, "Solar Forcing of Global Climate Change Since The Mid-17th Century" (Reid 1997), the author found a link between solar variability and early 20th Century climate change, concluding that "solar forcing and anthropogenic greenhouse-gas forcing made roughly equal contributions to the rise in global temperature that took place between 1900 and 1955".
More recently, in an important review paper (Hegerl et al. 2019), the causes of observed climate variations were discussed in the period from 1750 to the present day. Interestingly, a synthesis of results from attribution studies showed how greenhouse gases began to cause a warming trend that was attributable to greenhouse gases by 1900 in proxy-based temperature reconstructions.
Hegerl et al. found that the influence of greenhouse gases unsurprisingly increased over time, dominating recent trends. However, other forcings caused substantial deviations from this emerging greenhouse warming trend. Intense periods of volcanicity caused strong cooling in the early 19th century. Warming occurred during periods of low volcanic activity, such as in the early-to-mid 20th century. Anthropogenic aerosol forcing most likely masked some anthropogenic global warming over the 20th century. That was particularly the case in the period since the accelerated increase in sulphate aerosol emissions starting around 1950, thereby explaining the overall cooler conditions in the post-1940s period. This paper is open-access.
Of course, that sulphate aerosol pollution was a bit different to CO2 - you could see it and taste it. The London Smogs are just one example. Such appalling air quality led to measures in various countries to limit such pollutants, such as the UK government passing the Clean Air Acts of 1956 and 1968. With this negative forcing mechanism strongly reduced, the modern anthropogenic warming signal emerged a few years later.
Last updated on 16 June 2024 by John Mason. View Archives


No, CO2 is not the only driver of climate but currently it's the strongest climate forcing and also the fastest rising.
"our atmosphere has sustained life with a co2 count of 10000 ppm"
In past periods when CO2 was much higher, solar output was also much lower. What really hurts species is when climate changes quickly - the species cannot adapt quickly enough. This is why in past periods when climate has changed quickly, it's been accompanied by mass extinctions.
@Bob Loblaw #39:
I made a few mistakes in my regression of TSI vs SSN. The 0.80 R-squared is from the ACRIM TSI dataset (not PMOD) vs the smoothed SSN (not raw SSN). Plus as stated I used post 1992 data to avoid the "ACRIM gap" issue. For comparison the post 2003 TIM TSI dataset shows an R-squared of .73 when regressed against the smoothed SSN. Standard error on ACRIM TSI vs Smoothed SSN regression is 0.21 W/m2. All of these numbers from monthly average datasets.
Moving on I created my own TSI reconstruction from the regression formula (0.0109x+1360.9), and looked for the TSI trend in the period of interest. Regression trends from psuedo-wave functions like SSN are tricky, your period should go from peak to peak or trough to trough, anything else introduces a bias. So I calculated the trend from 1902 to 1954 to straddle my area of interest. The slope is .09W/m2/decade, which would work out to an approximate change of 0.36W/m2 in TSI from 1900 to 1940. Note that above the discussion starts by quoting an approximate increase in this period of about 0.5W/m2 in TSI, so my TSI reconstruction number is lower but in the ballpark.
Using the method above, but my delta TSI for 1910 to 1945 (about 0.3W/m2), the temperature increase from the TSI change is about 0.05C, or 1/2 to 1/3 of the number above.
Let's say we agree on the Skeptical Science CO2 calculation above (0.15C increase from CO2 alone). Let's also say my calculation on TSI is correct (0.05C). Let's also say the contribution from aerosols is zero (it should be some small negative number since they were increasing, and the net effect of aerosols is cooling, but we'll ignore for this analysis).
Add the TSI/CO2 change up and you have a global SAT increase of 0.2C in the period 1910 to 1945. However, the observed change is close to 0.5C in this period. Say the error on CO2 is +/- .04C, and the error on TSI is +/- .05C. The maximum temperature change is about (0.19+.10) 0.3C. Still not close to the actual of 0.5C. Thats assuming the aerosol impact is zero, but it's not. It's cooling, thereby dragging the model number lower than my 0.2 to 0.3C model increase calculation.
My argument is that despite the presentation above, you cannot account for the rapid increase in temperature from 1910 to 1945 using only TSI and CO2 and aerosol inputs. There is some other factor at play missed by the models. Obviously the main disagreement between myself and the above Skeptical Science calculation is the TSI input, but after doing my own reconstruction based on a very good correlation between ACRIM and SSN (smoothed), I think the 1W/m2 delta TSI in this period is just too high.
Klapper @8,
1) What is missing from your argument above is stratospheric aerosols from volcanoes (B in the graph below):
The distinct lack of major volcanism between 1915 and 1960 is a major factor in the rapid warming in the early twentieth century.
2) Your trend calculation ignores that 1910 was very close to a solar minimum while 1940 is close to a solar maximum. Simply taking the trend while ignoring the difference in the position in the solar cycle underestimates by about half the change in TSI between the two periods.
Klapper, can see if I have the argument right?
Observed warming is consistant with published model hindcasts for this period (especially when difficulties with forcing estimation is accounted for).
However you are discounting this because the forcing that the models use do not match your own fairly crude estimates of forcings which you prefer to estimates based on published papers?
Is this a fair summary? If so then I think you should presenting direct critique of relevent forcing papers, outlining where you think they have overlooked or made errors.
@Tom Curtis #9:
Actually I'm talking about the 1910 to 1945 period. I tried to reset my period to match the discussion by SKS in this post, which was probably a mistake. See my all my comments over at another thread:
http://www.skepticalscience.com/jones-2013-attribution.html
(-snip-). Read my other posts on aerosols since I agree with you that aerosol component had low leverage in the 1910 to 1945 period. I checked the trend calculation also from 1915 to 1945 since that avoids the effects of the Katmai eruption at the beginning of the period. It doesn't really change much from trends calculated for SAT in the 1910 to 1945 period; the numbers to 2 significant digits are between 0.15 and 0.14C/decade.
As for the point on solar minimums, 1910 is a solar minimum and so is 1945, so I'm including 3 complete solar cycles in my solar analysis, which is another advantage to analyzing this period (along with minimal aerosol input). If you wanted to be nitpicky, the trend 1912 or 1913 to 1945 would be a better one to evaluate since it's more "perfect" in isolating the solar cycles to complete ones, but as I've noted the 1915 to 1945 trend is really no different than the 1910 to 1945 one in the observations.
Actually, although my most recent comment sets aerosol cooling to zero, we should be careful about minimizing aerosol leverage in this time period. While it is true there was only one major volcanic episode, the anthropogenic component was more coal, less oil (hence more sulfur dioxide), plus emission controls were nil in that period. Total fossil fuel consumption in the period 1910 to 1945 was about 1/4 to 1/5 the consumption rate from 1970 to 2000, but it was pretty dirty. I'm only saying this to note I know the anthropogenic aerosols from this period can't be directly compared to the emission rate per fossil fuel input as later in the 20th century.
In the end the 1910 to 1945 period is a good period to check your climate sensitivity for the following reasons:
1. We have reasonable low error limits on CO2 growth
2. We have poor direct information on aerosols, but the fossil fuel consumption rate is low, and there is only one major volcanic episode, so we can assume aerosol cooling is not significant.
3. We have good correlation of the three observational SAT datasets
4. The period includes complete solar cycles (and I would argue we have reasonable reconstructions of TSI but that may be a point of argument for some).
In short, what's not to like about 1910 to 1945?
@Scaddenp #10:
Exactly. My crude reconstruction of TSI (albeit based on a good correlation between ACRIM and smoothed SSN) shows that the lower end of the TSI estimate discussed in the post above is more likely to be correct. Here's the quote from this post on TSI:
"As you can see, in the early 20th Century, from about 1900 to 1940 there was an increase in TSI from about 1365.5 to 1366 Wm-2"
My estimate for delta TSI from 1900 to 1940 is 0.36W/m2. Just round it off to 0.4W/m2. This posts starts out by saying the increase is 0.5W/m2, but because there have been higher estimates, ups that to 1W/m2 delta TSI, without justification in my mind.
Let's summarize what I think we agree on for this period 1910 to 1945:
1. We agree the CO2 forcing results in approximately 0.15C warming
2. We agree that the cooling effect from aerosols trends is low
3. We agree the period is long enough to detect the climate signal
4. We agree the observations are coherent from dataset to dataset and the warming over this period is SAT is approximately 0.5C
5. We agree the error in the observed warming is approximately +/-0.14C
If the above 5 points are true then we just have one major point to agree on: delta TSI. Of course these are back of the envelope calculations but that's the starting point of this post in the first place. My real point is that I think you have a problem with your models in this period, which is a good one to evaluate as I've discussed above and it's not enough to just say it's within the margin of error and call it a day.
Klapper @12:
1) Regarding anthropogenic aerosols, the period 1910-1940 saw the phase out of coal and replacement by oil as a fuel for ships, and a partial replacement of coal with oil for stationary power generation. That means there were less aerosols produced per unit CO2 in that period than during the preceding thirty years.
2) More importantly, the virtual elimination of stratospheric aersols over that interval represents a strong positive forcing. I believe it, rather than the enhanced solar forcing, is considered to be the primary reason for the rapid increase in temperature during that interval, just as the reintroduction of stratospheric aerosols is a significant factor in the slight cooling from the mid 1940s to the late 1960s. I do not think we are agreeing. I think you have missed my point.
3) Even allowing that you are interested in the period from 1910-1945, peak solar output increased far more over that period than did minimum solar output. By benchmarking your trend on the minimums, I still believe you to be underestimating the increase in solar forcing.
@Tom Curtis #13:
Your point 2: Show me the math on aerosols warming 1910 to 1945. Aerosols can't warm, they can only cool (not quite true since black carbon can be a positive forcing).
Your point 3: I'm not "benchmarking" (whatever that is in this context) on the solar minimums. I'm saying you can only calculate trends in pseudo-waveform functions like TSI by calculating trends from peak to peak or trough to trough, either method works, hence my adoption of the 1910 to 1945 as a good period to evaluate. My calculated delta TSI of 0.09W/m2/decade is based on a minimum to minimum trend period only since the minimums are less noisy than the maximums. I checked both 1902 to 1954 and 1912 to 1944, but got the same number (0.09W/m2/decade) for delta TSI.
We do not agree on net aerosol effect. Again, you are claiming that your construction of the net forcings over this period is better than the published ones, but you do not seem to be making reference to any of the published papers to challenge their methodology and, as TC and Bob have pointed out, ignored important factors in aerosols. (Change in BC, volcanic quienessence).
Klapper, others - Note that there is some ambiguity about the sunspot numbers - according to Svalgaard 2012, due to changes in counting methods the sunspot numbers pre-1875 are low by a factor of 50%, and the numbers from 1940 onward are high by a factor of 20%.
I don't know if these adjustments are generally accepted, but if they are correct your TSI estimates will be off accordingly.
[Source]
First, a quick clarification for anyone that reads this portion of the thread at some point in the distant future. Klapper's comment #8 is the result of a thread happening here that was getting off topic, and is moving into this thread where it is more on topic.
Now, to address a few of Klapper's points:
From what I understand, you have regressed TSI in the recent period against sunspot numbers, and then used that to estimate TSI in the period 1910-1945, and then used that TSI trend to compare to the temperature trend. In essence, what this is doing is just attempting to explain the temperature trend by correlating it with sunspot numbers. This is not a very sophiitcated model, and the idea that your model is better than the models in the literature is - shall we say - somewhat dubious. All I can suggest is that you take scaddenp's comment to heart, and think about how crude your model is (and it is a model).
But to expland on certain points, let's first think about your use of sunspots. Sunspots are dark areas on the surface of the sun, and thus are spots that emit less radiation, not more. This has been directly observed using space-borne measurements of TSI during times of transit of sunspots across the visible solar disk. Yet increased sunspot numbers are associated with increased TSI on average, so the increase can't be just because of the sunspots. In fact, sunspots are just an indicator of something else that is going on with the sun, just as tree rings are an indicator that something is going on with the local climate. Sunspots are a proxy for solar activity, not a measurement of TSI. Sunspots are a not the best that science has to offer. Thus, you are basing your conclusions on a poor proxy for TSI, and this is leading you astray. Better estimates of past TSI use more sophisticated models, and are more likely to provide more useful results.
Your understanding of aerosols and their effects is also very simplistic. In #14, you say "aerosols can't cool", and this is wrong. The effect of aerosols differs greatly depending on whether they are mostly-absorbing (e.g., soot), or mostly-scattering (e.g., light-coloured dust). This is usually quantified in terms of the "single scattering albedo". Although generally aerosols cause surface cooling, this is not always the case. A highly-scattering aerosol over a highly-reflective surface can have a warming effect, because is also affects the solar radiation reflected off the surface. A highly-absorbing aerosol reduces the solar radiation reaching the ground, but causes warming at the altitude the aerosol is located at. To thoroughly account for aerosols, you have to have knowledge of their optical properties and size distributions, as well as their geographical location and altitude. The trends in these properties over time will affect the temperature trends. Thus, you are basing your conclusions on a poor understanding of aerosols, and this is leading you astray.
Looking solely at direct relationships between forcing factors (TSI, aerosols, etc.) and temperature ignores any time lags in the climate system. We know that forcings don't instantaneously result in temperature changes - it takes time for the climate to equilibrate. Thus, your anaylsis uses a simplistic relationship between forcings and temperature, and this is leading you astray.
You have assumed that your simplistic reconstruction of TSI is better than the experts. You have assumed that aerosol effects over the period are zero. You have assumed that a simplistic model of T = f(CO2, sunspots) is valid. You then conclude that the experts have something wrong, even though the experts' models are much more sophisticated. Thus, you have assumed your conclusion. This is leading you astray.
A second comment, because the issue is sufficiently different from the ones that I addressed in the comment above. In #12, Klapper says
I think this is following on the discussion on the other thread, where it was stated that lack of accuracy in model inputs places limits on how well we can expect models to match past temperature records. This has led to the current discussion of reconstructing past TSI and aerosol forcings.
Klapper seems to feel that the models need some fixing to better match past climates, and seems unwilling to accept that there may be not much that can be done about it, due to inaccuracies. I will try to illustrate why limited accuracy of forcings limits our ability to "fix" a model, by using a very simple (non-climate) model.
Let's assume that we have a model that says A + B = T. We have measurements of T that tell us it was 15.2 +/- 0.1 at some past time. Unfortunately, we do not have good estimates of A or B at that time - we only have proxies, and our best guesses are that the past values were A = 10.4 +/- 0.6, and B = 5.6 +/- 1.0. Thus, our model says that T = 16.0 +/- 1.2 (assuming independent errors for A and B).
Is the model right or wrong? Well, the direct measurement of T is 15.2 +/- 0.1, and our model says it should be 16.0 +/- 1.2. The observation falls within the errors for the model, so the observation does not disprove the model. The model could be right.
More importantly, are we justified in modifying the model? We could "improve" the model, by making it 0.923*A + B = T, and our model would then predict T = 15.4, which matches the observation. Is this justified? We could just as easily make the model A + 0.857*B = T, and get an exact match. Or, we could play with any combination of fudge factors for both A and B to get a matchj - there are an infinite number of them that would work.
The problem is that there is no way of determining if any of these arbitrary "fixes" is correct, because we have no further observations of any kind that can differentiate amongst the possibilities. Indeed, within the error bounds of our data, the fudges that give an exact match between predicted and observed T are no better than our original model A + B = T. They all fall within the error bounds. Those error bounds already tell us that the original model may be correct.
When a model's output (value plus error bounds) already falls within the error bounds of the observations, it is a Bad Idea to try to tune a model through purely arbitrary adjustment of parameters. Such adjustments, even if they improve the match between model output and observations, do not mean that we have improved the model. It is a Good Idea to try to improve upon the knowledge of the various input variables/parameters, but you do not accomplish this by just trying different numbers in the model - you need an independent source of information. Blindly fudging parameters is just fitting to the noise.
The Blogosphere is full of fake skeptics that think they have a good model just because they can get an arbitrary series of equations (usually "cycles") with arbitrary fitting of parameters, all while ignoring the known physics. It will be gussied up in terms of statistics or Fourier Analysis, or some fancy words, but it is not good science. A great place to see these things taken down is Tamino's, where is is often called Mathturbation.
In Klapper's case, it appears that he is looking at the experts' models, for which observations do fall within model output (value plus uncertainties), and replacing them with worse models, which show a poorer match with the observations, and convincing himself that the experts are wrong.
@scaddenp #15:
Are you saying that the soot effect (warming) outweighs the sulphate effect (cooling) in the period 1910 to 1945? From the IPCC AR4 report, FAQ2.1, Figure 2, the net effect of anthropogenic aerosols is clearly negative (cooling), totalling about -1.2 W/m2 since the dawn of the industrial era in 1750 to 2005.
@KR #16:
I downloaded some TSI reconstructions covering the period 1910 to 1945 to cross-check my smoothed SSN/ACRIM model. I started with a relatively new one at the SORCE website described as "computed by G. Kopp using TIM V.12 data on Jan 19, 2012". This reconstruction has annual resolution. Between 1912.5 and 1944.5 (solar cycles 15,16 and 17) the trend in TSI is the same as one I've suggested based on my model (Kopp trend = 0.083W/m2/decade).
I also downloaded a daily TSI reconstruction from the Max Planck Institute, authored I think by N Krivova. In the period of 1912 to 1944.5, the trend of this reconstruction is lower than mine (Krivova trend = 0.042W/m2/decade).
I then discovered a link to a spreadsheet compiled by Leif Svalgaard circa 2009? containing a number of reconstructions, albeit all annual and not well documented as to source. However, from the labels I assume these are Hoyt & Schatten 1997, Lean 2000, Wang et al 2005, Dora & Walton 2005, and one by Leif himself.
from 1912.5 to 1944.5 the TSI deltas from regression of these reconstructions are:
Hoyt: 0.401W/m2/decade
Lean: 0.280W/m2/decade
Wang: 0.083W/m2/decade
Dora: 0.090W/m2/decade
Leif: 0.041W/m2/decade
Krivova 0.040W/m2/decade
In summary, there are 3 reconstructions the same as mine (Kopp, Wang, Dora), 2 substantially lower (Leif, Krivova) and 2 substantially higher (Lean, Hoyt). Note the 2 oldest reconstructions are also the highest, so I'm sticking to my estimate of a net TSI change between 1910 and 1945 of about 0.3W/m2, which calculates to an equilibrium temperature rise of about 0.05C.
@Bob Loblaw #17 #18:
See my post #20 on the subject of TSI. My model may be crude but it gave the same result for the period 1912 to 1944 as Wang et al 2005, Dora & Walton 2005, and Kopp 2012.
On the subject of aerosols, see my post #19. The IPCC AR4 report says anthropogenic aerosols are a net negative forcing (just like volcanic aerosols). I've said let's ignore aerosols in the 1910 to 1945 period, but if you don't want to, then let's assign the aerosol some negative forcing number for our model cross-check calculation.
My argument is pretty simple, when you put in reasonable values for GHG, TSI forcing (aerosols too if you want), your model forecasts a warming in the 1910 to 1945 period so low that the high end of the forecast is below the low end of the observation error, i.e. the model fails.
Klapper - Just to be clear: are you or are you not using all of the observed forcings in your model runs?
You've stated: "I've said let's ignore aerosols in the 1910 to 1945 period..."
If you are not applying all the forcings to your model runs (by ignoring or assigning arbitrary forcings to aerosols, for example), it is entirely unsurprising that you aren't seeing a good match to observed temperatures.
Klapper @21, etc.
You still fail to see the error of your ways. It's not that your reconstruction of forcings is not possible, it's that it is not possible to exclude the others that are different (based on current knowledge). So you can come up with something that falls within the range of values in the literature? That's like saying "gravity still works!". The answer is "so what? - we've already included that in our estimates of our uncertainty."
You error is assuming that your reconstruction is the correct one, and therefore the models are wrong.
The fact that numerous attempts to reconstruct TSI (or aerosol forcings) lead to different results forces us (pun intended) to conclude that the uncertainty in those forcings is too large to come to reliable conclusions beyond what has been stated in the literature.
By choosing to rely on one estimate of forcings - even if it is within the range of values in the literature - to the exclusion of others that do not conform to your conclusion is called cherry picking and confirmation bias.
The proper way to handle the uncertainty is to accept it. Unless you can provide an independent evaluation of your TSI reconstruction, you are chasing your tail in the noise of uncertainty.
Different estimates of past forcing in the literature may later be identified as problematic through more study of the physics of solar output, and future reconstructions may improve on that basis, but what you are doing is choosing which reconstruction to believe because it agrees with your desired conclusions.
@KR #22:
I'm not doing model "runs". If you read my posts, I'm accepting the CO2 calculation for temperature change in the period above as done by Dana81. I'm not accepting the calculation for TSI; I think it's too high, but I'm using Dana's TSI formula for the temperature change in this period, but my own delta TSI. Actually, I made a huge mistake by calculating my own TSI reconstruction from SSN's/ACRIM. I should have said "For TSI I'll use the 3 most recent reconstructions I could find" (i.e Wang et al 2005, Dora & Walton 2005 and Kopp 2012). It's pretty much the exactly same number, but no one would have wasted time arguing with me about my TSI estimate.
If I can find a source for the aerosol forcing, I will add a calcuation for aerosols, since adding aerosols to the equation helps my argument by adding a negative number to the model temperature change.
In the end I'm just cross-checking the calculation done by Dana above, but with a different TSI number. My analysis of the various reconstructions indicates his number of 1 full Watt/m2 increase in TSI in the period of interest is too high, even his first statement on 0.5W/m2 increase in the period looks high.
@Bob Loblaw #23:
Skip my TSI reconstruction. I'll use the average of Wang et al 2005, Dora & Walton 2005, Krivova & Solanki 2008 and Kopp 2012 instead to calculate delta TSI. They are the most recent I could find so I'll assume they are the best. Also, if I can find an aerosol forcing model, I'll add the aerosol component for 1910 to 1945 to the calculation.