


 Arguments


Do high levels of CO2 in the past contradict the warming effect of CO2?
What the science says...
| Select a level... |
 Basic
Basic
|
 Intermediate
| |||
|
Climate and CO2 levels have always varied together. During past ice ages CO2 levels were low, and during warm periods CO2 was higher. |
|||||
Climate Myth...
CO2 was higher in the past
"The killer proof that CO2 does not drive climate is to be found during the Ordovician- Silurian and the Jurassic-Cretaceous periods when CO2 levels were greater than 4000 ppmv (parts per million by volume) and about 2000 ppmv respectively. If the IPCC theory is correct there should have been runaway greenhouse induced global warming during these periods but instead there was glaciation."
(The Lavoisier Group)
At a glance
Before diving headlong into this myth, one key thing needs to be pointed out. The confidence expressed in the above statement. Phrases like 'killer proof' should be enough to ring alarm bells warning the statement is not the work of any credible scientist. Scientific writing is a relatively sober business.
That aside, this myth is about the nature of Earth's atmosphere and climate through deep time. We know quite a bit about that atmosphere now - but far from everything. Through geological studies, we know a lot more about how the planetary climate evolved over time. But far from everything. It's work in progress.
Evolution of climate over deep time was governed by several factors. Fluctuations in the carbon cycle were driven by changes in the balance between CO2 sources and sinks. In those pre-human times, the key CO2 source was volcanic and the key sink was, as now, weathering. Volcanism is still a significant CO2 source - but about a hundredfold less than human emissions.
Weathering is a chemical reaction that involves the breakdown of the minerals making up the rocks of Earth's surface. Its key agent is carbon dioxide dissolved in rainwater, this being a weak acid. Since rainwater delivers the CO2, the intensity of weathering will partly depend upon rainfall. In turn, that depends on how wet - or dry - the climate happens to be in any given place at any given time.
That leads us into palaeogeography - the science of how the layout of the globe has changed through time. Slow changes in layout are driven by plate tectonics and continental drift. Geological evidence tells us that most of the continents on Earth were sometimes gathered together, to form 'supercontinents'. At other times, they were widely dispersed. Such changes in layout through deep time had implications for both the climate and intensity of weathering.
In general terms, the dry interior of a supercontinent reduces weathering, allowing CO2 levels to rise because the sink cannot keep up with the source. A dispersed pattern is a lot better for weathering and the sink can outpace the source, allowing CO2 levels to fall.
Over geological timescales, changes in Solar brightness matter, too. Solar brightness is considered to have increased steadily by about 10% per billion years of Earth's history. In the late Ordovician, 445 million years ago, there would therefore have been 4-5% less sunshine reaching the Earth. That's a big difference and enough to change what is known as the 'ice-threshold' - the point beyond which perennial ice-sheets can exist on Earth's surface.
There was certainly an ice-age in the late Ordovician. There are multiple lines of evidence that lend support to that statement. Dispersed continents favoured weathering and CO2 drawdown. Because of the dimmer Sun, the ice-threshold was set at a much higher CO2 level than in more recent times. Something else happened too. The late Ordovician ice-age was accompanied by the second-greatest mass-extinction in the fossil record. Neither the quote nor its parent document mention that. One wonders why.
Please use this form to provide feedback about this new "At a glance" section. Read a more technical version below or dig deeper via the tabs above!
Further details
Although our understanding of atmospheric composition through deep time is still a work in progress, we now know enough to state that climate and CO2 levels have always varied together. During ice ages CO2 levels were low, and during warm periods CO2 was higher.
In the Eocene (56-34 million years ago) there were no polar ice caps, temperatures were about 10ºC hotter than the 20th Century, and CO2 was about 1,500ppm (Westerhold et al. 2020, Rae et al. 2021). During the last Ice Age, CO2 varied between about 180 and 300 ppm as ice sheets waxed and waned with orbital wobbles (Rae et al. op.cit.). CO2 was also about that level during the late Paleozoic Ice Age, 340-290 million years ago (Foster et al. 2017).
Early attempts to estimate CO2 for that long ago in Earth’s past were broad-brush and very uncertain (e.g., Royer 2006), leading to the high CO2 estimates referred to in the myth. New data and refined techniques have since clarified the picture considerably. The 2006 estimates, for example, averaged data across 10-million-year timesteps, the 2017 data in the figure below used 0.5-million-year timesteps, and newer compilations don’t average across timesteps. At the same time, CO2 and temperature uncertainties have reduced considerably so that climates from the geological past (e.g., Fig. 1) are now a useful reality check for climate models (Tierney et al. 2020, IPCC 2021, see the intermediate version for more detail).
Data for the Ordovician are less certain, but they suggest that CO2 was about 2,400ppm and falling before the end-Ordovician glaciation (Pancost et al. 2013). Glaciation at higher CO2 levels than today was possible at that time for a variety of reasons including a less-bright Sun back then (see the intermediate version). The Jurassic and Cretaceous span 134 million years with several hothouse episodes and several cooler episodes, with CO2 varying from about 600 ppm to about 1500 ppm accordingly (Witkowski et al. 2018), but there was no glaciation in that time. Earth’s long-term climate (over millions of years) is governed by the balance between CO2 emitted into the atmosphere by volcanoes and CO2 removed from the atmosphere by weathering of rocks. This has prevented runaway climates and kept Earth’s climate generally habitable for about 4 billion years, but it can be outpaced by abrupt greenhouse gas releases (e.g. at the end-Permian mass extinction), or removals (e.g. “Snowball Earth” periods).
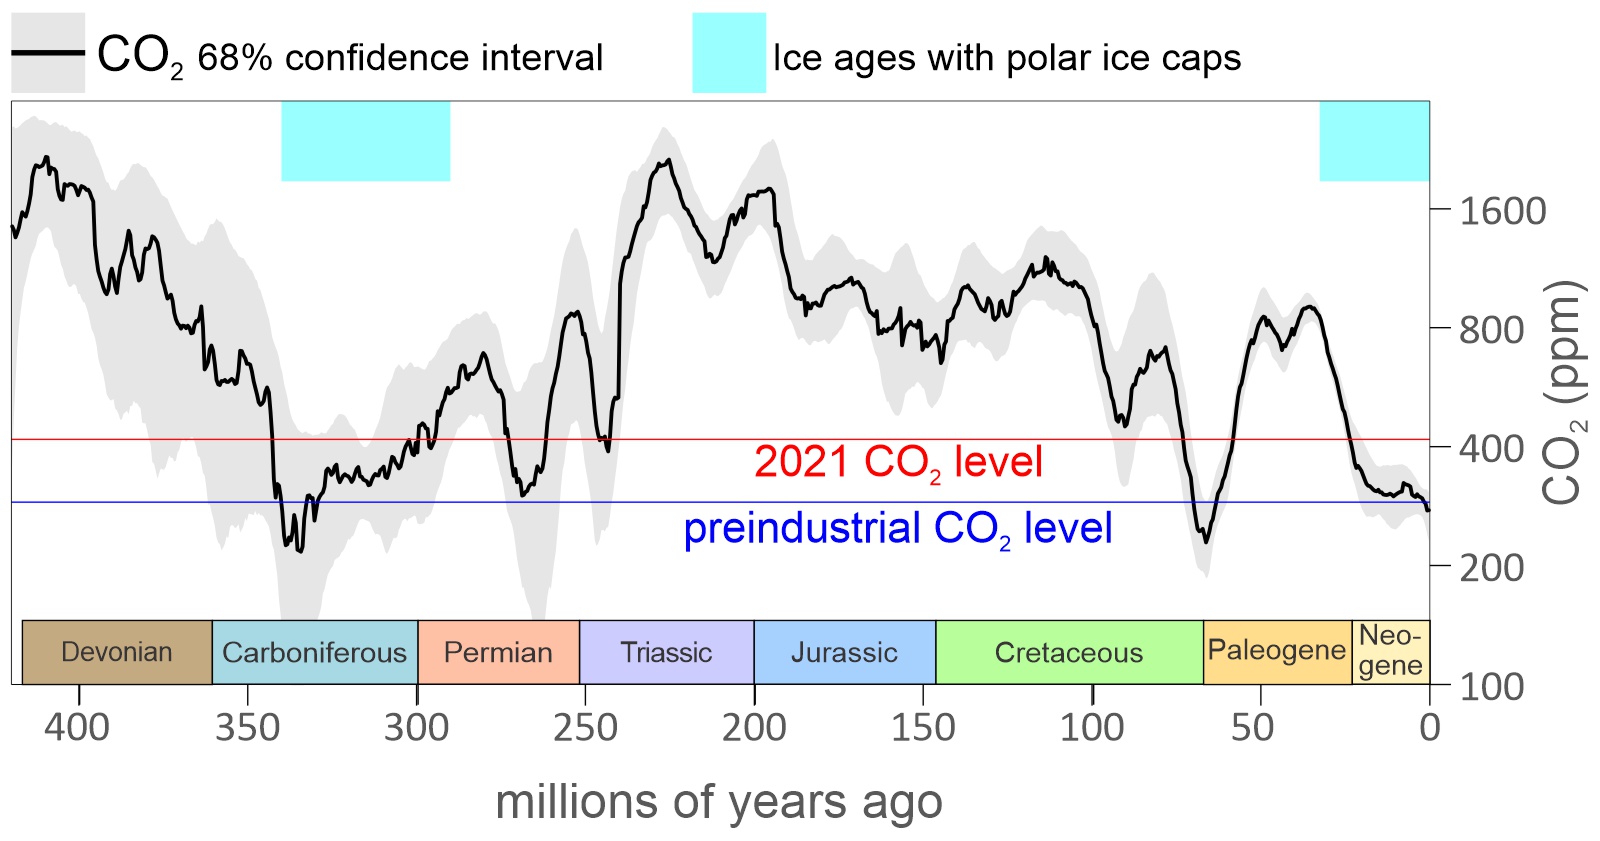
Figure 1. CO2 levels for the last 420 million years, showing periods with ice ages. Note this curve is smoothed and too low resolution to show spikes in CO2, eg at the end-Permian, end-Cretaceous, PETM, etc. Data from Foster et al. (2017). Late Paleozoic Ice Age per Rolland et al. (2019). Preindustrial CO2 278 ppm, 2021 CO2 420ppm (CO2.Earth). Newer data zooming in on the last 66 million years can be found on the intermediate tab.
Nevertheless, Earth's climate system has, for the most part, maintained a near-balance in terms of the overall habitability of the planet. This is despite periodic shocks of an internal (e.g. supervolcanic eruptions) or external (e.g. giant impacts) nature. That the key pre-human source of CO2 was volcanic activity and that volcanic activity is largely driven by plate tectonics is likely to be the key to this stability. Plate tectonics is a constant, ongoing process and probably has been for much of Earth history. That CO2 sources and sinks mostly do not stray too far apart - with the unique exception of human emissions - is very likely to be down to plate tectonics and its vital role in the Slow Carbon Cycle through geological time.
Last updated on 7 October 2023 by John Mason. View Archives


Wow. This topic just came up in the current Greenland melting discussion (#52) so I spent a few minutes looking at denial sites. Widespread indeed is the notion that very high CO2 in geologic past coincided with glaciation and that somehow negates today's relatively paltry 370 ppm CO2. Graphs like this abound: — from the "Frontiers of Freedom" website. There are a couple of very straight-forward holes in these denialist arguments. 1. Ordovician CO2 over 4000 ppm and glaciation proves CO2 doesn't matter! Nope: Look at the distribution of continental landmasses of the Ordovician (~450 MY). Those "glaciers" were the south-polar ice cap. There wasn't much in the way of land in the northern hemisphere. 2. Warming and cooling is purely cyclical! CO2 variation is natural! Sure, there are natural cycles. But something very important and very obvious changed over the geologic time scales involved that makes such simple comparison irrelevant: Plants. Lots of plants. Gymnosperms (conifers etc) originated in the late Devonian-early Carboniferous (380-300 Mya) and angiosperms (flowering plants) in the Cretaceous (100 Mya). All that carbon in the Carboniferous coalbeds? Dead plants that took CO2 out of the atmosphere. The downward trend apparent in the graph above from the Cretaceous forward? More plants. And now we've turned the downward CO2 trend around despite a world rich in plants... maybe we can hope that a whole new class of plant life comes to our rescue... but that would require evolution and the science is still uncertain on that too.