


 Arguments


New temperature reconstruction vindicates ...
Posted on 28 September 2010 by Ned
Guest post by Ned
A new temperature reconstruction has been published in the Swedish journal Geografiska Annaler: Series A, Physical Geography. The reconstruction (hereafter Ljungqvist 2010) covers the past 2000 years for the middle and high latitudes of the Northern Hemisphere.
This reconstruction includes a number of new proxies that have not been included in previous hemispherical or global temperature reconstructions, and avoids many of the proxies that have been the subject of contention in the past. The results are shown in Figure 1:
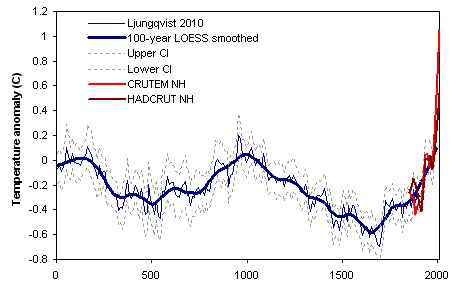 Figure 1. Extratropical (30-90 N) northern hemisphere temperature reconstruction by Ljungqvist (2010). Northern hemisphere instrumental temperature records shown for comparison (CRUTEM land only, and HADCRUT land/ocean).
Ljungqvist notes that this reconstruction shows a Roman Warm Period prior to AD 300, followed by a Dark Ages Cold Period (AD 300 to 800), a Medieval Warm Period (AD 800 to 1300), the Little Ice Age (AD 1300 to 1900), and modern warming in the 20th century. While there has been debate about how "globally consistent" these various warm and cold periods have been, they have long been recognized as prominent features of the extratropical Northern Hemisphere temperature record, so their appearance in Ljungqvist 2010 is not surprising.
Readers may wonder how this new reconstruction compares to previous hemispherical and global temperature reconstructions. In his conclusion, Ljungqvist (2010) reports that:
"Although partly different data and methods have been used in our reconstruction than in Moberg et al. (2005) and Mann et al. (2008), the result is surprisingly similar. The inclusion of additional records would probably not substantially change the overall picture of the temperature variability."
On the other hand, Craig Loehle claims that Ljungqvist's work vindicates his own previous "global" reconstruction (Loehle and McCulloch 2008, previously discussed elsewhere on this site). Writing on the website Watts Up With That, Loehle claims:
"In this post I demonstrate perhaps a little vindication [...] There is excellent agreement over the past 1100 years [...] My peak temperature occurs about 100 years earlier, but I agree with the new reconstruction [....] The MWP looks real."
So who's right? Does Ljungqvist confirm the results of Mann (2008) and Moberg (2005)? Or do his results agree with Loehle and McCulloch (2008)? Figure 2 provides a comparison of them all, starting in AD 500 (the earliest date in Mann 2008's global reconstruction), with the northern hemisphere instrumental record shown for comparison.
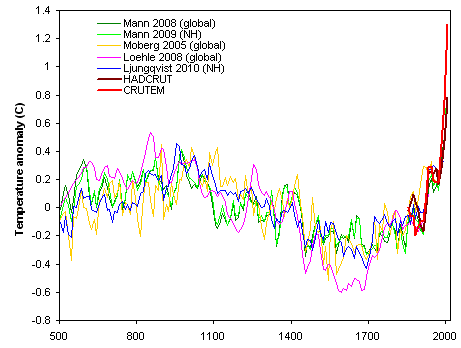
Figure 2. Comparison of northern hemisphere and global temperature reconstructions. Northern hemisphere instrumental temperature records shown for comparison (CRUTEM land only, and HADCRUT land/ocean).
It's worth noting that all the reconstructions show the Medieval Warm Period, the Little Ice Age, and 20th-century warming (though Loehle 2008 only runs through 1935).
Loehle's Medieval Warm Period is both warmer and earlier than the rest (and, as noted above, Loehle recognizes that his early peak circa AD 850 is probably incorrect). Loehle also shows a much colder Little Ice Age. All of the reconstructions diverge more in the period before AD 800, with Moberg being the coolest, Loehle the warmest, and Mann and Ljungqvist being in the middle of the pack.
When comparing Ljungqvist 2010 to Loehle 2008, it's important to remember that Ljungqvist's reconstruction is for the mid- and high-latitude Northern Hemisphere only, while Loehle's was supposed to be global. In this light, the presence of relatively extreme temperatures in Loehle's reconstruction during both the Medieval Warm Period and the Little Ice Age ought to be viewed somewhat skeptically. Whether or not these episodes were truly "global", they were certainly strongest in the Northern Hemisphere, particularly in the North Atlantic region. Ljungqvist 2010 suggests that his own reconstruction may have underestimated the magnitude of Northern Hemisphere cooling during the Little Ice Age, but Loehle's still appears to be an outlier if it is considered as a global reconstruction.
Finally, it's worth noting that comparison to the instrumental record suggests that modern temperatures are significantly warmer than those during the height of the Medieval Warm Period. Additional projected 21st Century warming will produce a climate unlike anything experienced in the history of human civilization.
Update (29 Sep 2010)
Several people have expressed interest in seeing how the various reconstructions compare to current temperatures (from the instrumental record). In order to do this, it's important to carefully "center" each reconstruction such that it matches the instrumental record as closely as possible during the period of overlap.
I've taken the three Northern Hemisphere reconstructions (Mann, Moberg, and Ljungqvist) plus Loehle's "global" reconstruction, and carefully matched each one to the same instrumental temperature record (CRUTEM Northern Hemisphere land temperatures). The results are in Fig. 3:
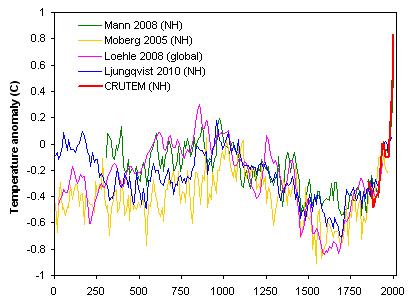
Figure 3. Comparison of temperature reconstructions, re-centered to match CRUTEM NH land record (based on each reconstruction's period of overlap).
Bit of a mess, eh? To focus on just the Medieval Warm Period and the Little Ice Age, I've pulled out the three warmest decades and three coolest decades in each reconstruction (during the period from AD 500 to 1900).
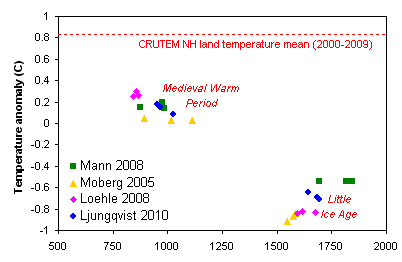
Figure 4. Warmest decades of the Medieval Warm Period, and coolest decades of the Little Ice Age, after re-centering each reconstruction to match the instrumental temperature record during the period of overlap.
Moberg is a bit on the cool side overall -- which might just mean it was anomalously warm during the calibration period used for centering. Mann and Ljungqvist agree very closely on the Medieval Warm Period, though Mann's Little Ice Age is not as cold.
Loehle manages to be both too warm and too early on the Medieval Warm Period and on the cool side during the Little Ice Age. This difference would not be all that noteworthy, except for the fact that Loehle 2008 is supposed to be a global reconstruction ... and the magnitude of the MWP-LIA difference should almost certainly be smaller for a global reconstruction than for a Northern Hemisphere one.
The other obvious point is that when we compare these to the current instrumental temperature record, the Medieval Warm Period seems to be about 0.7 degrees C cooler than the 2000-2010 mean temperature.


 0
0  0
0 -Alden


 Figure 4. Warmest decades of the Medieval Warm Period, and coolest decades of the Little Ice Age, after re-centering each reconstruction to match the instrumental temperature record during the period of overlap.
Moberg is a bit on the cool side overall -- which might just mean it was anomalously warm during the calibration period used for centering. Mann and Ljungqvist agree very closely on the Medieval Warm Period, though Mann's Little Ice Age is not as cold.
Loehle manages to be both too warm and too early on the Medieval Warm Period and on the cool side during the Little Ice Age. This difference would not be all that noteworthy, except for the fact that Loehle 2008 is supposed to be a global reconstruction ... and the magnitude of the MWP-LIA difference should almost certainly be smaller for a global reconstruction than for a Northern Hemisphere one.
The other obvious point is that when we compare these to the current instrumental temperature record, the Medieval Warm Period seems to be about 0.7 degrees C cooler than the 2000-2010 mean temperature.
Figure 4. Warmest decades of the Medieval Warm Period, and coolest decades of the Little Ice Age, after re-centering each reconstruction to match the instrumental temperature record during the period of overlap.
Moberg is a bit on the cool side overall -- which might just mean it was anomalously warm during the calibration period used for centering. Mann and Ljungqvist agree very closely on the Medieval Warm Period, though Mann's Little Ice Age is not as cold.
Loehle manages to be both too warm and too early on the Medieval Warm Period and on the cool side during the Little Ice Age. This difference would not be all that noteworthy, except for the fact that Loehle 2008 is supposed to be a global reconstruction ... and the magnitude of the MWP-LIA difference should almost certainly be smaller for a global reconstruction than for a Northern Hemisphere one.
The other obvious point is that when we compare these to the current instrumental temperature record, the Medieval Warm Period seems to be about 0.7 degrees C cooler than the 2000-2010 mean temperature.


Comments