Climate Science Glossary

Term Lookup

Enter a term in the search box to find its definition.

Settings

Use the controls in the far right panel to increase or decrease the number of terms automatically displayed (or to completely turn that feature off).

Term Lookup

Settings


All IPCC definitions taken from Climate Change 2007: The Physical Science Basis. Working Group I Contribution to the Fourth Assessment Report of the Intergovernmental Panel on Climate Change, Annex I, Glossary, pp. 941-954. Cambridge University Press.

Home Arguments Software Resources Comments The Consensus Project Translations About Support

Twitter Facebook YouTube Mastodon MeWe

RSS Posts RSS Comments Email Subscribe


Climate's changed before
It's the sun
It's not bad
There is no consensus
It's cooling
Models are unreliable
Temp record is unreliable
Animals and plants can adapt
It hasn't warmed since 1998
Antarctica is gaining ice
View All Arguments...


Username
Password
New? Register here
Forgot your password?

Latest Posts

Archives

Tai Chi Temperature Reconstructions

Posted on 6 July 2010 by Peter Hogarth

Guest post by Peter Hogarth

This article was inspired by Rob Honeycutts investigation into temperature reconstructions in Kung Fu Climate and follows on from previous posts on temperature proxies here and here.  One gauntlet often thrown down at the feet of climate skeptics is “ok, if you are claiming the proxy reconstructions are fudged, fiddled, or wrong, then why not create your own?”

Well, the idea of collecting as many proxy temperature records as possible and then generating a global time series might seem daunting, but, as a novice in the gentle Martial Art of commenting on and hopefully explaining the science of climate change, I thought I’d follow this process of temperature reconstruction through a little way, break it down, and see what trouble it gets me into.  I fear that both more specialised scientists and hardened skeptics will find much to criticize in the following simplistic approach, but from the comments on Kung fu Climate, I hope some readers who fit into neither category will find it illustrative and interesting.

There are all sorts of other common questions (some addressed briefly in the links above), for example about tree ring data, and about the Medieval Warm Period or “why can’t the proxy records be updated so as to compare with instrumental records?”  Can we touch on these issues? Maybe a little…

First, which proxy data to use?  I guess I need a few records, from as global a geographic area as possible, not so few as to be accused of cherry picking, and not so many that I have to work too hard…  Also I didn’t want to pick a set of records where the final output reconstruction was already generated, as I could be accused of working towards a pre-determined outcome…In addition, I wanted as many records as possible which included very recent data, so that some comparison to the instrumental record could be made.  What to do?

Fortunately, there is a recent peer reviewed paper that lists a manageable number of proxy records, and doesn’t try to generate a composite global record from them, Ljungqvist 2009 “Temperature proxy records covering the last two millennia: a tabular and visual overview”. This describes 71 independent proxy records from both Northern and Southern hemispheres, covering the past two thousand years, a fair proportion of which run up to year 2000, all of which have appeared in peer reviewed papers, and 68 of which are publicly accessible.

First we have to download the data.  This is available here from the excellent folks at the NOAA paleo division.  This can be loaded as a standard spreadsheet, but remember to remove any “missing data” (represented by 99.999) afterwards.   Note that 50 of the records are proxy “temperatures” in degrees Celcius, and 18 records are Z-scores or sigma values (number of standard deviations from mean). The records are from a wide range of different sources, including ice cores, tree rings, fossil pollen, seafloor sediments and many others.

Next, we should have a quick look at the data. Ljungqvist charts each time series individually, and it can be seen that many of the charts provide ample fodder for those who wish to single out an individual proxy record which shows a declining or indifferent long term temperature trend.


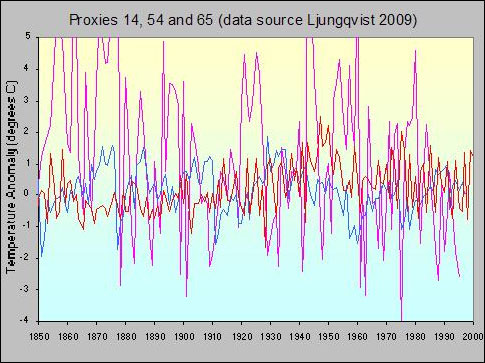
A zoomed in small selection of individual proxy records showing the high variance in many individual time series (note the wide temperature scale).

The approach of taking one or a few individual time series in climate data (such as individual tide station records) is often used (innocently or otherwise) to question published “global” trends. A cursory glance at these charts has justified a few “skeptical” commentators citing this paper on more than one blog site. My initial thoughts on looking at these charts were simply that this would be, well,  interesting. 

We must also check the raw data, as at least one of the time series contains an obvious error which is not reflected in the charts (clue, record 32, around year 1320).  This will be corrected soon.  For now we can rectify this by simply removing the few years of erroneous data in this series.

Now, some of these records are absolute temperature and some are sigma values.  We will put aside the Z-score values for now and look at the 50 temperature proxy records. We have to get them all referenced to the same baseline before attempting to combine them.  To do this, we can simply subtract the mean of a proxy temperature time series from each value in this series to end up with an “anomaly”, showing variations from the mean.  The problem here is that some records are longer than others, so one approach to avoid potential steps in the combined data is to use the same range of dates, using a wide range which most records have in common, to generate our mean values for each time series.  This also works for anomaly data sets in order to normalize them to our selected date range.  Here the range between year 100 and 1950 was selected, rather arbitrarily, as representing the bulk of the data.

Now we have a set of temperature anomaly data with a common baseline temperature.  How do we combine them?  At this stage we should look at missing data, interpolation within series, latitudinal zoning effects, relative land/ocean area in each hemisphere and geographical coverage, we should then grid the data so that higher concentrations of data points (for example from Northern Europe) do not unduly affect the global average, and bias our result towards one region or hemisphere, and also try to estimate the relative quality of each data set. This is problematic but is necessary for a good formal analysis.  The intention here is not to provide a comprehensive statistical treatment or publish a paper, but to present an accessible approach in order to gain insight into what the data might tell us in general terms.

Therefore I will stop short and suggest a quick and dirty “first look” by simply globally averaging the 50 temperature results.  I must emphasise that this does not result in a true gridded picture.  However averaging is a well known technique which can be used to extract correlated weak signals from uncorrelated “noise”.  This simple process will extract any underlying climate trend from the individual time series where natural short term and regional variations or measurement errors can cause high amplitude short term variations, and should reveal something like a general temperature record. Due to the relatively large number of individual records used here, we might expect that this should be similar to results obtained from a more comprehensive and detailed analysis. However we must accept that biases caused by the limited geographic sampling, unequal spatial distribution, or over-representation of Northern Hemisphere data sets will be present in this approach.

Given the caveats, is a result of any merit? as a way of gaining insight, yes.  If we accept that any average is only a useful “indicator” of global thermal energy, we can cautiously proceed, and as we add the individual records to our average, one after the other, we see evidence that some data series are not as high “quality” as others, but we add them anyway, good, bad, or ugly.  Nevertheless, the noise and spikiness gradually reduces and a picture starts to emerge.


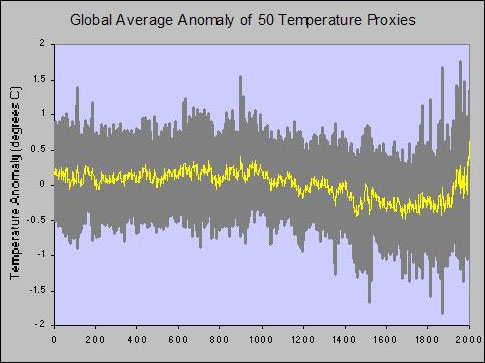
Average of 50 temperature proxy records, with one standard deviation range shown

Now, the fact that this resembles all of the other recent published reconstructions may (or may not) be surprising, given the unpromising starting point and the significant limitations of this approach. The Medieval Warm Period, Little Ice Age, and rapid 20th century warming are all evident. Remember for a second that these are proxy records which are showing accelerated recent warming. We have not hidden any declines or spliced in any instrumental data.  We can remove data sets at will, and see what changes.  If the number of removed series is small, and are not “cherry picked” we can see that the effect on the final result is small and that many of the features are robust.  We can also look at correlating the dips with known historical events such as severe volcanic eruptions or droughts.  This is beyond the scope of this article, but this topic is covered elsewhere.

There are many more proxy records in the public domain, which offer much better coverage allowing the data to be correctly gridded to reasonable resolution without too much interpolation.  Adding more records to our crude average doesn’t change things dramatically for the Northern Hemisphere, but would allow higher confidence in the result.


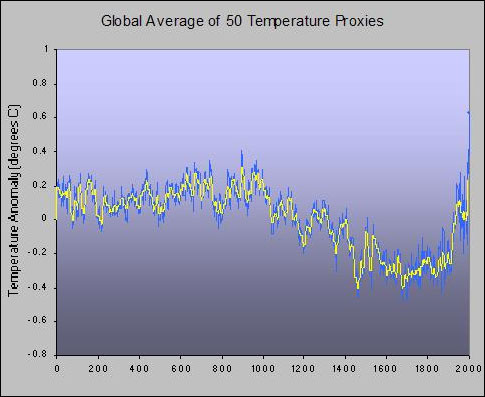
Average of 50 temperature proxies, annual values and ten year average with error bars omitted for clarity.

Now, to complete this illustration let us zoom in and look at the instrumental period. Not all of the proxy time series extend to 2000, although 35 extend to 1980.  We would expect from our previous discussion that the variance would increase if less samples are available as we get closer to the year 2000, and this is the case.  26 of our proxy records cover the period up to 1995, 10 of which are sigma values.  Only 9 records have values for year 2000, and 4 of these are sigma values.  Can we make use of these sigma values to improve things?  We could easily convert all of our records into sigma values and then compare them, but many readers will be more comfortable with temperature values.  We  could perhaps track down the original data, but in the spirit of our quick and dirty approach we could cheat a little and re-scale the sigma values given knowledge (or an estimate) of the mean and standard deviation…this isn’t clever (I do appreciate the scaling issues) but for now will give an indication of whether adding these extra samples is likely to change the shape of the curve.  The original temperature derived curve from 50 proxies and the new curve derived from information in all 68 series are both shown below.  There are some differences as we might expect, but the general shapes are consistent.

The versions of the zoomed proxy record again look vaguely familiar, they show a general accelerating temperature rise over 150 years, with a mid 20th century multi-decadal “lump” followed by a brief decline, then a rapid rise in the late 20th Century.


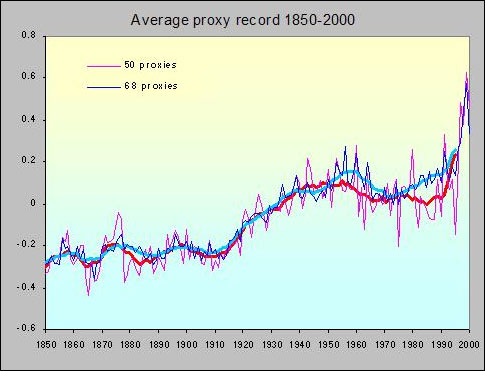
Proxy record 1850 to 2000. As not all records extend to 2000, the “noise” increases towards this date. If we use all of the available information we can improve matters, but the general shape and trends remain similar

We can compare this reconstruction with global temperature anomalies based on the instrumental records, for example HadCRUT3.  In the instrumental record we have full information up to 2010, so our ten year average can include year 2000 showing the continuing measured rise.   Given the standard deviation and tapering number of samples in our very preliminary reconstruction it appears to be reasonably representative and is surprisingly robust in terms of lack of dependence on any individual proxy series.


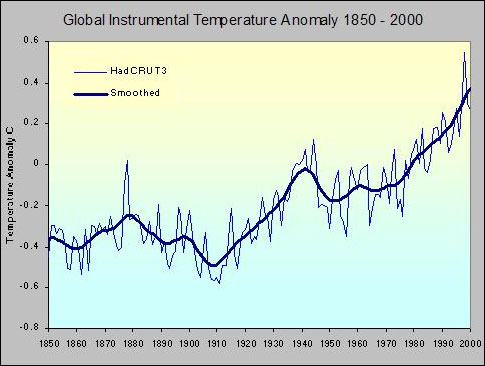
Global Instrumental temperature record, HadCRUT3, 1850 to 2000, annual average values and longer term average shown.

So, was the medieval warm period warm? Yes, the name is a clue.  Was it warmer than the present?  Probably not, especially given the last decade (after 2000) was globally the warmest in the instrumental period, but it was close in the higher latitude Northern Hemisphere.

Does the proxy record show natural variation? Yes.  There is much debate as to why the Medieval Warm Period was warm, and over what geographical extent, but there is evidence (for example in all of the high resolution Greenland Ice core data) of a longer term general slow long term declining trend in Greenland, Arctic (Kaufman 2009), and probably Northern Hemisphere temperature believed to be due to orbital/insolation changes over the past few thousand years.  This trend has abruptly reversed in the 20th century, and this is consistent with evidence of warming trends from global proxies such as increasing sea level rise and increasing global loss of ice mass.

Does the proxy record in any way validate the instrumental record, given some skepticism about corrections to historical data?  To some degree, but I would argue that it is more the other way around, and it is the instrumental record which should be taken as the baseline, corrections and all.  The proxy records are simply our best evidence based tool to extend our knowledge back in time beyond the reach of even our oldest instrumental records such as in Bohm 2010. Taken as a whole the picture that the instrumental records and proxy records present is consistent (yes, even including recent work on tree rings, Buntgen 2008)

For more comprehensive analyses, I will hand over to the experts, and point to the vast amounts of other data and published work available, some of which Rob cited.  The more adventurous may want to examine the 92 proxies and other proxy studies that NOAA have available here, or look at the enormous amounts of proxy data (more than 1000 proxy sets), the processing methods and source code of Mann 2009, or see Frank 2010, which is also based on a huge ensemble of proxy sources. The weight of evidence contained in these collected papers is considerable and the knowledge base expands year on year.  Simply put, they represent the best and most detailed scientific information that we currently have about variations in temperature, before we started actually measuring it.

0 0

Printable Version  |  Link to this page

Comments

1  2  Next

Comments 1 to 50 out of 73:

  1. very nice indeed Peter. Your recent articles here have taken analysis to a level that beautifully bridges the gap between the layman and the science, and helps to show that the gap isn't as large as one might think. Can you clarify the difference between the 2nd and 3d figures? It's not obvious to me what you've done differently to the data in these two graphs. P.S. it would be worth adding Figure no's (i.e. Figure 1; Figure 2 etc.) to the figure legends since the figures are bound to be referred t in the comments...
    0 0
  2. Thanks Peter, The 2nd and 3rd figures both say 50 record but the 3rd is meant to be 50 plus an unstated number. This an error? Out of suspicious curiosity could you show just the non-NOAA average.
    0 0
  3. Reading good analyses always feels drinking drinking cool, clear water. Reading bad ones is like eating mud. This is great.
    0 0
  4. I personally have no problem believing that world climate has warmed some (within the last 50 years), the most obvious proxy being the trend in Artic ice breakup and glaciers generally receding. On the other hand, temperatures around the world vary nominally within a range of about 50 degrees C, so in order to use proxies to detect a global anomaly of one degree, they would require linear accuracy of less than one degree for this full range.
    0 0
  5. The primary disadvantage of most of the reconstruction is over-smoothing (especially multi-proxy). How to avoid this, I recommend: http://www.rni.helsinki.fi/research/info/sizer/.
    0 0
  6. chris at 21:30 PM on 6 July, 2010 Difference is that the error bars are removed, which allows vertical scale to be zoomed a little, and annual and ten year averages are shown superimposed. Otherwise they are the same. HumanityRules at 21:34 PM on 6 July, 2010 The text is correct, there are 50 records given as temperature values which are easy to average in this simple approach, the other 18 are Sigma values, which are difficult just to add in (though I try to show an indication of how this may affect the average in the 1850 to present chart), the remaining 3 are not publicly available, though Ljungqvist gives visual charts of them.
    0 0
  7. RSVP at 22:22 PM on 6 July, 2010 Yes, this is partially the point. Lots of averaging should extract any common signal from noisy data. Of course official reconstructions do a lot more than this, but I hope the general idea gets across.
    0 0
  8. How does one deal with proxy series which do not overlap in terms of the anomaly calculations. For example if only 15 of the 50 overlap but some extend further and so on? Would one use a standardization formula such as (X value - Mean of whole series)/ Standard Deviation of whole series?
    0 0
  9. RSVP at 22:22 PM on 6 July, 2010 Your argument isn't quite right RSVP. Although global temperatures have a large (especially latitudinal) variability, the yearly (or decadally) averaged temperature at a single location on Earth doesn't vary that much. Since all proxyreconstructions (Peter's included) determine a temperature anomaly, the large intraEarth variability isn't so relevant. Where it is relevant relates to the likelihood that there are location-specific responses to forcings. These do have a significant latitudinal dependence (e.g. polar amplification, and any response that involve significat changes in thermohaline circulation that carries heat to the high Northern latitudes, etc.). We are still in the situation that the S. hemisphere is poorly represented in paleoproxyreconstructions.
    0 0
  10. which leads me to another question for Peter: Your Graphs 2 and 3 are depicted as "Global Average Anomaly of 50 Temperature Proxies". To what extent are these actually "Global" and opposed to N. hemispheric? i.e. what is the proportion of S. hemisphere proxies in the data? My understanding is that if one is sampling the past 2 millenia, the number of S. hemisphere proxies is very small.
    0 0
  11. rway024 at 23:14 PM on 6 July, 2010 In my simplistic case, I am relatively lucky in that so many of these proxies overlap over considerable periods, and it is only the tapering of record density in the last century that presents problems. Here I used a long common period (of most of the record) for simplicity. This should standardise things to a good approximation and still allow us to average the extended records. I guess a standardisation formula could be used, but I'll try to have a look at the exact methods used in the official reconstructions.
    0 0
  12. There is at least one problem with your analysis that needs mentioning. -Generally speaking, with any type of scientific measurement, the further one goes back in time, the more smoothed, smeared, uncertain, and 'averaged out' the entire process becomes, from methodological selection, sample selection, collation, and interpretation, to the very response of the proxies themselves and the natural limits to the data that can be measured and inferred. Mathematicians usually fail to fully understand and appreciate this sort of thing; that their data contains a lot of structure, or in the words of Enrst Mayr when referring to the genotype as a whole, ‘cannot be understood by a purely reductionist approach’. I would contend that your analysis is largely reductionist, in that it ignores the basic structural features, limitations and variations that occur within any large scale proxy analysis. Most (all?) proxies you care to consider, whether response of corals to temperature shifts, or red shifts in galaxies, or radioactive dating in ancient rocks, will tend to exhibit a lagged/smoothed response to any rapid-real time fluctuation, such as temperature, and this smoothing will tend to increase the further one goes back in time, which therefore means that any comparison with actual measured (not proxy) temperatures, and proxies, particularly ywith regards to changes and variations in slope, is always misleading. Observations are always sharper than a response to a fluctuation, which is then collected and measured, and collated and compared over time; whether in proxies, or elsewhere. For this reason alone, one can't make the conclusion the recent temperature changes are faster than any former temperature changes in eg the last 2,000 years, (ie 'unprecendented') because one is a real time, direct, measurement (measured temperature in recent centuries), and one is a biological/ biochemical response to a fluctuation, which has to be selected (researchers bias), collected (sample contamination and availability), ‘inferred-measured’(significant figures and error bars change with time, and with differential response to short term fluctuations), and finally, submitted to mathematical analysis (including averaging out already-smoothed proxies, even further),and placed alongside and compared with real-time observations. It is no wonder that such reconstructions give a sharp slope in recent, measured, centuries compared to a flattened slope with older data, anyone who is familiar in the field (not in a air conditioned office) with limitations to proxy collection and analyses will tell you that you can get this sort of graphical features with virtually any averaged out collection of inferred times- series analysis, and the further back in time one goes, the stronger it gets. You don't even have to splice datasets to confront this kind of problem, any time series analysis of proxies will tend to exhibit a smearing of response/delineation of measurement, the further one goes back in time, and even more so if one then averages out the data between many types of proxies-all this does is further flatten older proxy responses compared with more recent ones. To repeat, proxy error bars increase with age, and the more error bars one ‘averages out’, over a longer and longer time period, the more smoothing occurs, compared to both more recent proxies and actual recent observations.
    0 0
  13. That shape in those graphs of temperatures over the last 2000 years, they look like, er, hockey-sticks. Shall we call them 'hockey-stick graphs'...
    0 0
  14. chris at 23:22 PM on 6 July, 2010 You are absolutely correct and I don't want to mislead here. Global is really a misnomer. There are only eight SH proxies here, and only a further eleven from the Equator up to 30 degrees N. In the text I try to highlight that this is not a true gridded, weighted, interpolated, output. The averaged data is biased heavily towards the NH, and probably Northern Europe, and reflects a bias in the coverage of proxy records in general. Some of this is due to the nature of proxy records and different ratio of land mass to ocean, NH to SH.
    0 0
  15. thingadonta at 23:31 PM on 6 July, 2010 I agree with your general comment about uncertainty increasing with age for some of the proxies, but for many here the measurements are extracted from within an annual layer, or equivalent, and barring other factors give high resolution. (For your information, I have recently got back from field operations, though not directly related to this topic). I have not seen many smeared tree rings or stalagmites or sea bed cores. If you have specific evidence on this, please give references. What you are arguing is that all historical trends tend to some imaginary zero as we go back in time? please think this through and explain how this comes about again? Ice cores anyone?
    0 0
  16. Peter Hogarth at 23:29 PM on 6 July, 2010 Thanks, I've been looking into the topic myself because i've run into this problem in the past and I don't really know what to do. I tried one method which calculates anomalies based upon the entire series but with each series having different lengths it introduces large biases. I don't know which standardization formula to use really or if that is even the practice I should undertake. Thank you for your help though.
    0 0
  17. Peter... You honor me greatly, most respected si fu (master). Looking at paleo climate charts I'm always struck by one thing. How it's almost impossible to get an unbroken perspective on current warming relative to historic warming. For the science crowd it's not a problem. This chart of shorter time scale picks up where the other chart of longer time scale leaves off. But for the broader lay person it creates a discontinuity that doesn't always translate. Take your figure 3. The current temp trend is SO vertical that it disappears along the side. I know you pick it up in the following charts but you've just published a chart that any climate "skeptic" can take out of context and say, "See, Peter Hogarth even says that we're not warmer that the MWP. Here's his chart." I believe Michael Mann does a pretty masterful job in presenting his charts in various clever ways that generally manage to avoid this. Of course he has funding and you're doing a blog post on your own nickel. The very best charts, IMHO, are the animated charts being created by NOAA for the Time History of CO2 which were reported on SkS here. This is an amazing reconstruction job you've done, Peter. (I love this stuff!) The one chart I'm longing to see, though, is this temperature reconstruction you've done in the style of NOAA's animated chart. Or, even better, the two overlaying each other. Temp and CO2. With a good narration I think this would be one of the most compelling graphics created on the issue of climate change. Unfortunately it's a task that is well outside of my own skill sets.
    0 0
  18. Very nice post. I´d like to see more "playing around" with the data like this. It would be nice to see the difference between northern and southern hemisphere, or how robust the series is to different proxy choices, or how geographic distribution changes the result. In fact, if I find the time I´ll try some experiments myself. Thanks, Peter!
    0 0
  19. Peter, the fact that your reconstruction resembles most others is not surprising. Doing reconstructions such as you have done is similar to the situation with analytical laboratories around the world. Irrespective of whether the laboratory is testing blood and urine samples, or bulk materials, once the sample has been taken, it could be sent to any reputable laboratory anywhere in the world and the results should be all the same. The reason for this is that the methods used are all calibrated against the same bench mark, and this will be the case here too. All proxy reconstructions have to be calibrated against a known benchmark, and for proxy temperature reconstructions, that will have been the instrumental temperature record. Getting back to the laboratory analysis, if the results are doubted or subject to dispute, as does happen at times if the results form of a commercial arrangement, then there is little point in ordering the samples to be retested, or tested in another laboratory as procedures are such that all laboratories will generally produce the same results. If there is a real problem, it will be that the sample provided is not truly representative, and the solution is to collect a new independent sample and analyse that. The problem with doing temperature reconstructions is where do you get an independent sample that has not been validated against the same benchmark as every other sample? When a reconstruction is done that produces results similar to other reconstructions, what is really being proved is that the method used to produce the results is probably correct given it is basically the same samples that are being analysed. This is basically the same as doing "round robin" testing where one sample is tested by a number of laboratories to confirm that their in house procedures are in line with each other, and the industry standards. Such exercises do nothing to confirm or otherwise that the sample tested is indeed a representative sample of the what it was sampled from originally.
    0 0
  20. Fascinating trend. Nice work! Assuming it stands up to more rigorous treatment, the "smoothed" global trends are quite interesting. The author, Peter Hogarth, has been understandably careful about drawing any conclusions regarding causation, but Commenters arguably have greater liberty to consider this trend in the context of what is presently known about climate drivers (w.r.t. temperature, in particular). There is no significant energy source for warming the atmosphere and hydrosphere other than the sun, so we can limit the possible controls to two categories: 1) Variation in the amount of solar energy entering the atmosphere, and 2) Variations in the amount of solar energy retained (until the rates of emission and absorption are balanced, (any "missing heat" notwithstanding!)). The controls for past variations are uncertain. The present warming, however, is largely driven by the ever increasing concentrations of GHGs, together with associated feedback mechanisms, there being no evidence (so far, at least) that any other factors have played a significant role. We are left to speculate (or to investigate!) how the 1000 year trend from 900 to 1900 might have continued if it had not been influenced by human activity. Could anthropogenic CO2 have rescued us from continued cooling? More important, how will the unprecedented introduction of massive quantities of CO2 affect future warming? To the extent that we may have the ability to "tweak" Earth's climate in the future, it's a fascinating, and extremely important question.
    0 0
  21. johnd - I'm a little confused as to what you are getting at here. You (correctly) note that proxies are calibrated - for example establishing how growth rings vary with temperature. There have been in the past a few issues with calibrations for forensic and other samples, but not often - ground truth has a tendency to correct these errors over time. The only thing I can read into your post is an assertion that 50+ different proxies could be so poorly calibrated as to throw off the averages. Given that each of these paleotemp reconstructions has it's own calibration, experimentally determined by separate groups from multiple disciplines, I think there are more than enough independent samples to make this kind of reconstruction reasonable. "When a reconstruction is done that produces results similar to other reconstructions" - perhaps, just perhaps, they're accurate reconstructions!
    0 0
  22. johnd - you seem to be suggesting that somehow, by calibration to a 150 year temperature record, 2000 years of variations can be 'forced' to have a particular shape (do you mean the 20th Century 'uptick')? This is obviously crazy. If that were the case, you would get unusually good correlations during the instrumental period, and the relationships would degrade spectacularly as you headed back into palaeoclimate. Peter Hogarth's excellent graphs show this specifically not to be the case. That they don't diverge indicates no specific calibration directly to the temperature record. Each method will have its own calibrations, such as oxygen isotopes for the ice core records. but that does not force each reconstruction to have the same features, as you are suggesting. The reconstructions are free to vary dependent on the palaeo data, not on some forced 'fit'. That they can be simply averaged in this way shows that these methods and samples are providing generally the same pattern independently of each other. This is utterly different to carrying out a reanalysis of a urine sample. The parallel would be to take the same series of raw tree rings and sending it to different labs to produce a reconstruction - each lab ought to produce a very similar curve based on that specific sample. Another set of tree rings might produce a quite different curve, applying the same methods. Generally, the different curves have similar features, as Peter has identified, suggesting something about palaeoclimate.
    0 0
  23. skywatcher, your parallel is virtually what I was saying. The point being that more labs coming up with the same results only confirms that the methods used to process the data only confirms that they all use the same methodology given it is all the same raw data. It really is not confirming whether the data is a representative sample or not. Thus it is no different to carrying out a reanalysis of a urine sample. Your use of tree rings as an example is very relevant. The Briffa tree ring reconstruction began to diverge where the very highest quality data obtainable was available to validate all the assumptions made and equations developed inputted into the reconstruction model. ..................... KR, your last sentence also agrees with what I was saying. Repeated processing of the same sample only provides confirmation that the methodology used to process it is consistent with all other methods that produced the same results. Peter has obviously put a lot of effort into producing the work, and my response was to his own comment, "the fact that this resembles all of the other recent published reconstructions may (or may not)be surprising" I felt that the results were not surprising and set out to explain why I thought that. Perhaps anyone who found the results surprising can explain why they found them so.
    0 0
  24. johnd, One of the skeptic arguments that this post is addressing is that the reconstruction data is "fudged" to produce a particular result. Peter's confirmation of the methods refutes that point. Someone holding this point of view may indeed find Peter's results surprising.
    0 0
  25. johnd - my last sentence in my previous post was stating that perhaps the similarities in reconstructions (from various sets/subsets of proxy data) indicate that they are correct. There is independence in the samples - oxygen ratios in ice cores are calibrated completely differently from borehole temperatures, from tree ring analysis (which I have worked on a bit), stalagmite growth, etc. That really invalidates your assumption of everything being calibrated to the same benchmarks, and hence suffering from a common mistake. There is sufficient independence in the sample set.
    0 0
  26. I'm kinda opening up this question for anyone here. How does one calculate anomalies if considering multiple records which do NOT ALL or mostly cover the anomaly period? Kinda working on something and having a trouble figuring it out myself
    0 0
  27. Nice romp Peter, thanks.
    0 0
  28. @Johnd and others Peter has provided an independent and idiosyncratic analysis of published data. That is a meaningful and a helpful contribution to understanding the data. If your complaint is with the data, go get some of your own that meets your standards. Then present your analysis of it. Perhaps then those results will "surprise" you or not. I doubt Peter was aiming to surprise anybody, I suspect he was trying to understand the data in his own terms. That is a human virtue, I think, and I am glad he shared his experience.
    0 0
  29. johnd, I can only repeat what KR has said - you are utterly incorrect if you think I was saying the same thing as you. The samples are independent - think lots of different urine samples, to use your analogy. Processed by different methodologies, depending on the type of urine sample (OK I have to stretch it here, wee is just wee), but in a standard manner for the relevant methodology. This leaves bags of room for all sorts of results. Wildly varying results with no consistent conclusion - definitely not the case here. How about a consistent conclusion that bears no resemblance to either the instrumental record and previous palaeo-reconstructions? No again. How about a record that is relatively consistent, and bears a resemblence to such records, as Peter has neatly shown. There is no pre-determined outcome. As Donald Lewis says, if you doubt the original data (the individual wee samples), then go and get your own samples and show why the original samples are pre-determined to give a result. If the methodology pre-determined the result, there would not be curves like #2 (Lake Toskaljavri) or #17 (Lake Flarken), which don't show the bent 'hockey stick' of Peter Hogarth's analysis.
    0 0
  30. johnd at 08:10 AM on 7 July, 2010 I believe proxies are calibrated for offset and scale, but I don't think they are de-trended. I agree tree rings are relevant, but I disagree with your summary “The Briffa tree ring reconstruction began to diverge” etc. The divergence "problem" has been known for a while. It is important to resolve it. Buntgen, Esper, and other researchers have responded to this head on with new work, new evidence and more comprehensive data, which is the way things should work. Their new evidence moves on from the divergence problem, and addresses the issues leading to it arising in the first place. Please read the references below. If your current position is as you state, then it is probably time to modify it in the light of new or emerging evidence. Perhaps you may even be surprised. Science moves on. On recent work on proxy tree ring data showing no divergence Buntgen 2008. On new research into altitude related growth patterns, Moser 2009. On the divergence problem specifically Esper 2009 and for an updated analysis which specifically addresses contentious Siberian tree ring data, Esper 2010.
    0 0
  31. "I have not seen many smeared tree rings or stalagmites or sea bed cores." I know from my field, that radiaoctive decay resets with metamorphism, and there are also problems with data collection and verification. It gets worse in disturbed terrains, and in older rocks. I am not a tree ring specialist, but sometimes an outsider might spot a few issues that insiders might take for granted. Here are some suggested problems with tree rings and T reconstuctions from an amatuer in another field (geology), just off the top of my head. Are any of the following true I wonder? -There isn't always a one-to-one correlation with tree ring width, colour, mineralogy etc; and temperature. (Big red flag number one). -Trees are selected which are by nature robust over long periods of time to begin with (so they can show very long time periods), and are therefore not sensitive to small-period fluctuations. This is a sample selection problem. That is, if a tree is highly sensitive to small T changes, it dies and produces no tree rings, and therefore will not show up in the data-result is you get smoothing of data the futher you go back in time, and the more robust trees become over-represented. -Volcanic events, fires, bugs, human settlement, slash and burn, and changes within the tree itself, alter the shape and nature of the rings with time. Ie. Earlier rings get metamorphosed with time, both by internal tree factors, and external factors. Again, age makes it worse. -Researchers who study tree rings are a small nit group who are almost exclusively looking for a story. (Research bias) -Access to tree ring data, (as is usual for academics still living in the dark ages), is not available. Requests are ignored. (Research bias). -Tree ring data is handed over to mathamaticians who have no understanding of these sort of issues and massage the data, thinking its all the same anyway, and will average out, just like sub prime mortgages. -
    0 0
  32. thingadonta wrote : I know from my field, that radiaoctive decay resets with metamorphism, and there are also problems with data collection and verification. It gets worse in disturbed terrains, and in older rocks. And yet most rocks are dateable, aren't they ? Or are there areas of the world that cannot be dated because of the problems you mention ? I'm sure Creationists could come up with lots of arguments about problems in dating rocks but surely you would be able to show them that, in the main, dating techniques and interpretation are correct ?
    0 0
  33. thingadonta at 20:28 PM on 7 July, 2010 thingadonta, your post says essentially nothing about this subject. Note that "radioactive decay" certainly doesn't "reset with metamorphism". If one uses a radioactive dating technique like potassium-argon dating where analysis requires measurement of trapped gas (e.g. argon) in rocks, then the dating "clock" is reset upon metamorphosis (the gas is released when the rock melts). But that's of little relevance to paleoproxy analysis covering the past 2 millenia. In that case radiocarbon decay is likely to be used. Metamorphosis in the geological sense isn't relevant to dating on the millenial timescale Metamorphosis in the sense of conversion of carbon to graphite or charcoal, doesn't perturb the dating analysis. If one considers longer timescales (e.g. uranium-thorium dating of speleothems/stalagmites or coral), the question of metamorphosis is likely to be of little relevance since the intactness of the coral or stalagmite can be assessed by inspection. The same applies to cores. Otherwise your list is simply a set of "what if's" that the scientists engaged in this research will certainly have considered. Indeed, one could take your approach to any topic. For example I might display some skepticism over your suggestion that you are going to drive to the seaside this weekend: Here are some suggested problems with your trip from an interested onlooker, just off the top of my head. Are any of the following true I wonder? - Your car might be out of petrol. For example even though you filled it up yesterday, someone might have siphoned your tank during the night. - Someone driving carelessly might have ripped off one of your wing mirrors. - You might have a flat tyre and your spare may be bust. - You may be unable to find the way. Even 'though you think you know the route there have been some changes in the roads, and there may be some unexpected diversions. - You have to go over a couple of bridges on the way to the seaside and one of these might be closed, or may even have fallen down. etc. etc. ad nauseum And no doubt you think we should make an effort to find imaginary flaws in the findings of heart surgeons, or scientists trying to understand the genetic basis of Huntington's disease, or nanotechnologists, or cancer researchers etc. because: Researchers who study these things are a small nit[*] group who are almost exclusively looking for a story. (Research bias) small "nits" thingadonta? Were you thinking of head lice.....?
    0 0
  34. And another thing, thingadonta... do you really mean "Tree ring data is handed over to mathamaticians", or is it really handed over to statisticians? There's a big difference. Also, your remark about subprime mortgages is, as far as I can see, completely irrelevant. How many practising academics (mathematicians or otherwise) were involved in assessing subprime mortgages?
    0 0
  35. thingadonta at 20:28 PM on 7 July, 2010 Metamorphism over past 2000 years in sediment cores? please, I have some hands on experience and knowledge of Geology and GeoPhysics, and so do many people analysing core samples. "I am not a tree ring specialist", agreed, this is clear, (neither am I), but you could improve your understanding by reading the references, finding more, or asking intelligent questions rather than framing whimsical questions which demonstrate your own bias.
    0 0
  36. On a more tangential note, it's good to see that yet another enquiry (The Independent Climate Change E-mails Review under Muir Russell) has exonerated the scientists and the science. I'm sure thingadonta will join us in congratulating Phil Jones and the rest of the team. Shame the so-called skeptics have already decided this would be a whitewash - like every other enquiry they don't like the result of...
    0 0
  37. thingadota - Seriously, that's quite the laundry list of "maybe/coulda/might have" issues with dating analysis. Every scientist in every field looks at their calibration issues - whether it's O2 isotope analysis, tree rings, core sample microbe prevalence, boreholes, etc. A random list of possible mistakes just indicates that you haven't dated the samples you're complaining about. And metamorphic rock changes are hardly an issue when examining proxies for the last 2000 years! For those who are interested, I previously posted something on tree ring analysis on the Kung Fu Climate thread. There are some very straightforward ways of correctly overlapping tree ring datings to extend the timeline past an individual tree lifespan, and given some knowledge about how the studied species responds to temperature, sufficient data to average out/correct for variations in water levels, insolation, etc., you can examine the temperature effects over time on tree growth.
    0 0
  38. Looking at my previous post I realized I had left something out - using exponential fitting to align different trees into a single record looks like it might wipe out absolute differences. You get (as I understand it) absolute growth differences by comparing the thickness of equivalent rings (say, the 15-year ring) on trees of different eras, and by scaling the entire record according to lifespan overlaps and relative thicknesses at those overlaps.
    0 0
  39. Plevy asks "How many practising academics (mathematicians or otherwise) were involved in assessing subprime mortgages?" A number of them and many did not see anything wrong, because they didn't want to. However, Nassim Nicholas Taleb and Benoit Mandelbrot (his teacher) looked at these financial models and didn't like them one bit, especially after 1987. http://www.pbs.org/newshour/bb/business/july-dec08/psolman_10-21.html
    0 0
  40. Peter's reconstruction is a determination of how temperature has changed over time, and not about why it may have varied. Thus the basic outcome was predetermined, ie the planet has and is in a warming trend. The data utilised is subject to the same limitations as most other proxy data, biased representation of NH over SH, error ranges, so it is reasonable to expect that the results will resemble most other reconstructions. All that could have changed is the timing of any changes, and the magnitude of any short term changes, however the long term trend is built in. It does not allow for what factors may have resulted in any change in trends within the overall longterm trend. That is a different issue and the one that is really relevant. Perhaps then, adjustments can be made to the reconstructions just as adjustments are made to the instrumental temperature records to account for changes in circumstances. I earlier used the example of testing blood and urine samples and skywatcher suggested collecting and testing multiple samples. That actually helps make my point. Collect samples from the entire population and have them all analysed by every laboratory, the results should all come out the same, because the chemical analysis is already predetermined by the biological functions of the human body. There will be variations within individual samples, and perhaps groups of samples, and they generally will fit with the "normal" range or within the error bars, but nothing is going to change the final outcome. Irrespective of where any researchers take the samples to study, as long as the samples are representative of the general population, the results should be the same. If they differ then either the samples are not representative, of the laboratory methodology was wrong. Perhaps studying human growth may be a better example. Humans are measured from the moment they are born, perhaps even earlier, and then through their entire lives. Weight and height are recorded throughout. Any study that examines human growth patterns is going to come to the same conclusion, weight and height increase during the growing period and then declines. There will be exceptions amongst individuals and groups of individuals, but it is predetermined that growth occurs. Examining the reasons why it may vary, increasing in trend, or decreasing, even halting, are completely different issues.
    0 0
  41. Johnd, you have lost me. How do the methodologies "predetermine" that they will find a warming trend? If the world was actually cooling, are you implying that the measurements methods would still claim it was warming? If you are looking for regional scale examination of the temperature proxies (and the pattern which any model for climate must be able to reproduce), then surely this was the point of Mann 09?
    0 0
  42. johnd writes: Peter's reconstruction is a determination of how temperature has changed over time, and not about why it may have varied. Thus the basic outcome was predetermined, ie the planet has and is in a warming trend. Yes, I agree that the planet is warming and that Peter's work just provides an additional demonstration of that rather than directly addressing the question of why it's warming. In an ideal world that kind of demonstration wouldn't be necessary, but most of us recognize that there are a lot of people out there who still harbor the mistaken impression that the world is cooling or that it was warmer during the MWP. So, if you are comfortable with the fact that the world has warmed rapidly over the past half-century, to a temperature that is probably higher than any in the past 2000 years, then great. You can safely ignore this thread. Others, however, might benefit from it. William Connelley has a recent post over at Stoat that explicates how he sees the situation with global warming. There are four main points that most informed people would agree on: (1) The earth is getting warmer. (2) Humans are causing most of this warming, through greenhouse gas emissions and land use. (3) If we don't cut back on emissions, the warming will continue and in fact accelerate. (4) This will be a problem and we have to do something about it. Connolley says (and I agree) that those points are listed in approximately the order of certainty, with (1), (2), and (3) being essentially undisputable but with much less agreement about (4). Given that, it would be nice if we could just take the first three points for granted and focus all our energy on resolving the questions surrounding (4). Unfortunately, even people who ought to know better keep going back to revisit the first three points. Thus, post like Peter's here, and in fact all of John Cook's work on this site, are regrettably necessary.
    0 0
  43. So, johnd - you agree that the reconstructions are accurate representations of temperature variations over the last 2000 years? That the "hockey stick" shape is correct? And you're shifting the discussion over to why these changes occurred? That's good; there still seem to be lots of folks who feel that the Earth isn't warming, or that the MWP was hotter than things are now. Those are the people I would like to get to read Peter's analysis.
    0 0
  44. KR at 22:54 PM, the reconstruction is most likely an accurate representation of the proxy DATA available. It is the basically the same data available to anyone who wants to do a reconstruction. Whether or not that data is representative, or accurate has not been assessed and requires a different analysis rather than a compilation.
    0 0
  45. Well, johnd, I would suggest you then find additional proxy data, or re-evaluate the data currently collected, and present your findings. Write it up and publish! This is the best evidence we have, and the best conclusions that can be drawn from them. There is no solid evidence for any other conclusion than these reconstructions of temperature over the last 2000 years. I would love to see more data, in particular more proxies for the Southern hemisphere, but lacking that, and lacking any model that predicts major hemispheric differences (other than "more oceans, slower to respond", which doesn't really change the overall results), that doesn't seem to be a major problem. Hypothetical data (that which might exist) is not evidence, and hypothetical analysis errors such as you mention here are not a disproof. Or, for that matter, any reason to doubt the current conclusions.
    0 0
  46. johnd at 03:23, The only way to evaluate the accuracy of a particular proxy is to compare it to other established proxies or to recent temperature measurements. The fact that all these proxies independently show the same trends and that they line up well with modern temperatures establishes that they are likely accurate representations of temperatures.
    0 0
  47. Peter Hogarth at 18:58 PM, I followed up your links regarding the divergence problem. I don't know if you have read them or not, I have only had time to read the Buntgen 2008. Buntgen 2008 is of limited use. I feel that they have gotten the whole process back to front, and that there is very little understanding of plant biology amongst those who compiled the report. Tree growth, as with all plants, is the result of a combination of complex inputs. To draw any worthwhile conclusions, not only must all those factors be understood, but must be accounted for. Once they have been accounted for, only then can any of them, including to temperature, be correlated to growth. Thus any study relating growth rings to temperature should basically be a study of tree growth, and any conclusions drawn about temperature basically a byproduct. Buntgen 2008 does virtually nothing to understand tree growth, all it basically confirms is that there is a divirgence problem by examining data, but perhaps with limited understanding of what the data represents. There is nothing about soil nutrient levels, nor about tree density. These are two major factors that affect tree growth and change over time. There was nothing about how changing CO2 levels are accounted for, it is not even referred to at all. However the most glaring omission, is that of sulphur dioxide. There is not a single mention in the entire study, yet here is perhaps the most relevant factor of all, particularly if the trees being studied are anywhere in Europe. It is this omission that would cause me to discard any such study as a useful reference. Irrespective if you have read Buntgen 2008 or not, I would recommend that you read some literature that addresses ALL the factors that affect tree growth, particularly those concerning sulphur dioxide. This may be a place to start, it is a couple of decades old but very relevant Sulfur dioxide and vegetation: physiology, ecology, and policy issues by William E. Winner, Harold A. Mooney, Robert A. Goldstein It is not enough to know that there is a divergence problem, we need to know why in order to input into any modelling that is done to reconstruct historic data.
    0 0
  48. johnd, you dont expect a single paper to cover all the aspects in using tree rings for temperature determination. That tree rings respond to factors others than temperature is hardly news to anyone working in the field. That is the critical part of selection of trees for use in this work - to pick trees where circumstances dictate that the growth rings will determined by primarily by temperature. The fact that tree ring proxies match well with other completely independent proxies suggests to me that they that they havent got the temperature that wrong. If you think tree rings are flawed, then look at proxy reconstructions that dont use any tree ring data. It change the picture though.
    0 0
  49. Whoops "It doesn't change the picture though."
    0 0
  50. In response to Ned @#42 You've highlighted here why it is important to separate as much as possible the discussions of four categories of issues: 1) Documentation of climate change, 2) Attribution of climate change, 3) Predictions of future climate change together with interpreted impact, and 4) Issues of response and remediation. In order to understand WHY it's so important to disengage #4 from the rest requires some understanding of the underlying factors responsible for the phenomenon of AGW Denialism. This discussion would be outside the scope of the present topic, but suffice it to say that AGW Denialism is rooted in issues related to #4, and the arguments related to #1, #2, and #3 are constructed in reverse to support a specific (often ideologically based) position. In other words, one's views related to #4 can introduce bias in how the other, ostensibly scientific, issues are treated. On the other hand, any reasonable approach regarding #4 (response and remediation) must entail probabilities, which requires some unbiased estimates of certainty regarding the first three. To the extent that contemporary climate seems to approximately resemble climate during the MWP (differences in the forcings notwithstanding), much hinges on the precision and accuracy of climate models regarding future climate change. It is exceedingly important, therefore, that climate scientists maintain credibility on this topic, which is one reason why the "hockey stick" debate has broader implications than just whether or not temperatures today are higher, lower, or the same as during the MWP.
    0 0

1  2  Next

You need to be logged in to post a comment. Login via the left margin or if you're new, register here.


The Consensus Project Website

THE ESCALATOR

(free to republish)


© Copyright 2024 John Cook
Home | Translations | About Us | Privacy | Contact Us