Climate Science Glossary

Term Lookup

Enter a term in the search box to find its definition.

Settings

Use the controls in the far right panel to increase or decrease the number of terms automatically displayed (or to completely turn that feature off).

Term Lookup

Settings


All IPCC definitions taken from Climate Change 2007: The Physical Science Basis. Working Group I Contribution to the Fourth Assessment Report of the Intergovernmental Panel on Climate Change, Annex I, Glossary, pp. 941-954. Cambridge University Press.

Home Arguments Software Resources Comments The Consensus Project Translations About Support

Twitter Facebook YouTube Mastodon MeWe

RSS Posts RSS Comments Email Subscribe


Climate's changed before
It's the sun
It's not bad
There is no consensus
It's cooling
Models are unreliable
Temp record is unreliable
Animals and plants can adapt
It hasn't warmed since 1998
Antarctica is gaining ice
View All Arguments...


Username
Password
New? Register here
Forgot your password?

Latest Posts

Archives

Kung-fu Climate

Posted on 6 May 2010 by Rob Honeycutt

Guest post by Rob Honeycutt

The other day I happened upon the Popular Technology blog that has a list of "700 peer reviewed papers supporting skepticism of man-made global warming." This was news to me so I started to look into the first paper on the list. Loehle 2007 titled A 2000-Year Global Temperature Reconstruction Based on Non-Treering Proxies published in Energy & Environment. I'm sure many Skeptical Science readers are familiar with this paper and Loehle's 2008 correction. I was not.

I decided to email Dr. Loehle with some questions and got a very prompt response from him. This was followed by a number of back and forth emails. What I got from him was that he believes himself to be one of the scientists whose work is blocked from publication for political reasons. And I got that his motivation for this 2007/2008 paper was to point out the "politically motivated" science trying to obscure the MWP by Michael Mann and others. I do not doubt Loehle is genuine in this statement and that he is genuine in his desire to do good science. Nor do I doubt that Mann, Briffa, Moberg and other who have done similar temperature reconstruction to be any less genuine in their desire to do good science. I have no reason to doubt either. But as I put it to Loehle, "I think contentious issues in science have always been a bare knuckle brawl." This is not new to climate science. Often it comes down to whether my kung-fu is better than your kung-fu.

So, in this kung-fu match, not being a scientist myself, I have to place myself in the position of the audience watching the fight. I'm not a kung-fu master. I'm a spectator trying to decide whose kung-fu is better. I've read all the arguments against Loehle's 2008 paper with regards to it having far fewer (only 18) data sets opposed to Mann's 1200 data sets. But that's fine. I accept that Loehle is trying to tease out potential errors imposed from treering data.

As I was researching this I came onto one post on Yahoo Answers from a person called Keith P who tries to answer the question, "Does Loehle actually refute Mann in any way?" Keith does something quite simple that I have reconstructed for myself. He just scales Loehle's to the "hockey team" chart that contains Mann, Briffa, Moberg and other temperature reconstructions and overlays the two. The result, to me, was very illuminating but I'm going to take a slightly different approach than Keith P.


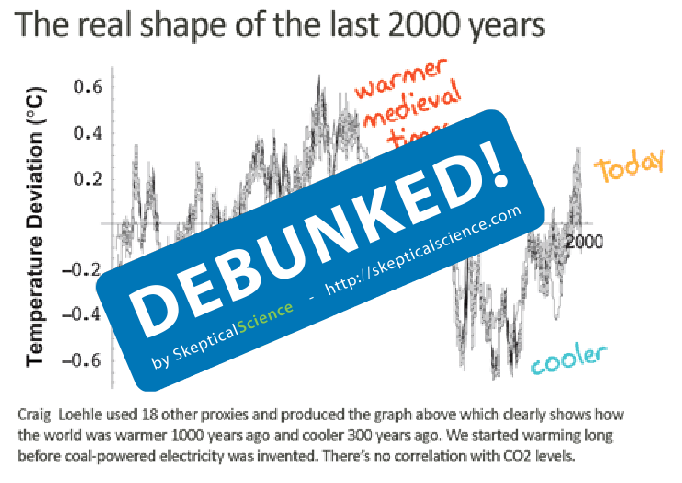
Figure 1: Loehle 2008 temperature reconstruction.

In Fig 1, I have taken Loehle's temperature anomalies and kept his scale in both the X and Y axis. I've also kept his zero axis. I believe this is a reasonably faithful reconstruction of Loehle's data. My apologies to the data purists out there who might find some inherent abomination in my method. Graphically it works (I don't know why more scientists don't either enlist the help of a graphic artist or at very least audit a couple of courses at their local university).

The other critique of Loehle's paper has been that the data ends in 1935. This, from my position in the bleachers of the kung-fu match, is much more problematic for Loehle. I know the paper is not about current warming. I know it's about treering proxy errors but that is sort of missing the forest for the trees (pun is definitely intended). I understand why the data ends at 1935. But I just can't buy NOT making the attempt to concatenate this data with the past 150 year of recorded temperature readings. Even if the modern temperature records are not central to the topic of the paper to not add the blade to his hockey stick is a mistake. Maybe not from a scientific perspective, but from the bleacher's perspective it is.


Figure 2: Loehle 2008 temperature reconstruction with Hadley instrumental record.

While I was writing this Loehle was kind enough to provide me with a Hadley chart with the same 29 year smoothed average as his data allowing me to compare apples to apples. In Fig. 2 I have added the Hadley data to his. It takes quite a bit of scrunching (my technical term) to fit 150 years of data into a 2000 year chart. This is definitely a rough cut and paste so I would not be prepared to make any claims about precisely how many degrees warmer today is over the MWP based on this chart. One should note that since this is a 29 year smoothed average not all the most recent (less statistically significant) data is included. The only conclusions I can come to is that the current warming has happened as fast or faster, and is more sustained, than any time in the past 2000 years, and that we are at least as warm as the MWP and maybe warmer. I would not assume Loehle's work to be definitive here any more than I would consider Mann's to be so. No, it's not a scientific conclusion. It's a conclusion that the rest of the 99.9999% of the non-scientific world has to try to grapple with.

In the final battle in this kung-fu match I have to throw everyone into the ring together. Mann with his Crouching Tiger style. Crowley and Lowery with their Striking Serpent. Jones and his Monkey Fist style. Moberg is a student of Jackie Chan's Drunken Boxing. Briffa's Shaolin and his et al grasshoppers. And all the others pasted in behind Loehle's Wing Chung style chart. This is Fig 3.


Figure 3: Loehle 2008 temperature reconstruction (blue) with other temperature reconstructions (source: Wikipedia).

What a bizarre, almost absurd, cacophony. What I see in this is a battle of home made hockey sticks. Some straight, some crooked, some short, some long. But I see all our kung-fu masters each beating the other with their own hockey sticks. What's most strange to me is that it seems like the MWP battles are all about the shape of their hockey sticks and miss the rather more important question of NOW. I have two kids that are 5 and 6. When they are in their 20's or 30's I'm going to have to answer to them and tell them what I did back in 2010. What did I know and what did I do about it? Now really is everything.

There is a wide gap between you kung-fu masters in the ring as you bloody each other up over these kinds of issues and those of us in the bleachers trying to understand what this fight means. It's certainly easy to sell tickets to this bloody brawl but don't forget that the rest of the world needs to potentially make some very quick decisions with regards to the future of our planet. This is not a political statement, this is just a potential statement of fact. I urge everyone in science to stop playing games. Fight the good fight. Pay respect to a good fighter. And may the best kung-fu win.

I want to extend my personal thanks to Dr. Loehle for his patience in answering my rather long string of questions.


0 0

Printable Version  |  Link to this page

Comments

1  2  3  4  5  Next

Comments 1 to 50 out of 224:

  1. John, a quick suggestion: would you mind editing the paragraph before Fig 3. to indicate which colour lines relate to which studies?
    0 0
    Response: All the other reconstructions come from this Wikipedia page which includes the sources along with each colour.
  2. I don't have access to Loehle's paper, but I note from the abstract that he derives his result by averaging 18 series. Most such data comes from the Northern Hemisphere, so that's probably what he is mainly measuring. Fair enough, so did the original Mann hockey stick and many others. We should note, however, that there is considerable historical evidence of an ocean "see-saw" whereby when one hemisphere warms, the other one cools. The MWP may therefore not have been a global phenomenon, and indeed this is what Mann's most recent work tells us. Now here comes the kung fu move. The current situation is strikingly different, since for sure both hemispheres are warming together. The argument that we have seen something like this before, therefore, is mere speculation, since strong warmth in the S. Hemisphere in the Medieval period has not been demonstrated.
    0 0
  3. Rob, You have achieved what many fail to do: you have done science and you have done so with a story. Essentially, you have kept the novice interested which means your message was received. Kudos to you. Alan Alda would be proud of you. Scott A. Mandia, Professor of Physical Sciences Selden, NY Global Warming: Man or Myth? My Global Warming Blog Twitter: AGW_Prof "Global Warming Fact of the Day" Facebook Group
    0 0
  4. Thanks for that Rob, Something that's been bugging me for a while is the way instrumental temperature records are pasted onto the end of these graphs. Can you just confirm that there is no issues with doing this? I don't mean your attempt just the general practice of doing this. I remember the recent post about the Mclean paper specifically critisised this sort of splicing of data sets.
    0 0
    Response: The problem with the McLean paper was the way they spliced the data - they hid the splicing boundary by breaking the graph into different boxes, they used different Y-axes for the different boxes and the way the data overlapped, the splicing also hid the incline in temperature. This problematic graph was then cited by the authors as proof that humans weren't causing global warming.
  5. @HumanityRules... I'm sure there are camps on both sides of this and Loehle stated to me that he falls into the camp of believing it's not right. But even he does comment on this at the end of his paper and states that current temps (being 1992 for the smoothed average) are 0.7C higher than his MWP temps. I personally don't see how you can NOT at least make the attempt to concatenate the data in some meaningful way because this is the very essence of the debate about climate change. @ nautilus_mr... I just emailed the information for John to post.
    0 0
  6. Rob, It does sound like dr Loehle was co-operative. Did you tell Dr Loehle you were going to post this? Or did you maybe mail him the the post and get any feedback on it? It would be great if you could encourage him to reply to this here.
    0 0
  7. Correction. Loehle says 0.07C warmer. But also 0.53C warmer than (I believe) the end of his 2008 chart.
    0 0
  8. @HumanityRules... I did notify him about it. That's when he sent me the Hadley data. I'm sure he'll be here before to long with some comments.
    0 0
  9. Putting aside whether the MWP was warmer or not what is the importance of the level of natural variability suggested by these records because that appears to show some significant differences on fig 3. By eye, and just to illustrate, Loehle's reconstruction (dark blue) maybe shows 1oC between the highest and lowest points. Jones and Mann 2004 (orange) is maybe 0.5oC (for the non-industrial period). What does this natural variability tell us? And what difference in natural radiative forcing, if any, is suggested by the different estimates?
    0 0
  10. As many here already know, if the Kung Fu alarmists win incorrectly, they are chaining their children to an unnecessary 2% drop in global GDP (according to Krugman, citing other studies) this entire century. If the Kung Fu skeptics win incorrectly, they are chaining their children to a 5% drop in global GDP (again Krugman) this century. But, there's a small chance (Arctic methane) that they may actually be destroying any chance of their children's having a future. Admittedly, those odds are small, by why go there?
    0 0
  11. I’m flummoxed, as ever, by the obsessive fixation AGW “skeptics” have with the MWP and LIA. Even if one concedes that certain regions of the Earth may have been episodically cooler during the LIA, or warmer during the MWP, in what manner does this negate the warming effect of anthropogenic CO2? Geologists have an expression: “The present is the key to the past”, which suggests that if we are able to understand natural processes occurring on the Earth today, we will be in a better position to understand events that occurred in the geologic past. The implication, however, is that the same or similar processes have occurred in the past as are occurring today. This is only partly true. Geologists now recognize that rare, catastrophic events are disproportionately represented in the geologic record. Many AGW “skeptics” attempt to invert this principle by stating the something like: Climate change has occurred naturally in the past; Therefore contemporary climate change might be natural as well. So far, so good, and most climate scientists would agree. The problem arises when “skeptics” commit a perversion of logic in extending this to infer, “Climate change has occurred naturally in the past, therefore present climate change must be natural also.” (I might not have represented this fairly, as the logic eludes me.) The problem is that climate scientists have looked long and hard for contemporary natural drivers other than AGHGs, and can’t find any that can adequately explain the observed warming. One contribution geologists can make to present situation is that there is no precedent in the geologic record for the sudden release of such massive quantities of CO2 into Earth’s atmosphere—certainly not during the Middle Ages. CO2 levels have been higher in the distant past than they are today; however, the sun was cooler then, or the configuration of the continents was different, etc. We are dealing with a unique set of circumstances today. Therefore, the MWP does not illuminate our understanding of contemporary warming. In both the “hockey-stick” diagram of Mann et al. and the “camel-back” diagram of Loehle, we may be seeing the intrusion of bias into the representation of the proxy temperature data. On the one hand Mann et al. may have felt justified in emphasizing the uniqueness of contemporary warming. Loehle may have felt justified in showing that the “hockey stick” may have exaggerated the steadiness of temperature over the past 2000 years by decapitating his poor camel at the base of the neck, as nicely documented in the present analysis. The important conclusion for us—here and now—is that it doesn’t matter if both diagrams were simultaneously valid and invalid. Either way, the present is NOT the key to the past, nor vice versa. It would be nice if we could just move on, but “skeptics” will not allow the poor hockey stick to rest in peace.
    0 0
  12. Credit to Loehle in that there were a number of sloppy errors in the original attempt; the corrected version is improved. Spencer Weart: I think only three of Loehle's proxies were Southern Hemisphere. From the nature of the proxies used, there's also going to be some dating error. If nothing else, Loehle's reconstruction is the people's reconstruction. The method may not be the best, but it's simple enough that anybody could do it. But beyond the issues with the amount of data and simplistic processing, is the question of exactly why these results support scepticism. Loehle's results show a bit more variability than others. Sceptics like to jump from that to various unsupported conclusions.
    0 0
  13. Just to be certain, could the base period for each anomaly be attached to each graph so that we know, rather than having to assume, that they all refer to the same benchmark.
    0 0
  14. ubrew12 - I think comments about arctic methane really are alarmist. see arctic methane on the move. If continental shelf hydrates were lost, then that would be problematic but I think there is any serious science to suggest this is likely? Like coalgeologist (hey I spent a lot of my life as one too), I fail to understand the obsession with MWP. Though as Rob has pointed out, the instrumental data on the same graph gives one pause to think about the rate of warming compared to past periods.
    0 0
  15. i enjoyed this piece Rob, thanks. a question i have always had was how accurate are tree ring proxies from many years past? can someone point me to a link or paper that describes this tree ring proxy procedure, how it was verified, etc.? without being familiar with the procedure, my question is as a tree ages for hundreds of years, those inner rings would come under pressure and perhaps shrink thus skewing the actual temperature of those older timeframes. i'm not a biologist nor do i have extensive experience doing this but i'm just mainly intersted in learning about the procedure. many thanks ahead of time for helping me out!
    0 0
  16. @Poptech... You are correct. I misread Loehle's statement in his paper. But the data that I appended to his chart is the Hadley data that he provided to me.
    0 0
  17. @Poptech... I have to disagree with you about the battle. I believe you maybe do not understand my broader point that there are a lot of versions of the paleo reconstructions, each vying to be the definitive chart. But I'm trying to say that is far less important than what we see today and how we respond to the challenges we face. Honestly, I am more concerned when I see charts like Loehle's with a large variation in temperature because that suggests much greater climate sensitivity and could spell a much worse situation for us going forward. We should all HOPE that it's Mann's chart that is the more accurate one. Then we may be able to respond in time to what could be a looming crisis.
    0 0
  18. The deniers' focus on discrediting the hockey stick is due to its political value, not because of its role in the science. It is the most easily recognisable symbol of AGW and, I would argue, did more to win broad public support than any other item of evidence. Like many of the contributors above, people who see global warming as a scientific matter tend to scratch their heads about the extreme emphasis on this one small part of a huge body of research. But we must remember: certain well organised and noisy organisations see data and scientific jargon as nothing but a political tool, not to achieve truth, but 'truthiness' (S. Colbert's contribution to modern english). Fox and the Heartland Institute couldn't care less about scientific accuracy. They are after the 'hearts and minds' and they understand the minds are easier to win with good old FUD, than with complicated analysis.
    0 0
  19. Nice article, Rob, and thank you. But I guess I'm w/CoalGeologist on this-- what's the big deal? Strangely enough (or perhaps I'm not as strange as I think) I wasn't aware of this article prior to reading about it here. What I gather is, Dr. Loehle has teased out what he sees as better understanding of the MWP's magnitude although not its areal extent and he adds the further conclusion "The warmest tridecade of the MWP was warmer than the most recent tridecade, but not significantly so." What if anything about this paper speaks to current climate forcing theories, prognostications and observations?
    0 0
  20. Poptech, Loehle apparently has no issue w/Hadley, he supplied it to Ron after all. Why should you? Are you aware of any problems w/Hadley data? If so, specifically what are they?
    0 0
  21. Poptech, why should it matter if the current warm period is within the range of natural variations? The current warm period appears -not- to be a natural variation according to the best synthesis we can produce. The paper does not seem relevant to the topic, except maybe as a rhetorical lever.
    0 0
  22. 11.CoalGeologist The Journal of Quaternary Science in Jan 2010 produced a special edition entitled "Special Issue: The 4th IPCC Report and Beyond: Palaeoclimate Perspectives" The introductory article makes good reading. IPCC and palaeoclimate - an evolving story? (p 1-4) Chris J. Caseldine, Chris Turney, Antony J. Long Published Online: Dec 4 2009 12:14PM DOI: 10.1002/jqs.1336 It nicely goes through the history of paleoclimate data in the IPCC. It would suggest that it's not just the "sceptics" that have increasingly seen the importance of this field of study. When you say "climate scientists have looked long and hard for contemporary natural drivers other than AGHGs" I'd suggest they look longer and harder. I'd like to know the role of clouds and water vapour, aerosols and given the 'missing energy' issue just what is the role of the oceans.
    0 0
  23. Poptech. If you use GISS it makes no difference whatsoever to the graph. CRU is something like 95% GISS and before climategate was much preferred by skeptics since it showed generally slightly less warming. The issue with MCA is not some as yet unexplained "natural variation" but whether the MCA is consistant with known forcings. Nothing to suggest it isnt and plenty to suggest you dont get current temperatures without including the CO2 forcing. If the global variation in MCA/LIA is stronger than current understanding it says sensitivity is higher and we are in more trouble.
    0 0
  24. Ho-hum on the "lost" data, Poptech. Or can you say why it matters? What, specifically, is the problem with the Hadley set you're complaining over?
    0 0
  25. How does it matter whether you graft CRU or GISS as your choice of instrumental record? The plot is going to look exactly the same either way, especially with the smoothing and the zoomed-out axes. Harping on that is a red herring and a pointless distraction from a discussion on the merits of Loehle's simplistic methodology.
    0 0
  26. Speaking of Hadley (still), I wonder Poptech if you feel you are better qualified to recommend a reliable source of data than is Dr. Loehle? If so, why do you include Loehle's paper in your list, presuming you are the authentic Poptech aroused to defend Loehle? Why should you believe his conclusions when you disagree on his choices regarding such a fundamental matter?
    0 0
  27. On second thought, maybe CRU was chosen here because it goes further back in time than GISS. So you get more overlap with the reconstruction. There's also more uncertainty in that period, though.
    0 0
  28. 28.scaddenp "......but whether the MCA is consistant with known forcings" "If the global variation in MCA/LIA... " Which MCA/LIA? fig 3 suggests there are plenty to choose from.
    0 0
  29. And funnily the uncertainties in the determining the forcings are also high. See the Mann 2009 paper for error-bars in determining global temperature as well as the error bars on various model reconstructions based on estimated forcings. Nothing that invalidates the climate model which includes the physics of greenhouse gases.
    0 0
  30. So no specific complaint about the Hadley data Poptech was griping about. In any case, fortunately science does not work by having researchers slavishly following scripts produced by earlier workers, so even if there were a problem there we'd have already seen it. In fact, the "problem" Poptech is worried about turns out not be any problem at all but rather an advantage. Thanks for helping to clear that up, Poptech.
    0 0
  31. The Hockey stick is far from discredited -and certainly not by McIntyre and McKitrick. Readers interested in reading what the 'smartest guys in the room' have written about M&M should look at RealClimate's guide to the Hockey stick. NASA's Gavin Schmidt uncovers the failings of M&M 2007 in detail here.
    0 0
  32. Great write up, as always. I've recently ended up in a fight with an economist from NZ which has ended in a stalemate position with the science only reflected on one side of the debate. For very much the same reason as you summed up at the end of the piece, that's why I am where I am. I have a 10yo son and thinking about him I often find myself wondering why are we watching a fight which doesn't seem to address the point, when regardless of the slope, we are obliged to do our best to leave the place better than we found it. Nothing would be worse than watching him enter the workforce having to address issues that I was aware of and did nothing to mitigate in any way. As with this debate I found myself getting wrapped up in; focusing on such a fight itself induces a form lethargy instead of action. Anyway, cheers for putting the fighter in the same ring together so we can get a good look at what the fight is truly about! Tim
    0 0
  33. Nice work, Rob. Two questions come to mind. The first is that there must be far more than 18 non-tree proxies available, right? So how did Loehle select the 18 that he used? The second is how many of the proxies shown in the final figure are independent -- based on totally different data? If some are independent, they could be averaged to reduce random errors -- by eye an average of any two or more of the curves would tend to look more like a ... hockey stick. On the point of noise and averaging, one obvious drawback of using only a few records is that you can't average down noise. In the presence of noise (or non-climate variation), you would expect that a reconstruction based on fewer records will show more variability simply because of noise. What did Loehle give for the error bars on his reconstruction? Only with the error bars on the plots can you tell whether the variations are likely to mean anything. This is the biggest reason I prefer the IPCC's version of this kind of figure: they show the error bars through a shaded region.
    0 0
  34. 34.scaddenp Can you get estimates of forcings based on changes in atmospheric temperature? An El Nino can raise the global temperature by releasing more energy from the ocean without any change in radiative forcing. Ocean circulation can work on time scales of upto 1000years, can changes in energy release from the ocean work on these scales? Again Trenberths "missing energy" has one explanation in novel ocean processes that bring the deep ocean into play. To what extent can we rule out changes in ocean energy exchange rather than (or in combination with) changes in radiative forcing to explain changes in atmospheric temperature? The discussion of energy budgets in an earlier posting got me thinking of the atmosphere more as a conduit for energy transfer between the oceans and space. I think the variation of energy coming into the earth from the sun (or lack of it) has been well discussed on this website. And alot of time is spent on the transfer of energy through the atmosphere. But I haven't seen alot about the role of the oceans and the processes of energy transfer back to the atmosphere. Maybe this is just the wrong way to think about things and completely irrelevant to this discussion but it's something I've been puzzlinmg since the Trenberth / Pielke discussion.
    0 0
  35. Thanks, Rob, for this post, which contrasts with the somewhat dreary and predictable tone that tends to characterises this blog. There's obviously scope for more work to be done on recent (i.e. during the present interglacial) paleoclimate, as I'm sure both Loehle and Mann would agree. When we've done with the MWP, then there's the (possibly even warmer) R (Roman) WP to consider. Climate varies, and has always done so. A source of plentiful references to literature on the MWP is the climate sceptic site www.co2science.org In the end paleoclimatology still leaves us with the question as to what has been happening to the earth’s climate during the last 150 years or so. There is a whole range of potential climate forcings which on theoretical grounds one might expect to have influenced, and in some cases raised, surface temperatures. Many of these forcings are anthropogenic. The net effect of all the known and unknown influences appears to have been a fluctuating upwards trend in surface temperatures. Disentangling the various forcings, in particular the anthropogenic ones, is not going to be a simple task. However a start on this task has been made by the group of workers associated with Colorado meteorologist Roger A. Pielke Snr. Pielke is not a climate sceptic - he believes in an anthropogenic influence on climate. He and his co-workers have an impressive list of peer-reviewed articles to their names, although there is little or no consideration of their work in the IPCC WG1 reports of 2001 or 2007 However this literature is referenced at Pielke’s blog www.pielkeclimatesci.wordpress.com
    0 0
  36. 38.Jeff Freymueller Here's a list of Mann's proxy's. I don't fully understand it but does Mann only use 18 non-tree proxies as well?
    0 0
  37. @CoalGeologist It seems to me that the "MWP" does, in a sense, rather tend to confirm the gravity of our predicament. It doesn't really matter if present conditions are slightly warmer or about as warm as one of the very few equally warm periods over the last few thousand years. Either way, the warming effect of anthropogenic CO2 emissions will be adding to an already quite unusually high temperature as far as the history of humanity goes, and the resulting temperature may, from what I've understood, be without precedent for the entire lineage of the hominidiae.
    0 0
  38. Rob, Excellent article. I agree with what Professor Scott Mandia said early in the comments. You have explained it all very well and made it easier to understand for the laymen and women out here. The first thing that struck me was that the fig 3 graph with all the data sets on it looked like they were all the same and all going in the same direction. All of them look like 'hockey sticks' so what I said previously still stands. We know its happening so we need to stop arguing over trivial data points and get down to basics. The need now is to stop doing what we are doing that's causing the problem and change course before we hit the rocks, or in aviation terms when heading towards a mountain side pull up quick before we reach the point of no-return. I know its not exactly a point that falls easily into this discussion forum but I really do get heartily sick of wasting my time with sceptics who will not change their opinion even when the truth hits them square between the eye's. I hope that I am not seen as stating the bleeding obvious but instead showing support for your efforts. I do use your site as a source to educate those who are genuinely interested in knowing what is happening. Many thanks. Kev C Part-time OU Student, UK.
    0 0
  39. # 2 Spencer Weart "The MWP may therefore not have been a global phenomenon, and indeed this is what Mann's most recent work tells us." Treydte et al., 2009 ? Well, yes. Kung-fu. "Scientific War". There is, however, is described (mostly) the methodology to create the reconstruction of temperatures. And some of them should disappear (do not create unnecessary noise) because that is defective (very flawed) methodology. Only Loehle? For example, Gerd Bürger of Berlin's Institute for Meteorology, he writes about one of the reconstruction: - "Osborn and Briffa did not apply the appropriate statistical tests that link the proxy records to observational data, and as such, Osborn and Briffa did not properly quantify the statistical UNCERTAINTIES in their analyses.", "As a result, the ‘highly significant’ occurrences of positive anomalies during the 20th century DISAPPEAR.", "The 95th percentile is exceeded mostly in the early 20th century, but also about the year 1000. [...]" It would be worth Loehle used the latest scientific description proxies (particularly the work of the last three years), covering the end of the twentieth century (perhaps it does?). Appeared here at least a dozen works, including some very clearly show the MWP on SH (most interesting for me - already cited - is: von Gunten, L. et al. 2009. A quantitative high-resolution summer temperature reconstruction based on sedimentary pigments from Laguna Aculeo, central Chile, back to AD 850.). Supporters of such phenomena as localness MWP, LIA, even applying the most exquisite Kung-fu (Treydte et al., 2009), can not pass by when such works as (my favorite - interesting references): Selvaraj et al. 2008, Holocene weak summer East Asian monsoon intervals in subtropical Taiwan and their GLOBAL SYNCHRONICITY". Interesting are also: Licciardi et al., 2009, Holocene Glacier Fluctuations in the Peruvian Andes Indicate Northern Climate Linkages - "The results bring us one step closer to understanding GLOBAL-SCALE PATTERNS of glacier activity and climate during the Little Ice Age," said Licciardi; Trouet et al., 2009, Persistent Positive North Atlantic Oscillation Mode Dominated the Medieval Climate Anomaly, - "... MCA-LIA climate transition that probably was coupled to prevailing La Niña–like conditions amplified by an intensified Atlantic meridional overturning circulation during the MCA." If this is all true ... - La Niña is a global phenomenon - MWP-MCA - simply CAN NOT BE local.
    0 0
  40. 42.Steinadler Your approach suggests to me that you presuppose that the climate’s sensitivity to CO2 is equivalent to society’s sensitivity to climate. It suggests a belief in the impotence of modern society, not something I'd buy into.
    0 0
  41. a propos: "... appropriate statistical tests that link the proxy records to observational data ..." - I propose this paper: Esper J, Frank DC, Büntgen U, Verstege A, Hantemirov RM, Kirdyanov AV (2010) Trends and uncertainties in Siberian indicators of 20th century warming. Global Change Biology 16, 386-398.
    0 0
  42. For those of you interested in the Hockey Stick debate, here is a good link: A Layman's Guide to the Science and Controversy: 5. Temperature Reconstructions Scott A. Mandia, Professor of Physical Sciences Selden, NY Global Warming: Man or Myth? My Global Warming Blog Twitter: AGW_Prof "Global Warming Fact of the Day" Facebook Group
    0 0
  43. Can someone clarify at what point, and the process by which, the data collected for these temperature reconstructions becomes an indicator for global temperatures. I assume that whatever the chosen indicator is from which measurements are collected, lets says tree rings, at some point the measurements taken will have been matched to actual temperatures recorded for the corresponding period. These temperatures should by rights be the temperatures recorded at the location where the chosen proxy was measured, it makes no sense to match them to a temperature recorded at some location remote from, or unrelated to the site that the measurements were drawn from. When the historic temperature record is then reconstructed, it also will then obviously be valid only for that specific location. How do those reconstructions then become indicators of global temperatures?
    0 0
  44. I was going to make a comment about the hockey stick and climate sensitivity, but robhon you beat me to it (excellent article by the way). What's the value of the 'hockey stick'? 1) A crucial foundation pillar of AGW theory, without which the whole thing crumbles into dust? 2) An interesting byproduct of palaeoclimate analyses that informs us on climate sensitivity, but tells us little about whether humans are driving global warming? 3) A visually arresting image that appears to show that humans are driving warming, good for showing politicians and the general populace? These are interesting questions as skeptics, such as Arkadiusz would have you believe (1), but would utterly ignore the implications of (2). (3) is almost a red herring for both sides, precisely because (1) is incorrect and (2) is correct. The most important point is this: "What if Loehle (and similar arguers) was right?" What are the implications for present/future climate change? The implications are that the Earth in it's present configuration is much more sensitive to changes in radiative forcing than we currently think. Meaning that the future changes in response to our forcing would be truly catastrophic, many times what the IPCC suggest. Do "skeptics" really want that? Skeptics really ought to hope that Mann was right (I think he is as regarding regional variation and global significance), that the Earth's sensitivity is lower to radiative forcing change! But because of the political element in (3), skeptics could not bring themselves to say that Mann is right... Of course that does not change the political element as embodied by (3), that the hockey stick is a stunning visual indicator of our impact on global climate. The stick, and distant palaeoclimate, does not inform us on the mechanisms, as excellently pointed out by CoalGeologist because the driving mechanisms and elements of the system are not the same now as they were.
    0 0
  45. Poptech, I would suggest you look at John Cook's: http://www.skepticalscience.com/human-fingerprint-in-global-warming.html The evidence is not based on models, as you imply. The CO2 warming effect was predicted over a century ago, and CO2's warming has been directly observed by Harries et al (2001) and a number of subsequent papers. These are direct observations, not models. As for datasets, you can see the sources, methods and code of the GISS dataset, and the raw data is available for HADCRU if you go get it yourself. Seeing as these datasets independently match each other, and also correlate with the satellite records, all showing the warming of the last three decades, faith is not required when identifying the warming trend of Earth.
    0 0
  46. Since the UAH and RSS calculations of average global temperature anomolies from microwave satellite data are in almost perfect lockstep agreement with the direct surface measurements (Hadley, GISS) since 1978, why should we not have complete faith in the Hadley dataset?
    0 0
  47. Poptech, look at that quotation from Loehle you posted again. Yes, it says that the MWP was 0.07 C warmer than the 'end of the 20th century'... but it also sets the 'end of the 20th century' at 1992. Thus, in one sense 'both sides' here are right. Loehle's statement is correct for an 'end of the 20th century' as he defined it (i.e. 1992) and with his other data and assumptions. However, if we set the end of the 20th century at the year 2000, as most people would have it, then the modern temperatures are higher... even using all Loehle's data sources, methodologies, and other assumptions. That said, I think there is a very fundamental flaw in Loehle's approach. As I understand it he makes no attempt to weight the different proxy readings geographically. So... the 15 proxies from the Northern Hemisphere actually have 67% more impact on his recreation of >Southern< hemisphere temperatures than the 3 proxies actually FROM that hemisphere do (15/18 - 3/18 = 12/18 = 67%). An extreme example of the flaw to this approach would be to take 5000 samples all from Canton, Ohio, average them, and then say that result is a valid proxy for average global temperatures with a huge sample size. It only works if we assume that temperatures change uniformly across the globe... which even Loehle's 18 proxies show not to be the case. Thus, knowing that temperature changes are NOT uniform geographically, the logical course would seem to be to apply the data we have from each region.... the most simplistic example would be to use the average of the 15 NH temps to get a NH result and the 3 SH temps for the SH and then average those two numbers together. Since most data now shows the MWP to have been a NH phenomenon this would decrease its apparent impact on a global scale... and thus yield results more in line with the other studies. It is only by over-representing northern hemisphere data as the primary determinant for the entire planet that Loehle gets his MWP anywhere near modern temperatures.
    0 0
  48. Steinadler wrote: It seems to me that the "MWP" does, in a sense, rather tend to confirm the gravity of our predicament. It doesn't really matter if present conditions are slightly warmer or about as warm as one of the very few equally warm periods over the last few thousand years. Either way, the warming effect of anthropogenic CO2 emissions will be adding to an already quite unusually high temperature as far as the history of humanity goes, and the resulting temperature may, from what I've understood, be without precedent for the entire lineage of the hominidiae. HumanityRules wrote: Your approach suggests to me that you presuppose that the climate’s sensitivity to CO2 is equivalent to society’s sensitivity to climate. It suggests a belief in the impotence of modern society, not something I'd buy into. ___ I don't see much of any such suggestions in the little text I posted, though from your reading I'll have to accept that such an interpretation is evidently possible . And I try not to hold any belief, one way or the other. Surely, modern societies consist of more or less enlightened people, and the question is, then, who will prevail. The outcome will of course depend on whether a number of societies will be able to face up to the scope and size of the challenge, as suggested by science.
    0 0
  49. Poptech writes: Could you please provide the Raw non-homogenized data and methods for HADCRU, thanks. If this is unavailable then I cannot scientifically reproduce this data and consider it worthless. If you don't trust the CRU global temperature data set, use the one from GISS. It's based entirely on publicly available data, the software is all public, and it's been exactly replicated by an independent team (see the Clear Climate Code project). Many other people have now found similar results using the same data but different programming methods, most though not all of which are open-source. Off the top of my head, these include Tamino, Zeke Hausfather, Ron Broberg, Residual Analysis, RomanM, Nick Stokes, and probably others as well. In fact, despite your complaints about HadCRU, Ron Broberg used the CRU gridding algorithms with the regular, publicly available GHCN data, and got basically the same results. There's a comparison of a few of these different analyses here: Note that the HadCRU record, which you apparently don't trust, is essentially identical to the open-source one from GISS, and the one from NCDC, and the ones from independent bloggers (Zeke and Nick). And again, you can download and test out the code yourself for many of these analyses (GISS, Clear Climate Code, Nick Stokes's TempLS code, etc.) Of course, if for some reason you don't trust any of those people, and you're not up for actually reading their code or writing your own, you could ignore the land surface temperature record entirely, and just consider sea surface temperature trends, which presumably don't have any Urban Heat Island effects. Kelly O'Day has a nice set of R scripts for downloading and processing climate data, including one for the long-term global SST trend, which -- surprise! -- also shows increasing temperatures: . Then again, if you don't trust sea surface temperatures, you could look at satellite measurements of temperatures in the lower troposphere, which also show an increase over the past three decades. (UAH's analysis has a slightly lower trend, but RSS's trend is a very close match for all the land surface temperature trend analyses). Or, you could ignore all of that, and just assume that the climate science community doesn't make any of its data or software available so it's all a big hoax.
    0 0
  50. Unfortunately science doesn't work by demanding data, Poptech. To reproduce the results you should follow the methods of the researchers, which in this case would be to ask the relevant national meteorological organisations for their data, then following the relevant published methods. As GISS' methods and data are available, you can do just that, as Tamino and others have independently done in order to debunk D'Aleo and Watts. There's nothing in the paper you link to in (56) that questions Harries et al (2001) at all. Not a shred. Actually, Raschke's paper reads as a rather weak review that comes to few definitive conclusions. Another Tamino link to educate you on trends. 0.3C is not a trend. The baseline for UAH is higher than that of GISS, which is the reason that the anomalies for UAH are lower values than those of GISS, hence the 0.3C difference. The trend is the same, and is that of the anthropogenic warming. Looks like Ned got there before me - good post Ned!
    0 0

1  2  3  4  5  Next

You need to be logged in to post a comment. Login via the left margin or if you're new, register here.


The Consensus Project Website

THE ESCALATOR

(free to republish)


© Copyright 2024 John Cook
Home | Translations | About Us | Privacy | Contact Us