Climate Science Glossary

Term Lookup

Enter a term in the search box to find its definition.

Settings

Use the controls in the far right panel to increase or decrease the number of terms automatically displayed (or to completely turn that feature off).

Term Lookup

Settings


All IPCC definitions taken from Climate Change 2007: The Physical Science Basis. Working Group I Contribution to the Fourth Assessment Report of the Intergovernmental Panel on Climate Change, Annex I, Glossary, pp. 941-954. Cambridge University Press.

Home Arguments Software Resources Comments The Consensus Project Translations About Support

Twitter Facebook YouTube Mastodon MeWe

RSS Posts RSS Comments Email Subscribe


Climate's changed before
It's the sun
It's not bad
There is no consensus
It's cooling
Models are unreliable
Temp record is unreliable
Animals and plants can adapt
It hasn't warmed since 1998
Antarctica is gaining ice
View All Arguments...


Username
Password
New? Register here
Forgot your password?

Latest Posts

Archives

UAH Misrepresentation Anniversary, Part 2 - Of Cherries and Volcanoes

Posted on 28 December 2011 by dana1981

Christy Crocks In Part 1 of this post, we examined the overconfidence that Roy Spencer and John Christy displayed in the University of Alabama at Huntsville (UAH) atmospheric temperature data - particularly in ther lower tropospheric temperature (TLT) estimates - in a press release marking the 33rd anniversary of the UAH satellite temperature record.  In Part 2 we will examine a number of other misleading and false claims made in the press release.

Out of Step with Reality

The UAH press release repeats the myth that the observed warming is just a step function change (a flat period followed by a spike, followed by another flat period) due to the El Niño in 1997-1998:

"There was little or no warming for the first 19 years of satellite data. Clear net warming did not occur until the El Niño Pacific Ocean “warming event of the century” in late 1997. Since that upward jump, there has been little or no additional warming."

The UAH data directly contradicts the claims in this quote.  We can see this by examining the trends while excluding the 1997-1998 El Niño.  The UAH trend from 1979 to November 1997 is 0.04°C per decade - small, but a net warming.  The trend from January 1999 through November 2011 is 0.18°C per decade - very clear warming, contrary to the press release claim.  In fact, the post-El Niño trend exceeds the trend for the entire record of 0.14°C per decade (Figure 1).

SC UAH

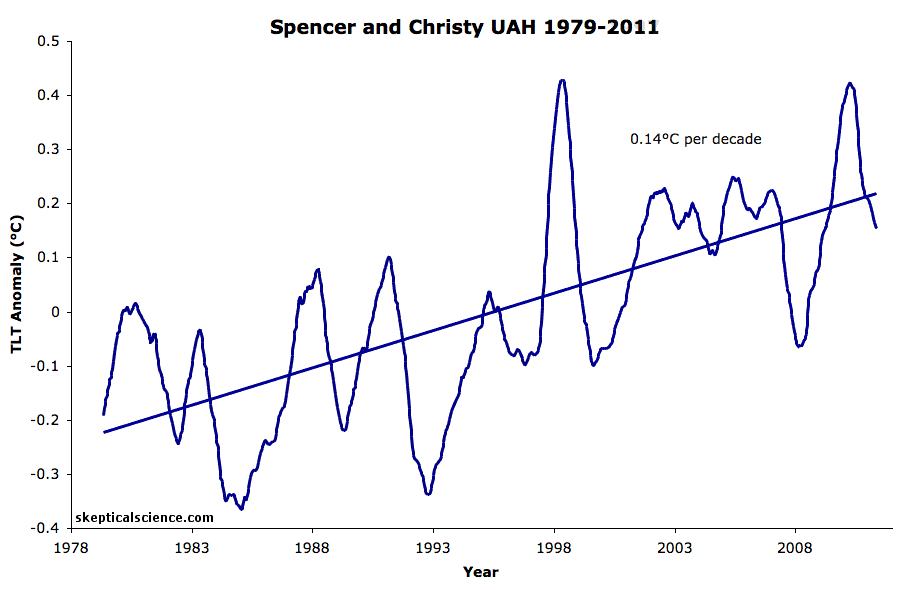
Figure 1: UAH data and linear trends for 1979 to November 1997, January 1999 to November 2011, and the full 1979 to 2011 record (12-month running average applied for smoothing).

Of course, Spencer and Christy may well have meant not 'since that upward jump' but 'including that upward jump'.  Indeed, from January 1998 to November 2011 the UAH trend has a low value of 0.06°C/decade.  It is, however, very easy to find low trends if you cherry pick your start and end points.  Spencer and Christy owe us, but do not provide some physical reason why we should expect a 'step change' as a result of the 1997-1998 El Niño, and not (for example) from the 1999-2000 La Niña.  The obvious explanation as to why no physical reason is given is that suggesting such step changes from El Niño events is absurd.  Appealing to them, however, sounds like an explanation, even though no explanation is actually given.  It acts, in other words, as a nice form of words to defuse any tendency to critical thought.

If there was a step change in temperature after the 1997-1998 El Niño, it would show up clearly as elevated temperatures after that event when we first filter out short-term influences on TLT, as Foster and Rahmstorf (2011) did (more on this paper below).  As Figure 2 shows, such an elevated jump in temperatures is absent from the record when the short-term influences (including El Niño) are filtered out.  What's more, the 1979 to 1999 trend is 0.10°C per decade, while the 1999 to 2010 is 0.21°C per decade, which again easily exceeds the trend for the entire record of 0.14°C per decade.  This clearly shows that Spencer and Christy's "upward jump" is an artifact of cherry picked starting points for a period short enough to be dominated by short-term fluctuations in temperature.

FR11 UAH trends

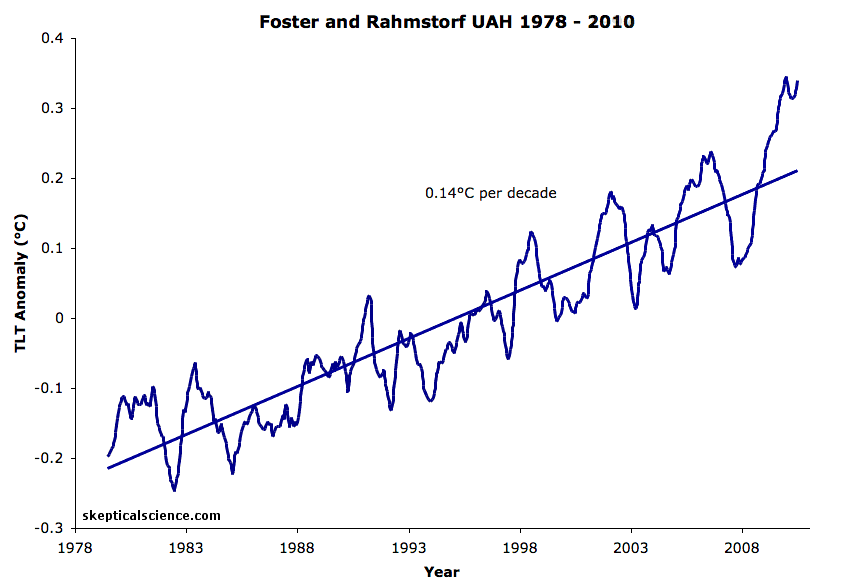
Figure 2: UAH data and linear trends for 1979 to 1997, 1999 to 2010, and the full 1979 to 2010 record after volcanic, solar, and El Niño factors have been removed by Foster and Rahmstorf (2011).  12-month running average applied for smoothing.

In short, the UAH press release claim that the TLT record is just a step change with no warming before or after the 1998 El Niño event is completely wrong.

Christy Cherrypicking

Later in the article, Christy discusses what happens to the UAH data when the effects of volcanic eruptions are removed:

"Part of the upward trend is due to low temperatures early in the satellite record caused by a pair of major volcanic eruptions.  Because those eruptions pull temperatures down in the first part of the record, they tilt the trend upward later in the record...When that cooling is subtracted, the long-term warming effect is reduced to 0.09 C (0.16° F) per decade, well below computer model estimates of how much global warming should have occurred."

First, why is Christy removing the volcanic forcing from the UAH data without removing it from the models?  This is not an apples-to-apples comparison.

Second, while removing the short-term natural influence of volcanic eruptions is a valid analysis (if done correctly), it also makes us wonder, why only volcanoes?  After all, there are other short-term natural influences on the global surface and atmosphere temperatures, like solar activity and the El Niño Southern Oscillation (ENSO) for example.

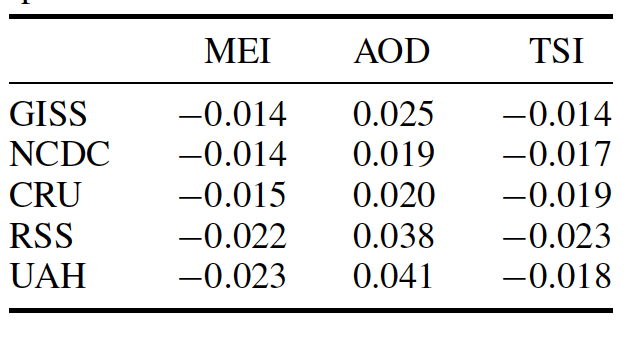
We recently examined a paper by Foster and Rahmstorf (2011) which removed all three of these influences from the temperature record using multiple regression.  They found that, as Christy notes, the timing of volcanic activity has resulted in a slight warming trend over the past 33 years.  However, decreased solar activity (measured by either total solar irradiance [TSI] or sunspot number) and ENSO cycles have both had cooling effects since 1979.  Their net effect on UAH has been approximately zero, and they have had a net cooling effect on the other major temperature records (Table 1).

Table 1: Trends in  °C/decade of the signal components due to ENSO (as measured by the Multivariate ENSO Index [MEI]), volcanoes (as measured by aerosol optical depth [AOD]), and TSI in the regression of global temperature, for the major temperature records from 1979 to 2010.  Source: Foster and Rahmstorf (2011)

table 3

Quantifying Man-Made Warming

Next up in the article, Roy Spencer denies that we can quantify the amount of warming caused by human greenhouse gas emissions:

"How much of that underlying trend is due to greenhouse gases? While many scientists believe it is almost entirely due to humans, that view cannot be proved scientifically"

As a matter of fact, two recent studies have taken distinct and clever approaches to quantify how much of the warming trend is due to humans.  The aforementioned Foster and Rahmstorf paper filtered out the effects of the three largest short-term natural influences on global temperature, and estimated the resulting (almost entirely man-made) trend at approximately 0.16°C per decade since 1979 (Figure 3).

before/after filtering

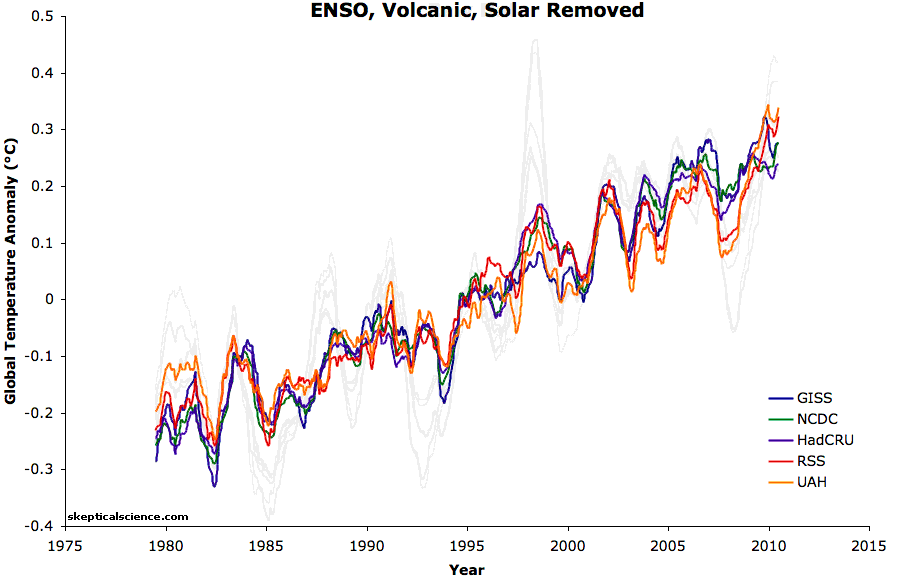
Figure 3: Temperature data (with a 12-month running average) before and after  the Foster and Rahmstof removal of solar, volcanic, and ENSO influences.

Huber and Knutti (2011) found essentially the same result by applying the principle of conservation of energy.  They determined that approximately 100% of the warming since 1950 has been caused by human effects (Figure 4).  In fact, because substantial warming has been offset by human aerosol emissions, Huber and Knutti concluded that greenhouse gases have caused 66% more warming than has been observed since 1950.

knutti attribution

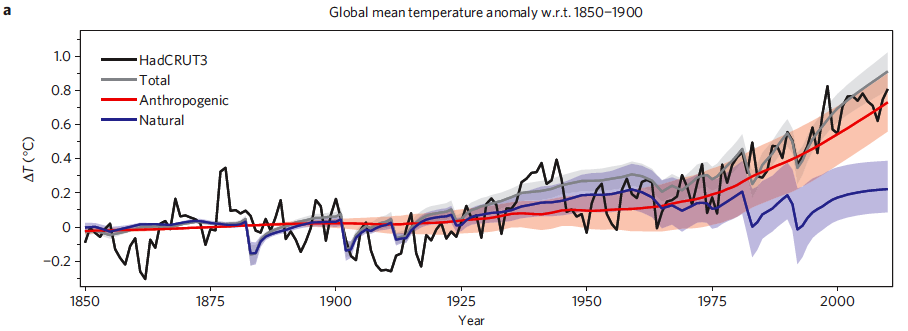
Figure 4: Time series of anthropogenic and natural forcings contributions to total simulated and observed global temperature change. The colored shadings denote the 5-95% uncertainty range.  Source: Huber and Knutti (2011)

Moreover, scientists have observed a number of 'fingerprints' of human-caused warming (Figure 5).

fingerprints

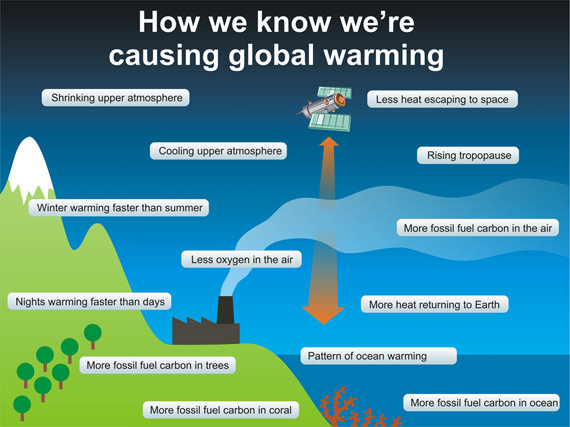
Figure 5: 'Fingerprints' of human-caused warming

Spencer expanded on his claim in his follow-up blog post:

"In my opinion, the supposed “fingerprint” evidence of human-caused warming continues to be one of the great pseudo-scientific frauds of the global warming debate....Many papers indeed have claimed to find a human “fingerprint”, but upon close examination the evidence is simply consistent with human caused warming — while conveniently neglecting to point out that the evidence would also be consistent with naturally caused warming."

While it's true that many of these examples are simply consistent with what we expect to see from anthropogenic warming, it's not a coincidence that they are indeed all consistent with human-caused warming.  Nobody (including Spencer) has yet put forth an alternative hypothesis for the observed global warming which could explain all of these 'fingerprints'.  Moreover, as noted above, we know the warming is human-caused based on both statistical (i.e. Foster and Rahmstorf) and physical (i.e. Huber and Knutti) approaches.  At some point, one has to accept the multiple lines of overwhelming evidence all pointing in the same direction.

UAH Misrepresentation and Self-Contradiction

In this UAH press release, Spencer and Christy have made a number of unsupported and misleading statements, based on the UAH temperature data.  While it's true that there is a discrepancy between the model-expected and observed ratios between lower atmosphere and surface warming, the ratio is not nearly as large as Christy claims, as shown by Santer et al. (2011).  Moreover, Christy's assumption that the problem lies with the models, rather than his own data, is unsupported, and in fact a cool UAH bias may very well be the most likely explanation for the discrepancy.  In fact, that was the conclusion of a U.S. Climate Change Science Program (CCSP) document in 2006, on which John Christy himself was a lead author (emphasis added):

"These results could arise either because “real world” amplification effects on short and long time scales are controlled by different physical mechanisms, and models fail to capture such behavior; or because non-climatic influences remaining in some or all of the observed tropospheric data sets lead to biased long-term trends; or a combination of these factors.

The new evidence in this Report favors the second explanation."

Christy also made a misleading claim about the warming thus far not obviously representing impending disaster, leaving out critical information like the rate of warming and future expected warming.  Spencer made perhaps the most misleading assertion, claiming that the human contribution to the observed warming can't be quantified, when in fact a number of scientific studies have done exactly that using a number of different methodologies, including two published in the past couple of months.  The aforementioned CCSP document on which Christy was a lead author also contradicts Spencer here:

"Fingerprint studies have identified greenhouse gas and sulfate aerosol signals in observed surface temperature records"

All in all, not an auspicious way to celebrate the UAH data set 33rd anniversary.  It's worth noting that Spencer and Christy admit that there has been warming, and they have previously acknowledged that some amount of that warming is due to human activities.  However, their comments in this press release reveal a number of attempts to downplay the amount of warming, the danger it represents, the human contribution, and the fact that their data set is the outlier.

0 0

Printable Version  |  Link to this page

Comments

Comments 1 to 33:

  1. Just a comment. I don't really think that the Foster and Rahmstorf paper is evidence of anthropogenic global warming. They did remove the influence of the sun, ENSO and volcanoes but if global warming is natural, then there's no expectation that that signal is going away. As I see it, that papers assumes (correctly and based on a body of scientific research) that global warming is mainly anthropogenic and then removes spurious factors that obscure that trend. Of course, they do show that GW cannot be due to the Sun, volcanoes or ENSO.
    0 0
    Response:

    [dana1981] The text has been modified slightly to note that the leftover trend after the FR11 removal of those three exogeneous factors is almost entirely anthropogenic, which was the reason it was included in the discussion in question.

  2. Daneel - considering that the sun and volcanoes are the dominant natural external forcings, and they also filter out the main internal variation (ENSO), Foster and Rahmstorf's paper is strong indirect edvidence for AGW.
    0 0
  3. DaneelOlivaw @1, "As I see it, that papers assumes...that global warming is mainly anthropogenic..." It is not my understanding that Foster and Rahmstorf (2011, FR11) assume that a priori in their paper; I do not think that is a fair assessment of their paper by you. They find that what emerges when one removes the short-term, transient noise is a steady long-term warming trend. That steady background warming is what is very troublesome for the fake skeptics and those who deny the theory of anthropogenic global warming (AGW). The point is that natural variation alone cannot explain the observed warming trends in the data. From RF11: "Perhaps most important, it enables us to remove an estimate of their influence, thereby isolating the global warming signal. The resultant adjusted data show clearly, both visually and when subjected to statistical analysis, that the rate of global warming due to other factors (most likely these are exclusively anthropogenic) has been remarkably steady during the 32 years from 1979 through 2010. There is no indication of any slowdown or acceleration of global warming, beyond the variability induced by these known natural factors. Because the effects of volcanic eruptions and of ENSO are very short-term and that of solar variability very small (figure 7), none of these factors can be expected to exert a significant influence on the continuation of global warming over the coming decades." "Of course, they do show that GW cannot be due to the Sun, volcanoes or ENSO. " Yes, but if one does not like RF11 then their is another excellent paper Huber and Knutti (2011) that estimates the anthropogenic global warming component. Regardless, there go the fake skeptics' favourite cycles that they like to try and attribute the warming to. That is the true significance of the FR11 paper. Now that they have been forced to accept that the warming is real, Roy Spencer and his fellow fake skeptics are forced to try and attribute the warming to all kinds of natural cycles/oscillations while at the same time trying to claim that the present warming is insignificant in magnitude (i.e., inferring that the future warming will not be bad)-- the logical fallacy is obvious. So anything to downplay the anthropogenic component and to cast doubt is their means to delay taking meaningful action on reducing GHG emissions. They are quite good at it, at least when it comes to misleading people who do not know (and sometimes even those who should know) better. The big tell in the fake skeptics' game is that they have yet to develop a cohesive, physically-based and internally consistent theory that explains all the fingerprints and the nature of the observed warming.
    0 0
  4. Roy Spencer states the following in his Dec 21 blog post, “Addressing Criticisms of the UAH Temperature Dataset at 1/3 Century”. “Earlier this week we reported on the latest monthly global temperature update, as we do every month, which is distributed to dozens of news outlets.” Who exactly are the recipients of the monthly temperature updates/news release? Are they all legitimate news organizations? I pose these questions because I cannot find the monthly temperature updates/news release posted on either the website of the University of Alabama Huntsville (UAH) or on the website of the UAH’s Earth System Science Center. In addition, why does Roy Spencer engage in a discussion about the UA temperature updates/news release on his private blog site rather than on the public website of the Earth System Science Center? Click here to access Spencer’s private blog.
    0 0
  5. About this part: Of course, Spencer and Christy may well have meant not 'since that upward jump' but 'including that upward jump'. Of course, if you include the 'upward jump' in the part before 1998, you also get a lot of warming. The main point is the final trend in the fig. 1 gif: the whole period has a clear warming. You can play with words to get people paying attention to pieces of it, but it does not make the warming go away.
    0 0
  6. Daneel, based on our understanding of atmospheric physics we expect human activities, ENSO, and volcanic eruptions to cause significant warming on short time scales. Thus, if we filter out two of these (along with solar effects, which are actually tiny on short time scales but constantly cited by 'skeptics' anyway) then logically any trend remaining should be largely due to the third. F&R thus does indeed show "evidence" of the anthropogenic trend. Yes, there could still be unknown magical forces out there which are canceling out the warming GHGs should be causing AND simultaneously causing identical warming patterns (see the 'fingerprints' section of the article) themselves... but that's empty speculation with no foundation whatsoever. Every test we are able to perform confirms humans are responsible for the warming. The chances of that being incorrect due to multiple unknowns just happening to align to give the wrong impression is vanishingly small.
    0 0
  7. DaneelOlivaw @1, not only do Foster and Rahmstorf 2011 show that neither the sun, volcanoes or the El Nino Southern Oscillation (or any combination of them) are responsible for the current warming; they also show that what ever is responsible has had a near constantly increasing effect over the last 33 years. So which mythical natural cause of global warming has that property? Not the Atlantic Multidecadal Oscillation: Not the Pacific Decadal Oscillation: Not Cosmic Rays: F&R2011 not only show the effects of short term variations in ENSO, etc. By doing so they also show that the remaining long term trend is inconsistent with all the favourite fake skeptic "natural" explanations leaving anthropogenic forcing as the only currently proposed mechanism consistent with the data. It follows that R&F2011 is strong evidence that the current warming is due to anthropogenic forcings.
    0 0
  8. Tom the only thing you missed out is man made frequency abuse (noise)Here's a link from NASA that looks at noise,microwave frequencies and temperature http://descanso.jpl.nasa.gov/Monograph/series10/06_Reid_chapt+6.pdf Cheers and have a great day
    0 0
    Moderator Response: As Tom replied to you, your comment is off topic not just for this thread but for this entire site.
  9. jmorpuss @8, the paper you link to discusses the atmosphere as a source of noise for radio telescopes and has nothing to do with either the main article above or subsequent discussion. Nor does it discuss man made noise as you claim. My day is not improved by you wasting my time.
    0 0
  10. I understand what you are telling me and I agree. There's no magical mechanism that could explain the steady linear trend but anthropogenic CO2, BUT... I think that this post is not strictly correct when it says that "The aforementioned Foster and Rahmstorf paper filtered out the effects of the three largest short-term natural influences on global temperature, and estimated the resulting man-made trend at approximately 0.16°C per decade since 1979 (Figure 3)". Strictly speaking what they found is a linear trend of about 0.16ºC per decade when you remove some natural factors. The paper, by itself, does not say anything about what is actually causing this trend. Of course, taking into account prior studies and basic physics means acknowledging that the cause is anthropogenic. I'll take this quote, cited by Albatros @3: "The resultant adjusted data show clearly, both visually and when subjected to statistical analysis, that the rate of global warming due to other factors (most likely these are exclusively anthropogenic) has been remarkably steady during the 32 years from 1979 through 2010" The data presented in RF11 alone, IMO, cannot be used to prove that statement. That the causes are "most likely anthropogenic" is a (correct) conclusion based on previous research. I may have been wrong in saying that "I don't really think that the Foster and Rahmstorf paper is evidence of anthropogenic global warming". In a second thought, I agree with dana1981 @2 in that "Foster and Rahmstorf's paper is strong indirect edvidence for AGW", but my point is that it's not a paper about attribution but about quantification. It takes the stance that the attribution problem is long settled (as it is) and then takes it from there; that's the way science works. But for fake sceptics I don't think FR11 would be compelling since they are stuck in a long forgotten (and mostly imaginary) past when we didn't know what could possibly cause a positive trend in global average temperatures.
    0 0
  11. DaneelOlivaw @10, in light of the fact that you agree that Foster and Rahmstorf 2011 "... is strong indirect evidence for AGW", and that it quantifies the linear trend, it follows logically that it is strong indirect evidence that the anthropogenically caused linear trend is approximately 0.16 degree C per decade. All that it lacks as a quantification of "... how much of the warming trend is due to humans" is an error estimate on the proportion of anthropogenic contribution to the trend. Further, discussion of F&R2011 is clearly relevant to Spencer's claim. Foster and Rahmstorf clearly are doing what Spencer claims cannot be done scientifically, ie, showing how much of the underlying trend is due to certain factors. Given that, your objection to the wording in the blog is raising a very subtle point. I am unsure what raising that point contributes to the discussion, nor how the post could be better worded to meet your objection.
    0 0
  12. @john hartz. Dr Roy Spencer's satellite derived temperature data can be found here http://www.drroyspencer.com/latest-global-temperatures/
    0 0
  13. "I don't really think that the Foster and Rahmstorf paper is evidence of anthropogenic global warming." Their research redux's to the Albedo Influence, the Greenhouse Effect, or God. Based on the evidence, my vote goes to the Greenhouse Effect.
    0 0
  14. owl905, actually 'albedo influence' would be a feedback effect... I suppose land use changes can create an albedo forcing, but that would be tiny on short time scales. The larger ice albedo change is a feedback on other factors forcing the temperature one way or the other. I assume that the large feedbacks like ice albedo and water vapor were factored in when F&R were filtering out the effects of natural forcings. If they adjusted for just the direct impact of the forcings then the feedback on those forcings would still be causing swings in the end result. There have been other studies which worked to separate out the different factors responsible for observed warming. F&R is just a new methodology and another step forward. Eventually we may be able to identify and chart each significant component to enough certainty that the remaining greenhouse forcing looks like a nearly straight line. At which point we'd also be able to use observations of natural forcings to better predict temperatures, and thus weather, in the immediate future.
    0 0
  15. Daneel's objection in #1 seems to be founded, since FR2011 is not an attribution study. Of course, AOGCMs simulations, which are in charge of such attribution, suggest the 0,16 K/dec signal FR2011 have separated from natural noise very likely emerges from GHG forcing. And so did HK2011 with a model of intermediate complexity. The Christy's idea that we would need an ultimate "proof" for the role of GHG must be questioned. In climate studies, and particularly in detection-attribution, there is no other "proof" that the results of models implementing the "state of the art" physics of climate. Any climate scientist unsatisfied with models has to publish a critical analysis of their radiative or convective schemes in order to show they do a bad job and miss some essential mechanisms of Earth climate. Discrepancies between observations and simulations are frequent, but they are not considered as fatal flaws as long as models get the "big picture" right. It is the case, and that's why IPCC AR4 2007 concluded that most of the observed warming since the 1950s is very likely due to GHG forcing. Even if we imagine that UAH is correct on TLT, and so that models slightly overestimate the warming of LT, this would imply that the transient (not equilibrium) water vapour and lapse rate feedbacks have to be adjusted so as to better fit the observations. Such an optimization would not be a revolution, and would not create by itself a "new cause" for the observed surface warming. At least it is the way I understand these questions.
    0 0
  16. skept.fr#15:"FR2011 is not an attribution study. " Let's not start that again. FR2011, as discussed at length here, finds that when a mere three 'natural factors' are removed from the temperature record, a strikingly consistent linear trend emerges. Here's the resulting 'attribution': Those three factors do not contribute to the underlying trend. Thus some other thing(s) must be the dominant factor(s). Suggestions? I know one ... Based on FR2011, the UAH press release, quoted under 'Out of Step with Reality' is incorrect. Worse still, coming out after FR2011's publication, it is mere opinion masquerading as 'fact.' That's clearly a deliberate attempt to mislead; a more objective statement would be something like 'Despite a recent publication indicating we are incorrect, our opinion is still that we're not.' Spencer and Co. have lost all credibility and should be ignored by anyone seriously studying this issue. Of course, that's not exactly news. Spencer is on record as saying he's biased and a lobbyist, not a scientist: “I view my job a little like a legislator, supported by the taxpayer, to protect the interests of the taxpayer and to minimize the role of government.” Last I looked, we elect our legislators. We'd prefer our scientists to do their job - gather accurate data and provide unbiased interpretations.
    0 0
  17. A very "extensive post", really showing particulars errors UAH - Spencer and Christy. ... but, as usual, says "too much" of their - Spencer and Christy - general conclusions. „Many papers indeed have claimed to find a human “fingerprint”, but upon close examination the evidence is simply consistent with human caused warming — while conveniently neglecting to point out that the evidence would also be consistent with naturally caused warming.” - write Spencer. “... because “real world” amplification effects on short and long time scales are controlled by different physical mechanisms, and models fail to capture such behavior ...” - write Christy. ... It is these: “ ... a number of attempts to downplay the amount of warming.” As a decisive evidence of the lack of impact - the climate - natural changes linked with the Earth and the Sun “... during the past 80 years ...”, presented in this year: Dickey and Marcus from NASA's along with de Viron, from the Universite Paris. ““Our research demonstrates that, for the past 160 years, decadal and longer-period changes in atmospheric temperature correspond to changes in Earth’s length of day if we remove the very significant effect of atmospheric warming attributed to the buildup of greenhouse gases due to mankind’s enterprise,” said Dickey. “Our study implies that human influences on climate during the past 80 years mask the natural balance that exists among Earth’s rotation, the core’s angular momentum and the temperature at Earth’s surface.” This was to confirm this figure. But when we "will correct" this figure - including figure (different data from ca 1980) that we get long-term cyclic anti-correlation (LOD- Glob. Temp.) - in "long time scales" - to this day. About this is a R. Spencer blog - comments - Earth rotation - by salvatore del prete. I recommend reading of Influence of solar variability on rotation and climate of the Earth, Kuznetsova (2010): “We suggest a possible explanation of observed unexplained increasing in the Tnh [Temperature North Hemisphere] for the interval 1905-1940 and its subsequent decrease for 1940-1976 with rate 0.75 deg.C/100yr (in spite of the fact that the release of CO2 increased rapidly; at that time we had debates about the coming of a new ice age) by variation in w with period of 72 yr.” “We present arguments of solar-lunar origin of the power cycle, which is approaching to a maximum for now.” “The Poyting flux coming to polar cap leads in the end to heating of polar ionosphere and atmosphere, temperature contrast between two caps, intensification of the inter-hemisphere heat machine in the upper atmosphere ...” And also affect the clouds cover and natural aerosols of atmosphere. Next - for this reason: - heat comes now further (and bigger number of heat) in the North (the North Atlantic is narrow - like "neck of the bottle"). Arctic temperatures, Canada and Europe growing faster, also activated equatorial zone the deep upwelling - natural sources of GHG increase ... ... “fingerprint” this process “... be consistent with naturally caused warming ...”? So, if we examine the (a comprehensive) other natural factors (not just the TSI, ENSO and volcanoes - supposedly the greatest - the most important natural factors), it ...
    0 0
    Response:

    [DB] Having read this comment several times now, I must agree with KR below:  you use a lot of words to say nothing at all.  As such, your entire comment devolves to Gish Gallop, handwaving off-topicness.

    Future comments constructed as such will simply be deleted.

  18. I have replied regarding the F&R 2011 study on the (far) more on-topic Foster and Rahmstorf thread. Perhaps we could reserve this thread for discussing the UAH record, and Spencer and Christys representations thereof?
    0 0
  19. @mace #12: Your point begs the question: Why does Spencer post his satellite derived temperature data on his private website, and not on the website of the UAH’s Earth System Science Center?
    0 0
  20. According to Eli Rabett, Spencer and Christy have yet to make public the software they use to convert the data collected by the NASA satellites into their estimates of the temperatures of the lower troposphere (TLT) and of the mid troposphere (TMT). As Rabett suggests in “MacIntyre and Mosher at the door, hand over the rent.” posted Dec 21, 2011 on his blog, Rabett Run, someone in the US ought to file an FOIA request for the software so it could be scrutinized by experts with microwave and programming experience.
    0 0
  21. Arkadiusz - I would have to consider your last post to be approaching a Gish Gallop, a series of half-truths and misrepresentations. You quote an article that in turn misinterprets Dicky et al 2011, where they examine a number of cyclic influences, pointing out that "In all ... cases, their signals would be much smaller than the anthropogenic greenhouse gas effect on Earth’s radiation budget during the coming century." Hardly a disproof of anthropogenic warming. You follow this by pointing at unsourced graphs without definitions or context, apparently claiming that length of day is a major driver of climate (in contradiction to Dickey), Koznetsova's "climastrology" claims of long term cycles (basic curve-fitting without physical mechanisms), introduce an apparently unrelated argument about ocean upwelling, and trail off without having said anything at all. Make an argument, actually state something, supported by data and peer-reviewed papers, Arkadiusz - what you are doing now is (IMO) just adding to the noise level and trolling.
    0 0
  22. skept.fr @15, F&R2011 is not an attribution study. However, it does have certain features in common with attribution studies, ie, picking out the contribution of various features to the overall temperature record. Those features do what Spencer says it is not possible to do, ie, to pick out how much of the record is due to certain features. Therefore F&R2011 is a clearly relevant paper in rebutting Spencer's claim. Now, if you or anyone else can come up with a suitable form of words to capture this nuance without being too wordy, I'm sure Dana would love to incorporate the revision. But if you cannot come up with suitable words which do not rival in length the current section as is (and nobody has to date), then this has all the appearance of an irrelevant nit pick.
    0 0
  23. Isn't this a whopper of an error? "Part of the upward trend is due to low temperatures early in the satellite record caused by a pair of major volcanic eruptions. Because those eruptions pull temperatures down in the first part of the record, they tilt the trend upward later in the record" A pair of major eruptions? Pinatubo (1991) is not 'early' in the temperature record, which starts in 1979. The resulting global cooling lasted all of a year and a half. Surely he's not referring to Mt. St Helens, as that hardly produced any cooling on a global scale: While the Mount St. Helens eruption of 1980 was very explosive, it did not inject much sulfur into the stratosphere. Therefore it had very small global effects There is no 'pulldown' in the record, nor would a short-term cooling 'tilt' the trend for the later period. That's just ridiculous.
    0 0
  24. muoncounter @23, Spencer is referring to El Chichon and Mount Pinatubo.
    0 0
  25. Further to my 24, a large cooling or warming event, even of short duration, can effect trends over short (30 year) time spans if located near to the start or end of the sequence. F&R2011 show volcanic effects as introducing a 0.041 C/decade warming effect to the overall UAH record (see table 1 of main post) so Christy is in fact correct. He is also cherry picking by ignoring the impacts of ENSO and TSI on the trend over the same period.
    0 0
  26. For an interesting background, one can read Thorne et al 2011, Tropospheric temperature trends: history of an ongoing controversy . Their conclusion is clear and opposite to the UAH press release: "Overall, there is now no longer reasonable evidence of a fundamental disagreement between models and observations with regard to the vertical structure of temperature change from the surface through the troposphere. This is mainly due to a much better understanding of the real level of uncertainty in estimates of past changes and expectations from climate models."
    0 0
  27. #22 Tom : no better wording for Dana, sorry. The precise quantification of GHGs specific warming is not really possible with models in their actual states (different models will produce different estimates because they parametrize differently many details or begin their run with slightly different initial conditions), so I think the problem is not the formulation itself. The point of Christy was just non-sensical rhetoric: there is no real uncertainty about GHGs as the first known factor of warming since 1979 (and for the next decades), to require a precise quantification is simply a kind of dubious distraction. Let's say I've an epidemiological model of flu, whose conclusion is that the past epidemics had killed 10-50 million, and the next one will kill 2-5 million. It is clearly unimportant to ask for a "better quantification", because the major conclusion about the threat and its cause is self-evident. (A short epistemological reflexion on the notion of "proof" advanced by Christy would also have been of interest for SkS readers, IMO.)
    0 0
  28. Tom C#25: There's a problem with the el Chicon eruption (1982): Because of the simultaneous eruption and El Niino, the climatic system felt the impacts of both, and it was difficult to separate their effects on temperature. Normally a large eruption like this would cool the global climate, especially in the summer, but during the first year after the El Chich´on eruption, no large cooling was observed, as the El Ni˜no produced large compensating warming. That's very well illustrated in FR Fig 6, which shows AOD with a calculated effect of -0.2 to -0.3C vs. MEI with +0.3 to +0.4C for the period immediately after the el Chicon eruption. If you look at the raw data (FR fig 1), the bulk of the cooling on UAH and RSS doesn't occur until 1985, a full 3 years after the eruption. That's not the volcano. The UAH graph shows a large cooling (-0.25 C) centered around 1985 with a 3-4 year duration, yet this is not labeled by UAH as 'el Chicon cooling'; the 1993 cooling is clearly labeled 'Mt. Pinatubo'. So Christy's contention that there are two volcanic coolings 'early in the record' is not correct.
    0 0
  29. muoncounter @28, I think your point is well made. However, rather than say there was not two volcanic coolings (there where) I would say that Christy is doubly inconsistent in ignoring ENSO effects as he needs to ignore ENSO effects to find his first cooling.
    0 0
  30. Yes I think it's important to bear in mind that Christy is exclusively filtering out impacts from volcanic eruptions. It's true that those two volcanic eruptions produced a short-term cooling effect towards the first half of the record. It would be more accurate to say that El Chichon pulled the temperature down below where it would have otherwise been (which is moving upwards due to the El Nino). That's the problem with cherrypicking one short-term effect to filter out while ignoring other similar effects. It's a very poor analysis by Christy.
    0 0
  31. dana#30: "El Chichon pulled the temperature down below where it would have otherwise been (which is moving upwards due to the El Nino)." Agreed. If you download the data from FR2011 and graph UAH/RSS and the three externals (MEI, AOD and TSI; each lagged appropriately), that picture is clear. Without el Chicon, the el Nino warming of 1983 would have been much larger. That's only a 'cooling effect' in the strictest sense of the word - and that could mislead a reader to conclude that the apparent coolings on either side of 1983 were primarily due to the volcano. This further reinforces the fact that Christy's 'two volcanic eruptions tilted the trend' is incorrect: 1985's cooling is better described as the tail end of the volcanic aerosols coupled with a negative MEI.
    0 0
  32. “Wow – Christy’s Global Warming Skepticism is Evolving,” by Ove Hoegh-Guldberg contains a graph by John Abraham showing an upward trend in John Christy‘s published conclusions about the rate of climate change in the troposphere.
    0 0
  33. Isaac Held talks of MSU: http://www.gfdl.noaa.gov/blog/isaac-held/2012/01/01/21-temperature-trends-msu-vs-an-atmospheric-model/
    0 0

You need to be logged in to post a comment. Login via the left margin or if you're new, register here.


The Consensus Project Website

THE ESCALATOR

(free to republish)


© Copyright 2024 John Cook
Home | Translations | About Us | Privacy | Contact Us