Climate Science Glossary

Term Lookup

Enter a term in the search box to find its definition.

Settings

Use the controls in the far right panel to increase or decrease the number of terms automatically displayed (or to completely turn that feature off).

Term Lookup

Settings


All IPCC definitions taken from Climate Change 2007: The Physical Science Basis. Working Group I Contribution to the Fourth Assessment Report of the Intergovernmental Panel on Climate Change, Annex I, Glossary, pp. 941-954. Cambridge University Press.

Home Arguments Software Resources Comments The Consensus Project Translations About Support

Twitter Facebook YouTube Mastodon MeWe

RSS Posts RSS Comments Email Subscribe


Climate's changed before
It's the sun
It's not bad
There is no consensus
It's cooling
Models are unreliable
Temp record is unreliable
Animals and plants can adapt
It hasn't warmed since 1998
Antarctica is gaining ice
View All Arguments...


Username
Password
New? Register here
Forgot your password?

Latest Posts

Archives

Foster and Rahmstorf Measure the Global Warming Signal

Posted on 20 December 2011 by dana1981

Foster and Rahmstorf (2011) have published a paper in Environmental Research Letters seeking to extract the human-caused global warming signal from the global surface temperature and lower troposphere temperature data.  In order to accomplish this goal, the authors effectively filter out the effects of solar activity, the El Niño Southern Oscillation (ENSO), and volcanic activity.  The result is shown in Figure 1 below.

Fig 5

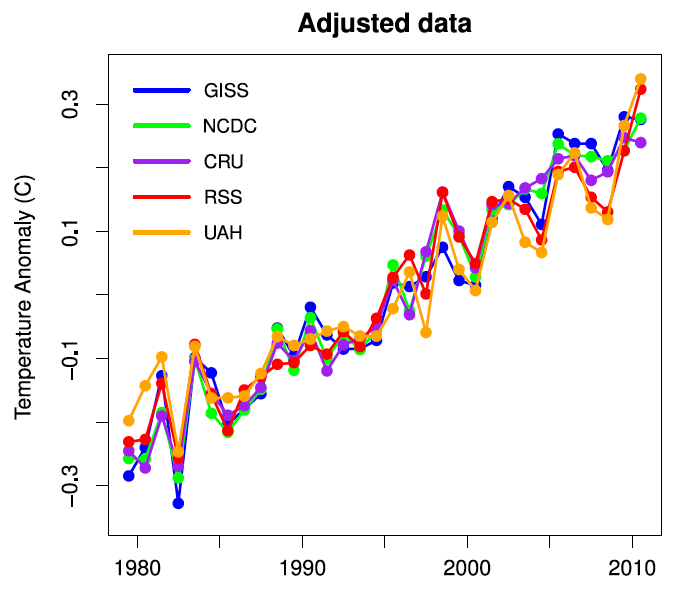
Figure 1: Annual averages of the adjusted data - the global warming signal

Foster and Rahmstorf characterize ENSO by using the Multivariate ENSO Index (MEI), aerosol optical thickness data (AOD) for volcanic activity, and solar irradiance data (from PMOD) to characterize solar activity.  They also tried using Southern Oscillation Index (SOI) data for ENSO, sunspot number data for solar activity, and a volcanic radiative forcing reconstruction from Ammann et al. (2003), but found these changes made little difference to their results:

"None of these substitutions affected the results in a significant way, establishing that this analysis is robust to the choice of data to represent exogenous factors."

They approximated the influence of these exogeneous factors by using multiple regression of MEI, AOD, and PMOD on temperature data from GISS, NCDC, HadCRU, RSS, and UAH.  Since those exogeneous factors can have a delayed effect on temperatures, they tested lag values from 0 to 24 months to see which best fit the data.  The results are listed in Table 1.

Table 1: Warming rates in  °C/decade for 1979-2010, and lag in months, for each of the five temperature records and each of the three exogenous factors. Numbers in parentheses are standard errors in the final digits of the estimated values.

table 1

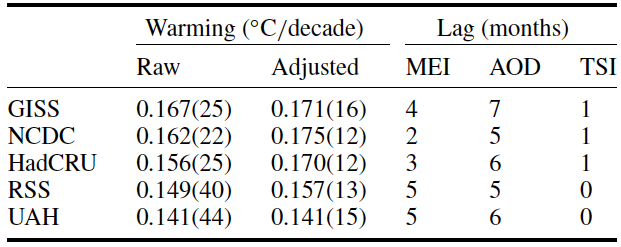
As Table 1 shows, filtering out these external effects increased the 32-year warming trend in every data set except UAH.  This analysis reveals that the underlying human-caused global warming trend in the surface temperature data ranges between 0.170 and 0.175°C per decade, and between 0.141 and 0.157°C per decade in the two main satellite lower troposphere temperature data sets. 

This is a very similar result to Huber and Knutti (2011), who estimated that approximately 100% of the observed surface warming since the 1950s has been caused by human effects.  This corresponds to approximately 0.55°C warming, most of which has occurred since mid-1970, for 0.15 to 0.20°C per decade anthropogenic warming, based on the Huber and Knutti results.

Additionally, we see that the lag before ENSO is reflected in surface temperature is 2 to 4 months, 5 to 7 months for volcanic effects, and 1 month for changes in solar activity.  In the lower troposphere, the lags are 5, 5-6, and zero months, respectively.  The authors conclude:

"When the fluctuations in temperature over the last 32 years (which tend to obscure the continuation of the global warming trend) are accounted for, it becomes obvious that there has not been any cessation, or even any slowing, of global warming over the last decade (or at any time during this time span). In other words, any deviations from an unchanging linear warming trend are explained by the influence of ENSO, volcanoes and solar variability....It is worthy of note that for all five adjusted data sets, 2009 and 2010 are the two hottest years on record....All five data sets show statistically significant warming even for the time span from 2000 to the present."

Overall, Foster and Rahmstorf find that ENSO has the largest impact on short-term temperature variations, followed by volcanic activity, with solar irradiance a distant third.  However, the contributions of each factor to the 32-year temperature trends were very similar (Table 2, Figure 2).

Table 2: Trends in  °C/decade of the signal components due to MEI, AOD and TSI in the regression of global temperature, for each of the five temperature records from 1979 to 2010.

table 3

Figure 7

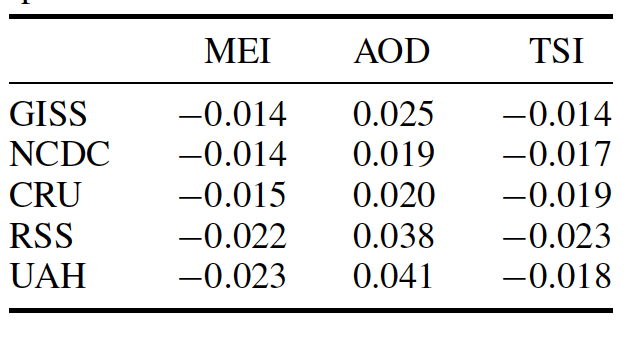
Figure 2: Influence of exogenous factors on global temperature for GISS (blue) and RSS data (red). (a) MEI; (b) AOD; (c) TSI.

These factors contributed to very slight cooling of global temperatures over the past 32 years, with the execption of UAH, for which they have had no net impact on the trend.  Figure 3 shows the temperature data before and after the Foster and Rahmstorf exogeneous factor removal.

before/after filtering

Figure 3: Temperature data (with a 12-month running average) before and after the exogeneous factor removal

The authors conclude by averaging all of the data sets together (Figure 4):

"Because the effects of volcanic eruptions and of ENSO are very short-term and that of solar variability very small, none of these factors can be expected to exert a significant influence on the continuation of global warming over the coming decades. The close agreement between all five adjusted data sets suggests that it is meaningful to average them in order to produce a composite record of planetary warming.  [Figure 3 shows] the true global warming signal."

figure 8

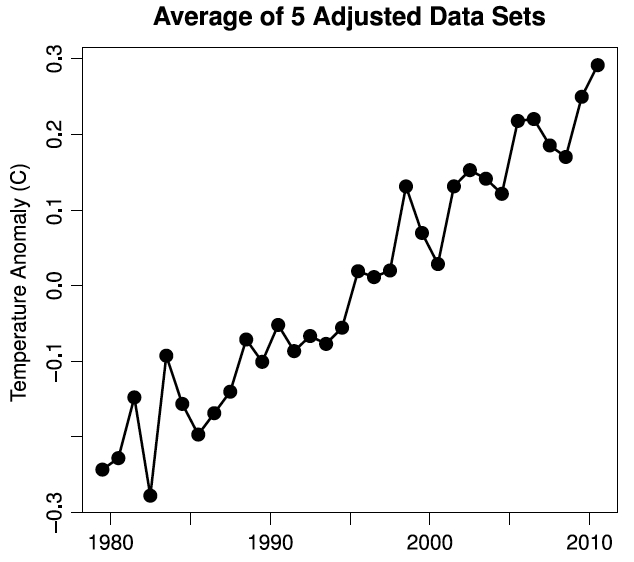
Figure 4: Average of all five adjusted data sets.

Based on this average of all five adjusted data sets, the warming trend has not slowed significantly in recent years (0.163°C per decade from 1979 through 2010, 0.155°C per decade from 1998 through 2010, and 0.187°C per decade from 2000 through 2010).  As Foster and Rahmstorf conclude,

"The resultant adjusted data show clearly, both visually and when subjected to statistical analysis, that the rate of global warming due to other factors (most likely these are exclusively anthropogenic) has been remarkably steady during the 32 years from 1979 through 2010. There is no indication of any slowdown or acceleration of global warming, beyond the variability induced by these known natural factors."

For more on this paper, see tamino's take.

Note: the Foster and Rahmstorf results have been incorporated into the rebuttals to It's the sun (Intermediate and Advanced), A drop in volcanic activity caused warming, It's El Niño, Global warming stopped in [insert year], It hasn't warmed since 1998, and It's cooling

0 0

Printable Version  |  Link to this page

Comments

1  2  Next

Comments 1 to 50 out of 100:

  1. Dana: SkS readers who are not well-versed in climate science acronyms and terminology will have a hard time understanding the information presented in this article.
    0 0
  2. Dana: Is the version of Figure 2 with "Enso, Volcanic, Solar Removed" identical to Figure 1?
    0 0
    Moderator Response:

    [dana1981] Almost but not quite.  The points in Figure 1 are annual averages.  For Figure 2, I just took a 12-month running average.  So rather than having 1 point per year, Figure 2 has 1 point per month, each point being the average of the surrounding 12 months.

  3. I have two questions: do you have the data in excel file (I don't want to run de R script even it is on the web) and do you know if there is a database of spatial temperature anomaly. I think there is some residual signal that could be removed from the data and I would like to check what it might be.
    0 0
    Response:

    [dana1981] I have the data provided by tamino, which includes the raw and adjusted data.  Some of it was in the Excel file he provided, and some was in a .dat file.  I didn't run his R programs.

  4. A few observations of interest, looking at the animated graph: 1) Tropospheric temps (RSS and UAH) seem much more susceptible to ENSO events. The smoothing brings them much more closely in line with the surface observations in terms of variability. 2) Even after adjustment, the tropospheric temps still seem to be more susceptible to "dips" (particularly UAH). 3) MEI is clearly not a perfect indicator of ENSO events, as the timing of those peaks and valleys is still somewhat visible in the final graph. I wonder whether another measure of another ENSO-related variable would smooth things further. I'm not asking you to do the work (Dana), but now that I look at it and try to appraise it... it would have been nice to see the graphs from figure 2 and figure 3 separated and stacked (much like figure 2), but with the x-axis lined up, to let one visually see the factor, before and after graphically.
    0 0
  5. Somebody left a comment which was deleted due to a violation of the Comments Policy - it was just a link to a post on this paper by Frank Lasner on WUWT, suggesting that people should read his post for the sake of 'balance.' I don't agree - Lasner's analysis was extremely poor. For example, he tried to remove the factors one at a time rather than simultaneously (as Foster and Rahmstorf did) with multiple linear regression. This is a statistically poor approach. And in the end his results were effectively the same as F&R. Most of his criticisms of the paper were not valid. Another was the F&R use of TSI rather than sunspot number, but F&R clearly stated that they also did the analysis with sunspot number (and SOI rather than MEI, and a different measure of volcanic activity) and it didn't change their results significantly. As I said, it's a very poor analysis, and shouldn't be read just for the sake of "balance."
    0 0
  6. dana1981: In plain Englsih, what are the take-away points of your post?
    0 0
    Response:

    [dana1981] The main point is the last sentence of the post - the warming trend has remained very steady when these short-term factors are filtered out. I've added a concluding statement from F&R to clarify this point.

  7. dana1981 - I would have to agree. I've read through that WUWT thread, and the singleton removals are numerically invalid for a multiple contribution case like this. You really need to perform a multiple simultaneous regression, or you overemphasize the contributions of the factor(s) you identify first. Interestingly enough, Bob Tisdale (a person whose work is sometimes criticized on Tamino's blog) has been posting on that WUWT thread objecting to Lansner's analysis on much the same grounds. It's good to see that at least a few of the people considered 'AGW skeptics' are willing to critique the opinions of others with that worldview.
    0 0
  8. John Hartz - Takeaways? My personal opinion here, but I see the takeaways as: * Major portions of mid-term climate variability can be attributed to (with statistical significance) various exogenous (outside) factors. * Accounting for those exogenous factors shows a very clear linear warming trend over the last 32+ years, with all temperature records in agreement. * Not incidentally, accounting for the exogenous factors shows a warming trend demonstrating statistical significance of warming over periods as short as 11 years, since 2000! * Related skeptic memes that this is evidence against: It hasn't warmed since 1998, Climate is chaotic, "It's internal variability", It's a natural cycle, etc.
    0 0
    Moderator Response: [DB] Fixed text per request.
  9. Sphaerica, This is a statistical approach to removing the effects of exgenous variables. As such it is rather "stiff" in how it implements lags. In reality, dynamical considerations could shift the effective lag in any one instance of ENSO forward or backward from the mean lag. As a consequence, I think one can only hope to remove some of the natural variation using these methods. Only a proper dynamical model would truly be able to account for ENSO effects and the such. However, what Foster and Rahmstorf sacrifice in statistical efficiency is more than made up for by the clarity such an approach affords. Clearly warming has proceeded pretty much apace once much of those effects have been removed from the data. The average lags make sense based on modeling as well, I believe. That's a nice consistent picture.
    0 0
  10. Joe Romm over at Climate Progress also posted an article about the Foster and Rahmstorf paper. Romm's Dec 13 post includes a reprint of the Tomino article cited by Dana. The title of Romm's post is: Sorry, Deniers, Study of “True Global Warming Signal” Finds “Remarkably Steady” Rate of Manmade Warming Since 1979. To access it, click here.
    0 0
  11. KR @7 - in general I don't find Bob Tisdale's analyses very good either, but I do give him credit for criticizing poor posts on WUWT like this one quite frequently. He's one of the few 'skeptics' willing to point out the errors made by his fellow 'skeptics'.
    0 0
  12. The take home message from this paper is that cherry picking even a ten year interval to show 'cooling' has completely gone. The other often mentioned 'it is impossible to describe a chaotic system' now rings very hollow as well. The image of the situation has now come into very clear focus. Any further denial would only be due to blindness or ignorance maybe both. Bert
    0 0
  13. The 3 points I don't clearly understand in FR 2011 paper is : • ENSO signal (from MEI) notably consist in SST change. But SST are forced by GHGs as we know (and of course by all other forcings). So, part of the ENSO noise they removed also contains part of the signal they want to identify. I don't see ENSO as an "exogeneous factor" (legend 3, figure above), because GHGs and feedbacks do influence temperature and circulation of oceans. • On a 32 years period, they remove the sole ENSO noise but there are other "natural" modes of variability on such a period. (But the problem is the same : as ENSO, PDO, AMO and others "O" are also forced, no more just "natural", so it is unclear for me how we can distinguish signal and noise when dealing with these "natural-and-forced" oscillations.) • Climate is never on equilibrium, and response time is long for ocean. So we don't know what part of the 1979-2011 trend results from response to previous forcing, and this point doesn't seem adressed in the paper. By the way, it is a physical rathe than statistical point, so maybe FR just leaved it. I think FR get the broad picture with their choices, but I don't know if the decadal trends they obtain from their removals are very precise. Maybe lower, maybe higher.
    0 0
  14. skept.fr my understanding is that the Global Temperature Anomaly looks 'noisy' because it has other real variabilities superimposed on it. This is NOT noise but real signals that can be evaluated and accounted for. This paper by Foster and Rahmstorf has done just this and they have even adjusted for time dependant effects albeit approximately. All this was done using real physics not number fudging! The remaining real noise is within measurement errors. Your third point about equilibrium is quite valid as the majority of the heat is going into the oceans and thus the situation is far more dire than the GTA suggests. We are all falling off a very high cliff and we are arguing whether we have reached terminal velocity yet. Bert
    0 0
  15. Skept.fr The MEI uses 6 variables, only two of which are temperature variables and one of which is SST. There is no apparent long term trend in this index with time. So the index acts as if it were an exogenous factor, with respect to GHG warming signal at least. As for AMO and PDO, the efefct of such long period cycles should have become more apparent in the residuals after removing the effects of short period cycles and sporadic eruptions. That didn't happen, which suggests there is no cyclical variability on decadal time scales to be explained.
    0 0
  16. #14 Bert : yes, most (80-90%) of the warming trend is stored in ocean as heat content, so the LT or surface 1979-2011 trends are just a "small picture" of the real effect of forcings on Earth energy balance. For the "signal-noise", I've used the terms of FR : "the global warming signal becomes even more evident as noise is reduced" (noise being here ENSO, volcanoes and sun). #15 Stephen Baines : "There is no apparent long term trend in this index with time. So the index acts as if it were an exogenous factor, with respect to GHG warming signal at least" I agree, to be precise there is a small and negative (but poorly significant) trend for MEI, see table 3 : -0.014-0.023 K/dec. Whatever this trend, it is the "physical logic" that I try to understand, if I can say : the difference we can do theoretically between a noise and a signal in a forced climate. For AMO and PDO, I have not understood your point. As FR have not treated at all these oscillations (or others), we don't know from their paper what is their signature on 1979-2011.
    0 0
  17. I am not aware of any solid evidence that ENSO, PDO or AMO are forced at all. One of the conundrums awaiting better models is what effect GW will have (if any) on ENSO (and thus on regional weather patterns).
    0 0
  18. #13 skept.fr, I'm not sure I agree with you on your point #1. ENSO is the variability, not the rising trend, and so removing the ENSO signal will not remove any of the increasing trend in global temperatures. It would only do so if ENSO showed a trend over the same period. GHG forcing might affect the pattern and strength of ENSO, but that would show up in the ENSO signal oscillations, which are then removed. For your #2, AFAIK, AMO and PDO are not large enough to have a significant effect on global temperatures. For example, when PDO is in a 'cool' phase, a significant part of the North Pacific is in a 'warm' phase as part of the oscillation - the net effect on global temperatures is thus very muted. The PDO is also likely the integrated product of ENSO variations, and so is not a forcing in its own right. The AMO's definition has a linear global warming signal removed from it too. But this discussion (if there is one) is probably best on another thread.
    0 0
  19. John Hartz @1 Frankly, of all of acronyms on the figures above, the only one I clearly understand is ENSO (I didn't enven know ENSO could still be double-abreviated to MEI when talking about its measure!) rest of them are pure magic. But I can deduce their meaning from the context, i.e.: TSI must be the sun output variability (? Sun Index) and AOD must be the volcano eruptions. Even without those guesses, the term 'exogenous factors' makes the things understandable. Overall, Dana's article and the statistical analysis in the paper are well understandable, even by untrained people like me. I have a suggestion about those acronyms: make a list of them, for example in Newbie's section, in alpha order. Could be explained, if required, in one sentence each. Or even if not explained, it's nice to have them here at SkS, rather than looking up at wikipedia, discriminate them from incidental idents, etc. Has anyone got such list? If not, I can start sth up: AGW - Anthropogenic (man-made) Global Warming OA - Ocean Acidity ENSO- El Niño Southern Oscillation GHG - Greanhouse Gases SST - Sea Surface Temperature
    0 0
    Moderator Response: [DB] A list of acronyms is in the works already. But thanks anyway for the suggestion!
  20. Chriskoz @19: AOD is aerosol optical depth, and is a measure of the reflectivity of the atmosphere due to sulfate aerosols including those emitted by volcanoes. TSI is the Total Solar Irradiance, and is a measure of the total power received from the sun across the full range of the electromagnetic spectrum falling on a one meter squared area in orbit and held at right angles to the incoming sunlight. ENSO is the El Nino Southern Oscillation and is the actual physical phenomenon observed in the equatorial Pacific ocean. MEI is the Multivariate ENSO Index, and is one of many measures of the strength of the El Nino Southern Oscillation.
    0 0
  21. @chriskoz: Tamino did an excellent job of defining the scientific terms and acronyms in his analysis of the same paper. I believe his approach was superior's to Dana's in this particular regard.
    0 0
  22. John Hartz @21, the section in which Foster and Rahmstorf defines terms reads as follows:
    "Our analysis includes the five best-known global and hemispheric temperature time series. All data sets are combined land/ocean temperature estimates. For surface temperature, we use GISS: the land + ocean temperature data from NASA’s Goddard Institute for Space Studies (Hansen et al 2010 and references therein), NCDC: the Smith and Reynolds data set from NOAA’s National Climate Data Center (Smith and Reynolds 2005, Smith et al 2008), and CRU: the variance-adjusted HadCRUT3v data sets from the Hadley Centre/Climate Research Unit in the UK (Brohan et al 2006, Jones et al 2006). For LT temperature, we use RSS: data from Remote Sensing Systems (Mears and Wentz 2008), lower-troposphere data version 3.3, and UAH: that from the University of Alabama at Huntsville (Christy et al 2000), lower-troposphere data version 5.3. We characterize the ENSO by the multivariate el Nino˜ index, or MEI (Wolter and Timlin 1993, 1998). For volcanic influence we use the aerosol optical thickness data from Sato et al (1993), or AOD. To characterize the solar influence on temperature we use the total solar irradiance (TSI) data from Fröhlich (2006). To test whether the results might be sensitive to these choices, we also did experiments characterizing el Nino by the southern oscillation index (SOI) rather than MEI, characterizing volcanic aerosols by the volcanic forcing estimate of Ammann et al (2003) rather than the AOD data from Sato et al, and using monthly sunspot numbers as a proxy for solar activity rather than TSI. None of these substitutions affected the results in a significant way, establishing that this analysis is robust to the choice of data to represent exogenous factors."
    (Links to convenient access points for the data substituted for footnotes. Not all links are identical to those in the footnotes from F&R 2011.) They do not mention or define the PMOD TSI index, although Frölich 2006 does indeed detail the PMOD TSI index. PMOD stands for the Physikalisch-Meteorologisches Observatorium Davos, and my writing that represents the first time I have seen it referred to as anything other than PMOD except on its own website. That raises the point that the only acronym's Dana left undefined where acronyms for institutitions (used as short hand for their related indices). In all cases the use of the acronym is far more common than the use of the full name, so confusion is unlikely to arise. Therefore, I think your criticism of Dana on this point is excessive.
    0 0
  23. @Tom Curtis: I stand by my assertion that Tomino's analysis is more understandable to the average person than is Dana's because of the way Tamoino weaves in very straightforward descriptions of terms and acronyms.
    0 0
    Response: [dana1981] Your opinion is noted. Can we talk about some science now?
  24. #17 scaddenp # 19 skywatcher On his blog , Tamino have explained for example that the AMO signal is nothing but the AGW signal (so there is a trend) as North Atlantic temperature trend results of forcing : "Therefore global warming is the cause, not the effect, of much of the variation in the AMO". But why this would be true for AMO and not for all the other "O" including ENSO? Forcings and feedbacks act permanently on lapse rate, clouds, surface and vertical temperature profiles, wave propagation, etc. so I see no physical reason to suggest the frequency / intensity of oscillations will not be affected. Even a negative trend on a particular basin could be interpreted as a local and temporary effect of negative feedbacks – at least ‘theoretically’, this is what an AOGCM model is needed to analyse the possibility and probability of such event. You're right, models have no convergence on ENSO as recall Vecchi et Wittenberg 2010 for example : "the extent and character of the response of ENSO to increased in greenhouse gases are still a topic of considerable research, and given the results published to date, we cannot yet rule out possibilities of an increase, decrease, or no change in ENSO activity arising from increases in CO2. Yet we are fairly confident that ENSO variations will continue to occur and influence global climate in the coming decades and centuries.". Also of interest for readers Pierrehumbert and Benestad's point on Real Climate . For PDO, I've no particular information. Anyway, PDO, ENSO and AMO are probably not the only modes of variability (I’m pretty ignorant about the details of what climate scientists consider as ‘real’ quasi-periodic oscillations and their teleconnection in AO circulation). For example, Swanson and Tsonis 2009 have analysed what they called "shifts" in multidecadal variability (see Swanson’s op-ed on Real Climate) and M. Latif have some similar conclusions with GEOMAR model's team (see this page for GEOMAR publications, with many articles on this variability either natural or forced, particularly the Atlantic basin). That's why, for a period like 1979-2011 rather than a long term analysis 1900-2100 for example, I see the very precise distinction between noise and signal as a difficult exercise. There are many other convergent lines of evidence to consider the ~0,15 K /dec signal as the very likely result of GHGs forcing, but to say for example this GHG decadal signal is really 0,15 K rather than 0,11 K or 0,19 K seems to me very difficult, the removal of MEI-TSI-AOD noise being just a broad approach for that. And even without statistical work on signal and noise, we know that the stability of Ts trend in the 2000s is not a problem for AOGCMs, as they can obtain in their runs 17 years without trend (Santer el al 2011).
    0 0
  25. PS : "LT T trend" better than "Ts trend" for Santer et al 2011. (For the acronyms, LT = lower troposphere, Ts for surface temperature).
    0 0
  26. For the record: I have great admiration and respect for Dana's analytic and communication skills. My apologies to him and to all for going overboard in making a point about the need to define scientific acronyms and terms.
    0 0
  27. skept.fr @24, as you correctly not Tamino (Foster) discusses the Atlantic Multidecadal Oscillation (AMO) on his blog. He has shown that the AMO is just detrended North Atlantic Sea Surface Temperature (SST) Anomaly, and that there is little evidence of anything more (your link). However, he has also shown that there is no statistically significant evidence of quasiperiodicity in the variations in North Atlantic SST of over the last 6000 years. He has also shown that the AMO lags temperatures land temperatures, rather than leads them, arguing against a causal role for the AMO. In his words:
    "Now the peak correlation is at lag -2 months (again temperature leads AMO) and the difference from the lag 0 correlation is larger. I think this suggests two things. First, ... Second, the argument against causality from AMO to temperature is stronger. It’s still very weak — but based only on the time series, the argument for causality is even weaker."
    In fact, rather than causality, I would suggest the lag is simply a consequence of the quicker response time of land surface temperatures relative to SST for a given forcing. With regard to the Pacific Decadal Oscillation (PDO), when Tamino first performed this analysis for his blog, the PDO was brought up in comments, so Tamino regressed against the PDO as well. The PDO did not show any significant effect. I believe only the AMO and PDO have been suggested as causes of a (purportedly) spurious anthropogenic warming signal by deniers. As a side note, AO is often used to refer to the Artic Oscillation, so its use to refer to Atmosphere/Ocean circulations while discussing various oceanic "oscillations" can be confusing.
    0 0
  28. Arkadiusz Semczyszak, even in Polish, 1979-2010 does not equal 1901-2000. Therefore Viereck's claim is entirely consistent with Foster and Rahmstorf's result. Assuming they are consistent, we would expect (relatively) large increases in TSI prior to 1980, with a (relatively) small decline after 1980. And that indeed is what we see:
    0 0
  29. #27 Tom You’re right for AO ! (Decidedly, acronyms are perturbing for readers.) For AMO, I slightly disagree with your interpretation of Tamino-Foster point concerning the long term (8000 yrs for Knudsen et al. 2011) trend. In fact, as your link shows, Tamino concludes: «I will emphasize that the results are less “significant” than they may appear at first sight, so they should be treated as more tentative than definitive.» But this does not mean that there is «no statistically significant evidence of quasiperiodicity» (your point). So, the basic result of Knudsen (distinct ~55- to 70-year oscillations characterized the North Atlantic ocean-atmosphere variability over the past 8,000 years) is not contested, its statistical robustness is rather relativized by Tamino analysis. This 55-70 yrs AMO periodicity, if it really exists and is not a statistical artifact (to be confirmed, so), would imply the signal-noise analysis of 1979-2011 (32 yrs) period have to deal with it. The other Tamino-Foster article you linked (T leads AMO whereas ENSO leads T) probably explains the choice to include ENSO and ignore AMO in FR2011. But as the graph shows, peak correlation for the 2 months lag is just 0.4 and the distribution of time series suggest sometimes T lags AMO. Maybe this ‘sometimes’ is part of natural periodicity discussed in the previous point?
    0 0
  30. skept.fr @29, with respect, Tamino's purpose in 8000 years of AMO blog post was specifically to dispute the statistical significance of the results. He writes:
    "Although their results are both correct, and computed according to standard practices, an extreme caveat applies. A result which is reported as passing 99% significance, does not mean that it’s actually a 99% confidence periodic result! It would be, if and only if the test were applied only to a single, precisely determined, pre-defined test period. But the spectral analysis tests a wide range of periods (i.e., of frequencies), covering at least the plotted frequency range from 0.01 to 0.02 cycle/yr (periods from 50 to 100 yr). This means that there are lots more chances to get an apparently “significant” result — just by chance."
    (Original emphasis) Later he analyses one "apparently significant result", and finds:
    "But what are the odds of finding a peak that strong when we scan the frequency range from 0.01 to 0.02 cycle/yr? I generated 500 white-noise data series with the same time sampling as the Agassiz d18O data from 6000 to 8000 yr BP. Then I computed the strength of the strongest peak in the DCDFT spectrum over the frequency range from 0.01 to 0.02 cycle/yr. This sample of 500 simulated noise spectra enabled me to define the probability distribution for the strongest peak in this case, and therefore to define the true significance level for the result from the Agassiz ice cap. It turns out that the peak which passes 99% confidence for a single-frequency test, is only significant at 93% confidence when taken in the context of having scanned a range of frequencies."
    By convention, of course, results are only considered statistically significant if they are significant at 95% confidence level, so the Agassiz ice cap data for a 68 year period between 6 and 8 thousand years ago is tantalizingly close, but it is not statistically significant. Tamino continued:
    "I did similar tests (defining the probability distribution for the tallest peak by Monte-Carlo simulations) for the entire time span of the GISP2 d18O data. It turns out that all the plotted results fail to pass 90% significance except for a brief outburst of the 63-yr band between 6500 and 7000 yr BP."
    In the face of this specific technical discussion, I think taking once rhetorical turn of phrase as defining Tamino's opinion is not warranted.
    0 0
  31. #30 Tom Curtis : OK, that's not rhetoric, I'm not specialist at all of statistics, so I neglected the nuance between 93% / 95% confidence. You're right. But from the exchanges between Tamino and the authors, I understood they agree that the method used by Knudsen is a kind of standard in the literature, even if too imprecise. Dr Knudsen : "We are not completely happy about this way of describing significance. It may easily create a feeling by the average reader that significances are higher than they really are. But we have adhered to this standard used in other literature on the subject." Tamino answer : "Honestly, I agree that their approach is perfectly valid, and that it is in accord with the way this kind of analysis is treated in the literature. I’ll also agree that it is easy for these results to be misinterpreted." So, for a layman (again, I'm dull in that matter), the point is totally unclear, if Knudsen et al did what is usually done in paleoclimate or oscillation studies, does it mean that Tamino critics would lessen significance of most results in theses fields? Anyway and beside Knudsen 2011, there are currently many discussions on AMO periodicity (or reality) on different timescales, for example Vincze 2001 , Marullo 2011 , Wyatt 2010, etc. (A lot of hits in Google Scholar, just give here some recent results about these discussion, I think the first one from Vincze is a pdf of interest for persons with a good knowledge of statistics.) So, for my initial point, unless there is a clear proof that AMO signal is an artifact, or 100% produced by AGW, or without any effect on a 32 years period of T, I suggest the opportunity of removing or not removing this signal could be a matter of debate among climate community. Would you agree with this cautious conclusion or do you think I still miss a point that justifies with certainty or near certainty the ignorance of AMO as a partial noise (like ENSO but not with the same magnitude and not the same statistics of lag/lead response to T)?
    0 0
  32. skept.fr Certain statistical conventions in scientific publication aren't necessarily the best means of determining the 'weight' of evidence. Foster illustrates that when this particular event (which appears to pass the 99% 'significance' level) is given more context, it doesn't seem quite as compelling (roughly 7 times less compelling). The difference between 95% and 93% should not simply be the difference between yes and no. Unfortunately a lot of university courses teach just that.
    0 0
  33. skept.fr My point @9 is that, were the AMO index influencing global temperature, the evidence for such an effect should have become clearer after Foster and Rahmstorf statistically removed the influence of other factors from the times series. All of those other factors have very distinct temporal signatures from the AMO index and could have obscured the influence of the AMO. However, there is no apparent trace of the AMO in the temperature data once those factors have been accounted for. The AMO index shifted sharply from a cold to warm phase starting in the 90s (see the Knudsen 2011 paper). By contrast, F&Rs corrected temperature series during the 90s shows a steady linear increase. There is not even a hint of a change in rate of warming during and after the 90s, as would be expected were the AMO important. On a more abstract statistical level, it's a little problematic trying to fit a cycle with a period twice as long as temperature record being used. It's also hard to know how to correct the AMO for the influence of AGW without seeming a little arbitrary. From what I can tell that's because we don't understand it well - it's not even clear to me that there is a consensus that it is actually a regular feature of the ocean-climate system. On a more general level...I understand the mechanism for how ENSO affects global balance of heat distribution between the atmosphere and the ocean - through its effect on intensity and distribution of deep water upwelling. But, what is the mechanism proposed for any influence of the AMO on global atmopsheric temperatures? Is there one? As far as can tell it's just an SST index. Is it supposed to be related to the intensity of meriodional overturning circulation, or some other process that could affect storage of heat in the ocean?
    0 0
  34. BTW...much of my reasoning for discounting the effect of the AMO can also be applied to the PDO, which has exhibited several distinct shifts since '79 - including a late 90s shift to an extended negative phase. None of those shifts are apparent in the corrected temperature data in F&R. And again, the exact mechanism by which the PDO would affect global temperatures is not clear to me. Again, maybe others can help me there.
    0 0
  35. #34 Stephen Here is a AMO index (c) which is calculated as a substraction of (a) global STT anomaly from (b) NA SST anomaly, image from the Knudsen 2011 paper. So, concerning the anomaly we're debating, AMO is supposed to exhibit a warming trend from beginning of the 1990s to the present period, with no particular trend for 1979-1990. I don't understand why this signal, relative to one basin and not all the hemisphere nor the globe, would be immediately identifiable in the detrended global signal from FR2011. I think it is your point (if I correctly understand) but in fact, we've just here a local warming trend (AMO or North Atlantic STT) in a global warming trend (global T). If this trend is partly natural ("noise" in the FR2011 sense), to remove its natural part permits to gain the correct forced signal. A natural (unforced) part of AMO would probably be a low value in the global mean. My point is not to say a huge part of warming come from AMO (non sensical), or any other oscillation in particular, but to understand the rationale for detrending natural variability in three decades series (that is to assess what is natural variability and what is forced variability, even if a particular oscillation just produces 0,01K/dec, for example). As I said in #13, I think FR get the broad picture correctly with their choices, but details are still amazing for me (either the ENSO independency from forcings or the other "Os" except ENSO).
    0 0
  36. #34 Stephen - Sorry, I miss your second point : "On a more abstract statistical level, it's a little problematic trying to fit a cycle with a period twice as long as temperature record being used. It's also hard to know how to correct the AMO for the influence of AGW without seeming a little arbitrary. " I think this point partly answers my question: a purely statistical approach has no tool for a physical detection-attribution (contrary to climate models, like Huber et Knutti 2011), so its prior assumptions for detrending must rely on robust features in literature. ENSO is considered as the principal mode of high frequency variability for surface / LT trends (for the moment with a null hypothesis concerning an effect of GHG forcing), whereas AMO is still under discussion.
    0 0
  37. 36, skept.fr, You also neglect the fact that much of the mechanics of ENSO are understood. We know, physically, what happens to cause the warming and cooling. We don't yet know what controls the transition between states so we can't predict when any state will appear or how strong it will be, but we do understand how and why it affects temperatures, and this allows us to understand that it could not possibly have a long term effect on global mean temperature. AMO, on the other hand, is a black box. We're not even sure that it really is periodic or even exists at all. It may be a mere artifact of coincidence with actual, distinct forcings that in the past 100 years first temperatures down, then up (increase in TSI), then down (increase in human aerosols overpowering GHGs) and then up again (less aerosols, more GHGs) in a seeming cycle that does not actually exist. We have logical evidence to accompany changes in global temperature, and the AMO then mirrors those changes in global temperature. Why would one then go looking at the AMO as a cause rather than an effect? This has nothing to do with statistics. It has to do with misinterpreting the correlation and so putting the cart before the horse.
    0 0
  38. 36, skept.fr, To put it another way, you find a bullet embedded in the wall. You trace the angle of entry, look across the room, and see a smoking gun lying on a table. You now conclude that the bullet must have thrown the gun across the room onto the table. The correlation between the two is obvious. The expectation of cause and effect is absurd.
    0 0
  39. #37 Sphaerica : AMO, on the other hand, is a black box. We're not even sure that it really is periodic or even exists at all. It may be a mere artifact of coincidence with actual, distinct forcings that in the past 100 years first temperatures down, then up (increase in TSI), then down (increase in human aerosols overpowering GHGs) and then up again (less aerosols, more GHGs) in a seeming cycle that does not actually exist. We have logical evidence to accompany changes in global temperature, and the AMO then mirrors those changes in global temperature. I suggest you're a bit "extreme" in your presentation of AMO. IPCC AR4 3.6.6 (2007) has presented the AMO among other "patterns of atmospheric circulation variability", including the Southern Oscillation, and what I read here from climate scientists is not exactly what you say. I mean, there are 17 years of publication on AMO since the first description in Schlesinger and Ramankutty, 1994, so it not just "a black box". Furthermore, if your prefer to speak about other patterns, why not : my question would be valuable for the better defined NAO or NAM, for example. I've no fixed idea on AMO. My point is a question of logical coherence rather than empirical evidence on such or such oscillation. If you think that oscillations (or patterns of variability or teleconnections) do not change surface temperature on long term, beyond interannual variability, you have no particular reason to include any oscillation in a 32 yrs analysis. It will oscillates around the zero mean on such a long period, by definition. This is quite independent of our exact level of understanding about ENSO, AMO, NAO, and so on. But if you include one oscillation, you must at least explain the statistical / physical reasons for excluding all the others. Why would one then go looking at the AMO as a cause rather than an effect? In fact some scientists do. So you should ask to them, not to me! For example in J Clim, Ting 2010 : "Comparing the results to observations, it is argued that the long-term, observed, North Atlantic basin-averaged SSTs combine a forced global warming trend with a distinct, local multidecadal “oscillation” that is outside of the range of the model-simulated, forced component and most likely arose from internal variability. This internal variability produced a cold interval between 1900 and 1930, followed by 30 yr of relative warmth and another cold phase from 1960 to 1990, and a warming since then." (My emphasis on produce) Also in J Clim, DelSole 2011 : "An unforced internal component that varies on multidecadal time scales is identified by a new statistical method that maximizes integral time scale. This component, called the internal multidecadal pattern (IMP), is stochastic and hence does not contribute to trends on long time scales; however, it can contribute significantly to short-term trends. Observational estimates indicate that the trend in the spatially averaged “well observed” sea surface temperature (SST) due to the forced component has an approximately constant value of 0.1 K decade−1, while the IMP can contribute about ±0.08 K decade−1 for a 30-yr trend. The warming and cooling of the IMP matches that of the Atlantic multidecadal oscillation and is of sufficient amplitude to explain the acceleration in warming during 1977–2008 as compared to 1946–77, despite the forced component increasing at the same rate during these two periods."(my emphasis) I've no idea of the value of these studies, but they suggest internal variability (and particularly AMO here) can be something like the cause of some mutlidecadal warming / cooling. That's why I speak previously of a debate among climate community on the origin, cause and effect of these oscillations, and particularly on relatively short period like 1979-2011. See also Latif and Keenlyside 2011 for a recent review on decadal climate variability and predictability.
    0 0
  40. skept.fr#24: "I see the very precise distinction between noise and signal as a difficult exercise." I am sure tamino would agree. Why don't you ask? "There are many other convergent lines of evidence to consider the ~0,15 K /dec signal as the very likely result of GHGs forcing," Yes indeed; a most important observation. "but to say for example this GHG decadal signal is really 0,15 K rather than 0,11 K or 0,19 K seems to me very difficult," Foster and Rahmstorf do not make any claim of such exacting precision. Examine Table 1 in this post: decadal rates (adjusted) range from 0.141 to 0.175; uncertainties are given. That range alone provides an arithmetic mean of 0.158 +/-0.017. #31: "there are currently many discussions on AMO periodicity (or reality) on different timescales" It is probably just my interpretation, but in some of your comments, you seem to be seeing things that aren't there and assuming these chimera must have some unexplored significance. Hence the suggestion that it could be AMO - on the basis that there are several current papers about it. As we have seen in other cases, the mere number of papers is not a good indicator of their relevance.
    0 0
  41. #40 muoncounter : It is probably just my interpretation, but in some of your comments, you seem to be seeing things that aren't there and assuming these chimera must have some unexplored significance. Hence the suggestion that it could be AMO - on the basis that there are several current papers about it. Whatever your interpretation, it should be more precise. I wrote "My point is not to say a huge part of warming come from AMO (non sensical)", so what do you mean for your part by "it could be AMO" when you interpret my point? What could be AMO exactly? When you speak of "chimera", what do you refer to, the articles I linked or my bad understanding of the conclusions of these articles? The former as the latter may be well true, but I guess one or other merits to be explained.
    0 0
  42. Perhaps I see your point skept.fr: since one oscillation was included, why not others? I think the bottom line is that ENSO is universally accepted as a defined entity which produces marked short term global temperature noise, whereas the definitions for and likely magnitudes of effect of the other possible oscillations are in much (to put it mildly) debate. Is the lack of evidence for significant oscillation in the thirty years of this study evidence for a lack of global effect of the other oscillations(at least as currently defined)? My guess is yes, but I can't say I know enough to be certain...
    0 0
  43. Tristran @32, while I agree that the 95% confidence level is somewhat arbitrary, and would much prefer the use of Bayesian approaches to statistics, never-the-less the difference between a 95% and a 93% confidence level is not small. The 95% confidence level can be glossed as saying there is a 1 in 20 chance the result would be produced "by chance". The 93% confidence level, in contrast, equates to a 1 in 14.3 chance, a 40% increase of a chance result. Consequently the conventional standard of 95% for statistical significance is a convention, but not entirely arbitrary. That said, the Knudsen paper is tantalizing in its result. Just not statistically significant.
    0 0
  44. skept.fr#41. A precise interpretation? I prefer precise information: -- The earliest mention of 'AMO' in this page is your #13, where it is one among a number of possible oscillations you suggest need consideration. -- Stephen Baines offered a reasonable suggestion as to why Foster and Rahmstorf did not show AMO as a factor, but that is brushed aside here. -- There is then some back and forth, culminating in Tom Curtis' characteristically precise explanation of tamino's earlier work in this context. -- And so on (and that is not meant to diss any of the other excellent contributions to this thread; space is limited). My point was that there is no strong evidence for treating AMO as a factor here (as opposed to ENSO, which has had readily observable effects on global temperature). The observation that "there are currently many discussions on AMO" is hardly compelling. FYI, we have AMO threads which could be informative to consult. Please forgive my use of 'chimera' as my personal opinion of the importance of AMO; that was a needless and irrelevant confusion. Let's put it very simply: Why not post the AMO question directly to tamino's discussion of F&R 2011? He is remarkably clear in his responses to such questions and would no doubt provide more insight than I ever could.
    0 0
  45. skept.fr, what we are finding puzzling about your concentration on the AMO is, as has been pointed out, it is just one of many posited oceanic quasi-periodic fluctuations. Among other posited (and in most cases well established) periodic variations are: The Indian Ocean Dipole (IOD); The Benguela Nino; (Both of which are analogues of ENSO in their respective oceans.) The AMO; The PDO; The Arctic Oscillation; The North Pacific Gyre Oscillation (which is part of the North Pacific Oscillation, an atmosphere/ocean oscillation) There is also a significant oscillation measured by the pressure difference between Hobart and Chatham Island whose name I forget, and no doubt many others. All of these "oscillations" have significant regional effects. The IOD effects climate not just in India and North Africa (as you would expect) but also in South Eastern Australia. However, only one such "oscillation" has a proven effect on global climate - ENSO. If others were to have a global influence, most logically it would be one (or both) of the two ENSO analogues. In the meantime, what can be said about the AMO is, if it is real, its long term effect could not be distinguished from the global warming trend in a study that only covers a half cycle period, and that its short term fluctuations do not correspond well with the residual of F&R's analysis, suggesting that its short term cycle, at least, has little bearing on global temperatures.
    0 0
  46. Tom It's not just somewhat arbitrary, it's entirely arbitrary. P-values, and more importantly, likelihood distributions give us information with which to make decisions. A p-value of 0.05 will result in some decision being made. A p-value of 0.07 will result in some decision being made. They might result in the same decision, they might not. Most decisions are more finely grained than simply 'do' or 'don't'. In the case of this study, the p-value is stacked against a pretty strong body of work that implies that the AMO isn't an actor in global temperatures. I think it'd take much more than p:0.05 to shed doubt on what we currently believe.
    0 0
  47. skept.fr When dealing with slightly turbulent flow it is useless to dwell on one of the vortices as a driver of the overall flow. It is a property of the flow rather than a cause. All the 'oscillations' are just this. You either do not really understand the physics or you are as is usual with the deniers of AGW, casting doubt on the basic premise by pointing out a meaningless anomaly that has no basis in reality. Or you are genuine and simply misguided. Which is it? Bert
    0 0
  48. #45 Tom : "what we are finding puzzling about your concentration on the AMO is, as has been pointed out, it is just one of many posited oceanic quasi-periodic fluctuations" Agree with that, but note that my concentration on AMO comes from the fact that Tamino has written on it on his blog, so I took this as an example of what I called in my very first message "the other Os". Following the advice of muoncounter, I posted a question on Tamino's blog, so I'll let you know. My question had no mention of AMO, here it is for information: I miss a point. In IPCC AR4 3.3.6 (2007), several patterns of variability are described, Southern Oscillation being one among others. On long term, these oscillations are centered on a zero mean value (they don’t create heat). But for a shorter term as 1979-2010, why should we consider the sole ENSO as a multidecadal “noise”? Or more precisely, on a 32 yrs period, from which physical arguments must we choose one oscillation in particular, rather than zero oscillation or all oscillations? Thanks. Tom : only one such "oscillation" has a proven effect on global climate - ENSO I think we disagree on this point, because I consider there is a debate in climate community. That's why I quoted Swanson, Tsonis or Latif as examples of scientists having recently published on multidecadal effects on internal (or unforced) variability. Real Climate had published a guest blog of Swanson (link above), so I suppose it is not a scoop. And in fact, IPCC AR4 3.6.8 2007 already said : Decadal variations in teleconnections considerably complicate the interpretation of climate change. Since the TAR, it has become clear that a small number of teleconnection patterns account for much of the seasonal to interannual variability in the extratropics. On monthly time scales, the SAM, NAM and NAO are dominant in the extratropics. The NAM and NAO are closely related, and are mostly independent from the SAM, except perhaps on decadal time scales. Many other patterns can be explained through combinations of the NAM and PNA in the NH, and the SAM and PSA in the SH, plus ENSO-related global patterns. Both the NAM/NAO and the SAM have exhibited trends towards their positive phase (strengthened mid-latitude westerlies) over the last three to four decades, although both have returned to near their long-term mean state in the last five years. In the NH, this trend has been associated with the observed winter change in storm tracks, precipitation and temperature patterns. In the SH, SAM changes are related to contrasting trends of strong warming in the Antarctic Peninsula and a cooling over most of interior Antarctica. The increasing positive phase of the SAM has been linked to stratospheric ozone depletion and to greenhouse gas increases. Multi-decadal variability is also evident in the Atlantic, and appears to be related to the THC. (My emphasis) So as you can see, the IPCC 2007 acknowledges that there have been decadal change in some pattern inside the 1979-2011 period, for NAM/NAO, SAM, Atlantic MOC, not only ENSO.The fact that ENSO have the strongest signature on T does not imply that coupling / decoupling of other patterns of variability during there decades have no signature at all on regional T and so mean global T. #47 Bert : "You either do not really understand the physics or you are as is usual with the deniers of AGW, casting doubt on the basic premise by pointing out a meaningless anomaly that has no basis in reality. Or you are genuine and simply misguided. Which is it?" You've a lot of hypothesis about me, I'd prefer a lot of hypothesis about my questions! That is I prefer ad rem to ad hominem. Of course, oscillations do not create heat, but just change its pattern of distribution between ocean and atmosphere. The point of the discussion is not to say that oscillations produce GW — nonsensical as I've already said (so please read me more attentively), they oscillate around a zero mean —, but to understand how FR 2011 can separate signal and noise. That is the core of their approach, and the core of my questions.
    0 0
  49. skept.fr @48:
    "Tom : only one such "oscillation" has a proven effect on global climate - ENSO I think we disagree on this point, because I consider there is a debate in climate community."
    You misunderstand me. There is debate about the effect of several of these oscillations on global temperatures, most particularly the AMO and the PDO. But for just one oscillation has the debate moved to the point where it is beyond reasonable dispute that that oscillation effects global temperatures, ie, for ENSO. For all other candidates, you will find evidence and scientists on both sides of the debate.
    0 0
  50. skept.fr The core of your question is now differentiating signal from noise?! I will say this very simply that the eddies in the flow of heat have been subtracted from the measured signal by FR 2011. These are real perturbations of the GTA caused by both the drivers and mediators apart from our CO2 pollution. The resultant signal is our contribution to the temperature increase of SpaceShip Earth You are complicating what is a simple scenario by pointing to red herrings. I reckon I have your measure. Bert
    0 0

1  2  Next

You need to be logged in to post a comment. Login via the left margin or if you're new, register here.


The Consensus Project Website

THE ESCALATOR

(free to republish)


© Copyright 2024 John Cook
Home | Translations | About Us | Privacy | Contact Us