


 Arguments


Human fingerprints on climate change rule out natural cycles
What the science says...
| Select a level... |
 Basic
Basic
|
 Intermediate
| |||
|
No known natural forcing fits the fingerprints of observed warming except anthropogenic greenhouse gases. |
|||||
Climate Myth...
It's a natural cycle
"Global warming (i.e, the warming since 1977) is over. The minute increase of anthropogenic CO2 in the atmosphere (0.008%) was not the cause of the warming—it was a continuation of natural cycles that occurred over the past 500 years." (Don Easterbrook)
At a glance
The passage of time reveals many things. Consider for a moment the myth in the box above. It is dated 2008 and says, "Global warming (i.e, the warming since 1977) is over." Fifteen years on from that date and we can say, with complete confidence, "utter rubbish" (or words to that effect).
In a temperature record stretching back into the late 19th Century, the ten hottest years have all occurred since 2010. The hottest by a large margin (at the time of writing - early 2024) was 2023, with 2016 in second place. In both cases manmade global warming augmented by El Nino nudged these years into pole position. The opposite to El Nino, La Nina, is a phenomenon that cools the planet. One of the top ten, 2022, was also the warmest La Nina year on record. Starting to see a pattern here?
There are many natural cycles out there that do affect the climate. Consider the Milankovitch orbital cycles that are strong enough to trigger the switches between glacials and interglacials. These cycles operate over tens of thousands of years so their year-to-year effects are barely discernible.Yet they can cause ice-sheets to wax and wane over vast areas of the planet, especially in the Northern Hemisphere where the vast majority of landmasses currently reside. At the other end of the spectrum is the El Nino Southern Oscillation (ENSO) that most folk have heard of because it causes newsworthy weather events. Climate scientists know all about these cycles and their effects. It's part of the job description.
Those of you who click on the myth's link will find a lot about a cycle known as the 'Pacific Decadal Oscillation' (PDO). That's not a regular cycle that turns up on time, as buses and trains ought to. But yes, it does influence climate as it has warm and cool phases, just like ENSO but in a different part of the Pacific Ocean and over longer periods. And yes, climate scientists monitor the PDO, just like everything else. The PDO is expressed as an Index: values above 0 are positive (warm) and those below 0 are negative (cool). And here's the rub. Since autumn 2019, the PDO Index has been negative, often strongly so. Yet the planet's temperature continues to rise unchecked.
The problem is that in climate more than one thing can happen at once. And since 1950, our CO2 emissions have surged ever-upwards and the climate is responding to that, too. In other words, human-caused global warming is now overdubbing the effects of such cycles. They used to count for a lot more than they do now.
The carbon cycle describes the way in which carbon moves around the planetary system comprising the atmosphere, the oceans, the biosphere and the solid Earth. The first and last components are where the problem lies. In burning fossil fuels, we have accessed carbon that by rights should have stayed in the solid Earth for untold millions of years. In doing so, that carbon has been dumped into the atmosphere. It represents a disturbance to the carbon cycle rarely seen in the geological record. And the planet is responding to that by heating up.
There's only one cycle we need to worry about and that's the carbon cycle.
Please use this form to provide feedback about this new "At a glance" section. Read a more technical version below or dig deeper via the tabs above!
Further details
Global warming refers to the long-term increase in global temperature since the 1850s. The only plausible mechanism for global warming is a planetary energy imbalance. In other words, our climate system is accumulating heat. Let's take a look.
Fossil fuel burning is causing recent global warming
Two factors drive any global climate change. One is internal variability and the other is external forcings. Internal variability refers to the processes moving heat around within the climate system. External forcings differ because they cause an energy imbalance, in which heat is either added to or removed from the climate system. They can have both natural and human causes. In the case of the current warming, scientists have long since concluded that the main cause is the increase of atmospheric CO2 due to fossil fuel burning. That's been known since the mid 1950s, following decades of investigations.
Internal variability moves heat around the climate system
Global warming has been likened to the motion of water in a kitchen sink. There's an inflow from the tap and an outflow through the drain. The motion has two components. Firstly, there's the water sloshing around. That's what scientists call 'internal variability'. Secondly, there's the increase or decrease in water volume, depending on the relative amounts of inflow and outflow. That's what scientists call 'external forcings'.
Internal variability includes important oceanic cycles. Examples are the El Niño Southern Oscillation (ENSO) or the Pacific Decadal Oscillation (PDO). These well-understood phenomena move heat around, causing regional climatic fluctuations. Such regional effects occur on timescales ranging from years to decades. But like the water sloshing around in the sink, internal variability doesn't add to or take away the total amount of heat in the climate system.
The single cause fallacy committed by the natural cycle myth
This myth, from Don Easterbrook, contended that recent global warming is caused by natural cycles rather than human activity. The fact that it was put forward in 2008 and ten of the warmest years on record have happened since 2010 rebuts Easterbrook's contention all on its own. Easterbrook fell foul of the 'single cause fallacy', by proposing there is only one driver of climate change (e.g. natural factors) when there may be others (e.g. human activity). In fact, there are always many things going on at once when it comes to climate.
Various variants of this myth are out there in the wild, unsurprisingly. Sometimes a particular cycle is picked but quite often it's just an arm-waving 'natural cycle', hoping the reader/listener/viewer doesn't ask for specifics. The best cycles of all, if you want to pretend to your layperson audience that climate change has nothing to do with us humans, are imaginary ones of medium to long duration. These have the great advantage that, for the denier, they will not repeat during their lifetime - most deniers are men who are past to well-past middle age. Ideally, therefore, they want such a cycle to repeat every 50-100 years, so if they are shown to be 100% wrong, natural processes will have ensured they are not around to face the music.
Easterbrook did focus on a specific cycle, the PDO. The Pacific Decadal Oscillation is an irregular cyclical variation in sea surface temperature anomalies over the North Pacific Ocean. It influences weather patterns, importantly including precipitation, across large parts of Asia and North America. That gives us grist to grind because, as with all known cycles, it has been studied in detail and is monitored. The data gathered mean we can index the state of the PDO and plot negative - or cool - phases and positive - or warm - ones against time, just as we do with temperature and other parameters (fig.1).
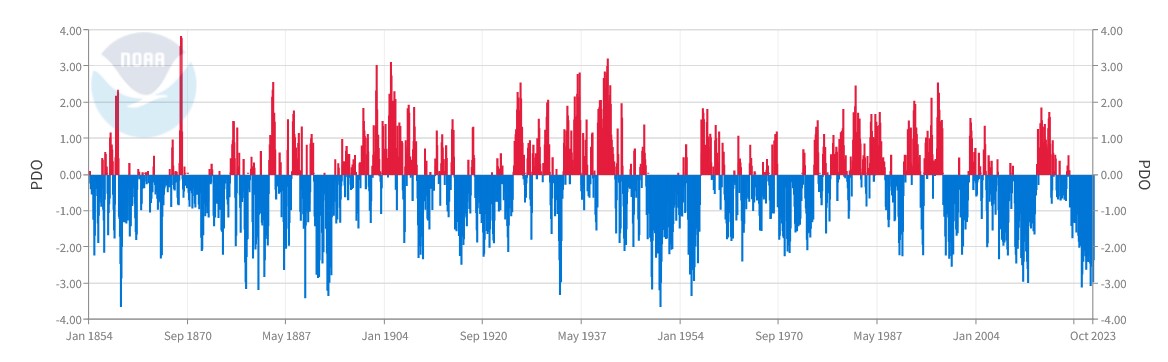
Fig. 1: the Pacific Decadal Oscillation Index from 1864 to October 2023. Even eyeballing this plot suggests the cool and warm phases more or less cancel one another out. Source: NOAA.
In another in-depth Skeptical Science piece purely about the PDO, ironically dating to around the time that Easterbrook made his claim, the truth was revealed when the trends of global temperature and the PDO Index were plotted on the same graph (fig. 2).
Figure 2: Pacific Decadal Oscillation index (blue - University of Washington) versus Global Temperature Anomaly (Red - GISS Temp). Smoothed data (thicker blue and red lines) and trend lines (thick straight line) are added.
Since then of course, global temperatures have continued to rise with 2023 having been the hottest year on record. Natural oscillations like the PDO don't have the ability to either create or retain heat. They simply move heat around from oceans to air and vice-versa. That means they are not capable of causing a long-term warming trend like the one we are witnessing. When you think about it, if the PDO (or some other internal cycle) was responsible for warming the surface, the oceans would be cooling, which is not the case.
Before the 19th Century, human influence on climate was a fraction of what it is now. Natural cycles were the dominant drivers of global temperature changes. But now, that record has been overwritten. The colossal quantities of carbon released from the solid Earth through fossil fuel burning have made certain of that. Natural cycles can still explain the noise along the upwards curve that is human-caused global warming. However, they utterly fail to explain the continuously upward trend itself. The cause of that is the 50% increase in CO2 in Earth's atmosphere and that's mostly down to us.
Last updated on 17 March 2024 by John Mason. View Archives


[DB] Upgraded image quality.
[DB] Try here.
Biliev said elsewhere:
As with the chart mentioned above, the chart below shows the GISS LOTI, but adds two sets of trend patterns. The first (trend pattern a) is that described by you above, while the second shows a continuous trend from 1910 to 1964, and a continous trend from 1965 to 2014. The inflexion point was chosen based on the location of the inflexion point in the radiative forcing record. That is, it was not chosen simply to get a best fit in the temperature record:
Despite that, it gives a very good fit. Ignoring the excursion in the early 1940s, they both have an r squared of 0.92, showing that on the basis of correlation there is no reason to preffer one over the other. Even including the early 40s, the cherry picked 5 trend pattern only improves squarred correlation from 0.9 to 0.92.
Against that, to gain that 0.02 lift in correlation, you need to add in 7 extra parameters. That is, you gain a minimally improved fit only by greatly increasing the ad hoc complexity of your model.
Actually, that understates it. That assumes you use an error function on th quarter wavelenght of your wave pattern (ie, the time between inflexion points). Doing so greatly decreases the likelihood of the function but means you only have on extra function. In fact, the inflection points are cherry picked to match known temperature inflexion points, not derived from a model. Ergo you require one parameter per inflexion point, or an additional three parameters.
All this means that any scientific test of the goodness of fit that also measures complexity (such as the Akaike Information Criterion) will pick the three trend pattern over the five trend pattern every time. They will also pick the pure forcing plus ENSO model (which gives an even better fit with no ad hoc parameters) over the three trend model as well, but that is beside the point.
What is important is that you only see the pattern you mention because, either, you have had it imprinted by excess familiarity from denier propaganda; or because you do not properly discount patterns for cherry picked elements. If you let the data speak for itself, and eschew cherry picking - it is obvious that there is a relatively constant rise in temperature from about 1910 to 1965, with a large aberration approximately coinciding with WW2.
Sorry, Tom. I still see a pause in warming from about the mid 1940's until the mid 1970's regardless of the addition of a yellow trend line from GISS. I assume that a chart of the type of the NOAA and GISS charts is designed to give the viewer information in an easy to understand format. That format shows me the break in warming I just mentioned.
billev @12, what you "still see" has little bearing on what the data shows. It is fairly plain that you are applying a double standard. Elsewhere, you said the GISS data "... also could be indicating another pause beginning about 2000 ...". If we look at that data using the Skeptical Science trend calculator we find the following trends:
1970- 0.174 +/- 0.029 C/decade
2000- 0.132 +/- 0.124 C/decade
If we take the difference, and add the uncertainties in quadrature, we find the difference in the trend, and the uncertainty of that difference:
Difference: 0.042 +/- 0.127 C/decade (0.66 σ)
As you can see, the difference in the trend is much smaller than uncertainty, meaning there is minimal evidence supporting your view that the data "could be indicating" another pause. However poor the evidence, however, it sets a benchmark of what you consider sufficient evidence to entertain that possibility.
In the same post, you also said the data "shows me a pause in temperature rise from ... from the mid 1940's until about the mid 1970's". Again, we find the trends and uncertainties for the relevant periods:
1910-1945 0.136 +/- 0.045 C/decade
1910-1970 0.06 +/- 0.022 C/decade
1945-1970 0.008 +/- 0.07 C/decade
Again, taking the difference and summing uncertainties in quadrature, we find:
Difference ('10-'45): 0.128 +/- 0.083 C/decade (3.08 σ)
Difference ('10-'70): 0.052 +/- 0.073 C/decade (0.84 σ)
The 3.08 standard deviation difference in trend is certainly sufficient to infer a change in trend, given that we accept those trends as being the underlying trends. That, however, is in dispute, and it is dubious that the 0.84 standard deviation difference between the 1910-1970 trend and the 1945-1970 trend is sufficient to infer a difference in trend. The important point here, however, is that you do infer a change in trend. Ergo, you consider that 0.84 standard deviation difference to be sufficient to infer that there is a change in trend. You certainly consider the 3.08 standard deviation differenc to be sufficient to make that inference.
Being fair, you may think that difference between the 1910-1945 and the 1910-1970 trends is sufficient to infer a different slope for the shorter period. So, again checking the trends, taking the difference and adding uncertainties in quadrature we get:
1910-1945 0.136 +/- 0.045 C/decade
1910-1970 0.06 +/- 0.022 C/decade
Difference: 0.076 +/- 0.05 C/decade (3.03 σ)
So, a 3.03 standard deviation difference, which we again can use as a benchmark for justifying your argument. Note, however, that if you use this reasoning, you have to accept that just one leg exceeding 2 standard deviations is sufficient to break a longer trend into two shorter trends in your analysis.
So, what then of the argument that the trend from 1910-1945 should be broken into two shorter periods, the first with a flatter and the second with a steeper trend. Again, data and differences are calculated:
1910-1945 0.136 +/- 0.045 C/decade
1933-1945 0.421 +/- 0.165 C/decade
Difference ('10-'45): 0.285 +/- 0.171 (3.33 σ)
Difference ('10-'33): 0.329 +/- 0.185 (3.56 σ)
Quite clearly, the trend from 1933-1945 is statistically significant. More importantly, the difference in trend between 1933-1945 and either 1910-1945 or 1910-1933 is larger than any other difference considered above. Further, it is larger, measured in standard deviations, than any of the trends considered above. Ergo, for you to consider there to be pause from 1945-1970 but not insist that the period from 1910-1945 to be composed of two shorter periods having two different trends applies a double standard. Specifically, you consider evidence stronger than that which convinces you of the 1945-1970 pause to be insufficient to convince you that the period 1910-1945 should not be modelled as one continuous trend.
The case for a downward trend from 1945 is not as strong, primarilly due to the short period (1945-1950). Despite that, the trend verges on statistical significance (see below), and the trend difference is the largest yet examined. Somebody who considers that the post 2000 data "could indicate another pause" has no basis on which to consistently reject that downward plunge. Nor can anybody insisting on a distinct 1945-1970 trend consistently insist on a requirement of statistical significance for both the upward and downward trends for the 1940s spike. The data shows that the 1945-1970 and the 1950-1970 trends are stastically indistinguishable from the 1910-1970 trend; and that the 1933-1945 trend is statistically distinguishable from all preceding and following trends. The most economic way to parse that data is to assume a persistent background trend over the first three quarters of the twentieth century interupted by a sharp upward trend from the mid 30s to mid 4s, after which temperatures relaxed back to the background trend value.
1945-1970 0.008 +/- 0.07 C/decade
1950-1970 0.031 +/- 0.099 C/decade
1945-1950 -0.514 +/- 0.559 C/decade
Difference ('45-'70): -0.522 +/- 0.563 C/decade (1.85 σ)
Difference ('50-'70): -0.545 +/- 0.568 C/decade (1.92 σ)
From Time Magazine, June 24, 1974: " As they review the bizarre and unpredictable weather pattern of the past several years, a growing number of scientists are beginning to suspect that many seemingly contradictory meteorological fluctuations are actually part of a global climatic upheaval. However widely the weather varies from place to place and time to time, when meteorologists take an average of temperatures around the globe they find that the atmosphere has been growing gradually cooler for the past three decades. The trend shows no indication of reversing. Climatological Cassandras are becoming increasingly apprehensive, for the weather aberrations they are studying may well be the harbinger of another ice age.
Telltale signs are everywhere - from the unexpected persistence and thickness of pack ice in the waters around Iceland to the southward migration of a warmth-loving creature like the armadillo from the Midwest. Since the 1940's the mean global temperature has dropped about 2.7 degrees F. Although that figure is an estimate, it is supported by other convincing data." And to think, all these people had to do is talk to a "numbers guy" and he would have convinced them that what they were experiencing wasn't really what they were experiencing.
[PS] Please see "ice age predicted in 1970s" and comment there if you wish to dispute the article. No follow up responses to this particular comment on this thread please.
With respect to the moderator, I do not believe billev has quoted that article to argue that the majority of climatologists in the 1970s predicted global cooling, but rather to argue that they understood global temperaures to have declined since the mid-1940s. That is, he intends it as a distraction from the fact of his clear double standard with regard to evidence, as shown @13. Rhetorically, unable to rebut the statistics @13, he wishes both to distract from the 1910-1945 period, to dismiss the relevance of statistics in favour of popular reports and ancedotes (hence the dismissive comment about the "numbers guy"), and (apparently) to assert that the period from 1945 to 1974 consituted not just a pause, as he has previously argued, but an actual decline in global mean surface temperature. Given this, I will address those points here, leaving out any discussion of climatologists predictions in the 1970s as off topic.
What I will note is that the Time Magazine article no more accurately reflected climatologists understanding of then trends than it reflected their predictions as to future trends. In particular, it claims that "Since the 1940's the mean global temperature has dropped about 2.7 degrees F" (my emphasis). 2.7 F is 1.5 C, an astonishing reduction. Indeed, it is 60% greater than the trend increase from 1880-2014 (Gistemp). The Time Magazine in effect claimed that by 1974, Global Means Surface Temperature (GMST) had dropped substantially below the temperature found in 1880.
Nor can I find any justification for such a claim in the scientific literature. Moran (1974) stated,
Lamb (1974) shows a graph illustrating a similar decline:
Schneider and Kellog (1973), appearing as Chapter 5 in Rasool, Chemistry of the Lower Atmosphere, show a graph with temperature change by latitude band which supports a similar trend (also being based on Mitchell's work).
In short, Time Magazine exagerated the then understood trend by a factor of five.
Since then, significant improvements in methodology, a vast increase in the available stations, and the inclusion of marine data have greatly improved estimates of global temperatures. As a result, only 1 out of 7 Global or Land/Ocean (ie, global less polar regions) temperature indices shows a negative trend over that period (HadCRUT4 -0.002 +/- 0.059 C/decade).
With regard to the anecdotal data, the sea ice claim by Time Magazine, in particular, is deceptive. This is not because there was not thicker winter sea ice near Iceland (there was), but because that was more than compensated by sea ice losses in less accessible areas so that overall sea ice extent declined in that period (albeit, slowly):
So, not only is billev rhetorical distraction beside the point - he finds himself rellying on an extremely inaccurate report of out of date science to make it.
[PS] My point was that the accuracy of the Time article is discussed on that topic, as well as what was the reasoning behind the source. If billev wishes to discuss the accuracy the Time article or the degree to which the article represented scientific opinion at the time, it should be on that topic.
I read it the same way, Tom.
Additionally, one can also look at the warming of the Arctic over the past century+, too:
http://www.skepticalscience.com/arctic-was-warmer-in-1940.htm
We've been down that road countless times before. The claim that "scientists predicted an ice age" has no basis in the scientific litterature. Billev tried to exploit the miserably inaccurate Time article to show that "scientists" showed a decrease in temperature and increase in sea ice in the 70's and such conclusions were completely absent from the scientific litterature, once again. Mass media wildly speculative and sensationalistic pieces pass as "scientists said" for the convenience of scoring rethorical points. Yawn.
Tom, I want to thank you for your responses to my comments. We apparently do not agree but at least you showed enough interest to reply. I made the same comments on the site Watts Up With That and got no response. I was the man who wasn't there. My purpose in making the comments was to see if there was any acknowledgement of what I see as a possible pattern of stepped warming caused by more or less regular pauses in the overall warming trend. I think the current emphasis on man- made warming may be akin to the worry over an impending ice age that was propounded during the period of the Time magazine article I quoted. And there were more of that type of article at the time. I get the feeling we are getting a politically based bums rush about man-made climate change and too many scientists are being carried along. If there is, in fact, a pattern to the warming then I think it will be obvious by the end of the current century. Maybe we will then begin wondering why such a pattern should occur. I shudder to think of the money that will have been wasted before then on uneeded or ineffective measures to control the climate. I am 83 years old so it won't be my worry.
[TD] billev, I'm going to take a chance by assuming you are sincere. You are blind to how rude you have been to everyone who has taken the (sometimes considerable) time to respond to you. "Rude" because you have ignored the content of every single response. The most recent example is your failure to even acknowledge any of the content of the "Ice Age was Predicted in the 70s" post that you have been pointed to multiple times. Instead, in your most recent comment you merely repeated your initial, incorrect, assertion. If you want to continue commenting on the Skeptical Science site, you'll need to respond substantively to the original posts and to other commenters' responses to you. In other words, you must engage in conversation. Otherwise you are merely sloganeering, which is prohibited by this site's comments policy.
Regardless of all of the mind reading about my intentions, my original post only pointed out what I observed in the NOAA mean temperature record from 1880 until around 2000. I pointed out that I perceived two periods of warming and two periods of pause in warming during that period. The replies to my original post have been an attempt to explain away the pauses using several explanations none of which satisfy me as being realistic. What I do note is a desperate need to hide the pauses or avoid any involvment of nature in the pauses so plainly shown in the NOAA graphs.
[Rob P] - The warming from 1910-1940, a time of weak anthropogenic (human-caused) forcing, matches the warm (positive) phase of the Interdecadal Pacific Oscillation (IPO) - the largest natural multidecadal oscillation in the climate system. This is the dominant 'natural factor' that other replies in this comment thread have alluded to. The cooling mid 20th century occurred during the cool (negative) phase of the IPO.
So the cooling back then wasn't only down to increased industrial aerosol pollution blocking/scattering some of the incoming sunlight, the IPO also played a part. Perhaps the most notable aspect of the IPO is that its influence on global temperature has diminished over time - it's being overpowered by the greenhouse gas forcing.
Some useful reading here:
1. Early twentieth-century warming linked to tropical Pacific wind strength - Thompson et al (2014).
2. Drivers of decadal hiatus periods in the 20th and 21st centuries - Maher et al (2014).
3. The influence of anthropogenic aerosol on multi-decadal variations of historical global climate - Wilcox et al (2013).
[JH] You are now skating on the thin ice of excessive repetition which is prohibited by the SkS Comments Policy.
Please note that posting comments here at SkS is a privilege, not a right. This privilege can be rescinded if the posting individual treats adherence to the Comments Policy as optional, rather than the mandatory condition of participating in this online forum.
Please take the time to review the policy and ensure future comments are in full compliance with it. Thanks for your understanding and compliance in this matter.
billev... No one has any obligation to satisfy you with their explanations. The explanations merely need to be correct, which they are. Previous commenters have given you very clear and accurate explations as to each of the various time periods. No one is trying to hide anything.
I believe I stated this before: Warming doesn't just happen for no reason. It is a response to a radiative forcing of one sort or another. Prior to 1940, warming was a combination of increasing human emissions of CO2 and other natural factors. Post 1940 was likely due to increasing aerosol emissions due to rapid industrialization. Post 1970 was when we cleaned up much of those aerosol emissions which unmasked the underlying CO2 forcing.
Just because you can't understand or manage to accept these explanations does not in any way reflect on their accuracy.
I would reinforce what Rob said. You will find it very hard to get people to accept the idea of a natural cycle that violates conservation of energy. Temperatures change for a reason.
However, on an unevenly heated planet that is mostly covered in water, there are natural variations in surface temperature from the ocean. You dont need much heat loss from the ocean upper layer to heat the air quite a lot. Rather than look at surface temperature, try looking at ocean heat content. eg see here Changes to incoming solar (eg volcanoes) are reflected in the wobbles. The steady upward trend however is a diagnosis of long term energy imbalance - the increase in GHG.
So to claim "its a natural cycle", then you need to be pointing to either an externality (eg change in volcano screening or change in solar input), or an internal variation - ocean-atmosphere heat exchange. You can see latest OHC here. Externalities cant explain post-1970 heat rise, so must be internal? Nope. Claiming heat is from oceans while ocean heat is rising is voodoo climatology.
That said, if your "skepticism" about AGW is based on political values or group identity, then I doubt anything posted here will change your mind.
billev
There are other factors to think about when evaluating what the temperature record may or may not mean
The take-away from this is we can't make a judgement about what was going on back then without putting all the pieces of data we have together like a jig-saw puzzle rather than focusing on just one type of data set. And recognising that when we look back to the mid 20th century and earlier many of these datasets are significantly missing/sparse - ocean heat content for example.
What we have now is that all measures of what is happening - ocean heat, sea level, ice sheet melt, land temperatures and atmospheric temperatures are all pointing to warming.
To be a natural cycle the data would need to show different masurements indicating opposite trends as energy cycles between different internal parts of the system. If air temperatures were rising as ocean heat was falling (and the size of the changs was comparable) then we might suspect a natural cylical flow between the two.
The basic conservation Laws - Conservation of energy, mass etc. - require that any natural internal cycle between components of the system produce opposite cycles in the different parts. If all parts of the system are moving in the same direction then internal cycles can't explain it.
This doesn't rule out external cycles such as changes in the Sun's heat output - separate evidence mitigate against them - but all factors moving in the same direction does mitigate against internal cycles.
Basic premise, as pointed out by others. Cycles don't just happen, they always have causes. And those causes must satisfy the conservation laws.
To paraphrase 'S#!t doesn't just Happen! It is Caused'.
The climate It is created by an overlap of natural cycles, mainly the 65-year “Atlantic/Pacific oscillation” (AMO/PDO) and the 208 year “de Vries cycle”.
CO2 is irrelevant for the climate. The temperature will go down in the next years because the solar de Vries cycle just had its maximum.
Here more details: http://notrickszone.com/2013/12/03/german-scientists-show-climate-driven-by-natural-cycles-global-temperature-to-drop-to-1870-levels-by-2100/#sthash.4x551NDK.dpbs
[RH] Fixed image size. Please limit your images to 500px in width.
morken @23 and 24:
1) Here is the Berkeley Earth index of European temperatures from 1750 to 2013:
As can be seen, the very sharp fall in temperatures from 1770-1900 shown in your graph does not exist. Evidently Luedecke has adjusted the data to fit his theory.
2) Your graph clearly predicts a fall in temperature from 2002 to present, which has not occured in the data. Indeed, in the global data there has been an increase in temperature over that period. This looks very like a failed prediction to me.
3) Luedecke et al compare their, purportedly solar driven forcings to European temperatures only. He had good reason to do so as global temperatures fit his curve less well than do his (idiosyncratic) European temperatures:
Note in particular the flatter, near zero trend prior to 1900, the delayed minimum around 1900 (ie, 191--20 rather than 1900 as in his model and the European data), the early (1940) mid twentieth century peak relative to European and Luedecke's model, and the continuing increase rather than the predicted decrease in temperatures post 2000 (not perfectly obvious as the graph lacks the new record setting years of 2014 and 2015).
Not only has Luedecke cherry picked a data set to better fit his theory, but the poorer fit of global data means he is compelled to claim that European, but not global, temperatures are driven by the (global) solar forcing. At least he would if he were not so practised at simply sweeping contrary evidence under the carpet.
4) I note that you so uncritically swallow Luedecke's nonsense that you don't even note the time of peak temperatures on his graph, and therefore don't even note the persistent lack of his predicted decline over the last decade.