


 Arguments


Cherrypicking to Deny Continued Ocean and Global Warming
Posted on 6 March 2013 by dana1981
Cherrypicking global surface air temperatures is one of the most common errors associated with global warming. In reality, a very small percentage of overall global warming goes into heating surface air temperatures, while approxiately 90% is absorbed by the world's oceans (in totality, at all depths). Because many other factors influence surface air temperatures on short timescales, the data are noisy, and as a result it's easy to cherrypick temporary flat periods to wrongly claim that global warming has stopped (Figure 1).
Figure 1: Average of NASA GISS, NOAA NCDC, and HadCRUT4 monthly global surface temperature anomalies from January 1970 through November 2012 (green) with linear trends applied to the timeframes Jan '70 - Oct '77, Apr '77 - Dec '86, Sep '87 - Nov '96, Jun '97 - Dec '02, and Nov '02 - Nov '12.
However, climate contrarians are now more frequently shifting their cherrypicks to the relatively shallow layer of the oceans (the upper 700 meters). The average depth of the world's ocean is nearly 4,000 meters, but the deeper the ocean layer, the more difficult it is to measure its temperature and heat accumulation.
Fortunately most ocean heat accumulation occurs close to the surface, but accounting for less of the deep ocean layers also means missing more global warming. The best ocean heat measurements are for the 0–700 meter layer, which accounts for over 60% of overall global warming. However, only considering ocean heat accumulation to 700 meters also means neglecting 30–40% of overall global warming.
Similar to surface air temperatures, the warming of the 0–700 meter oceans has slowed in recent years (since about 2003), which has made them a ripe candidate for cherrypicking. This was one of the key findings of Nuccitelli et al. (2012), in which we noted that while heat accumulation in the 0–700 meter oceans has slowed in recent years, at the same time it has accelerated in the 700–2,000 meter oceans.
Overall, there is no sign that the warming of the 0–2,000 meter oceans has slowed; in fact, they have accumulated more heat in the past 15 years than during the previous 15 years (Figure 2).
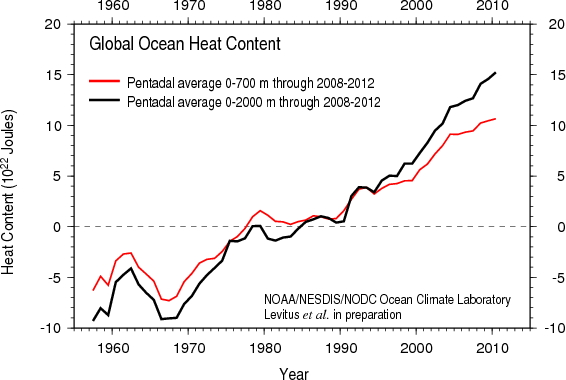
Figure 2: Comparison of Ocean Heat Content 0–700 meter layer vs. 0–2,000 meters layer, from the National Oceanographic Data Center.
It should be no surprise that climate contrarians constantly ignore the accelerated warming of the 700–2,000 meter oceans, pretending that they simply don't exist. In one recent example, a denialist blog disputed the results of Nuccitelli et al. (2012) by showing Figure 3 below (also discussed in this post by Tamino at the Open Mind blog).
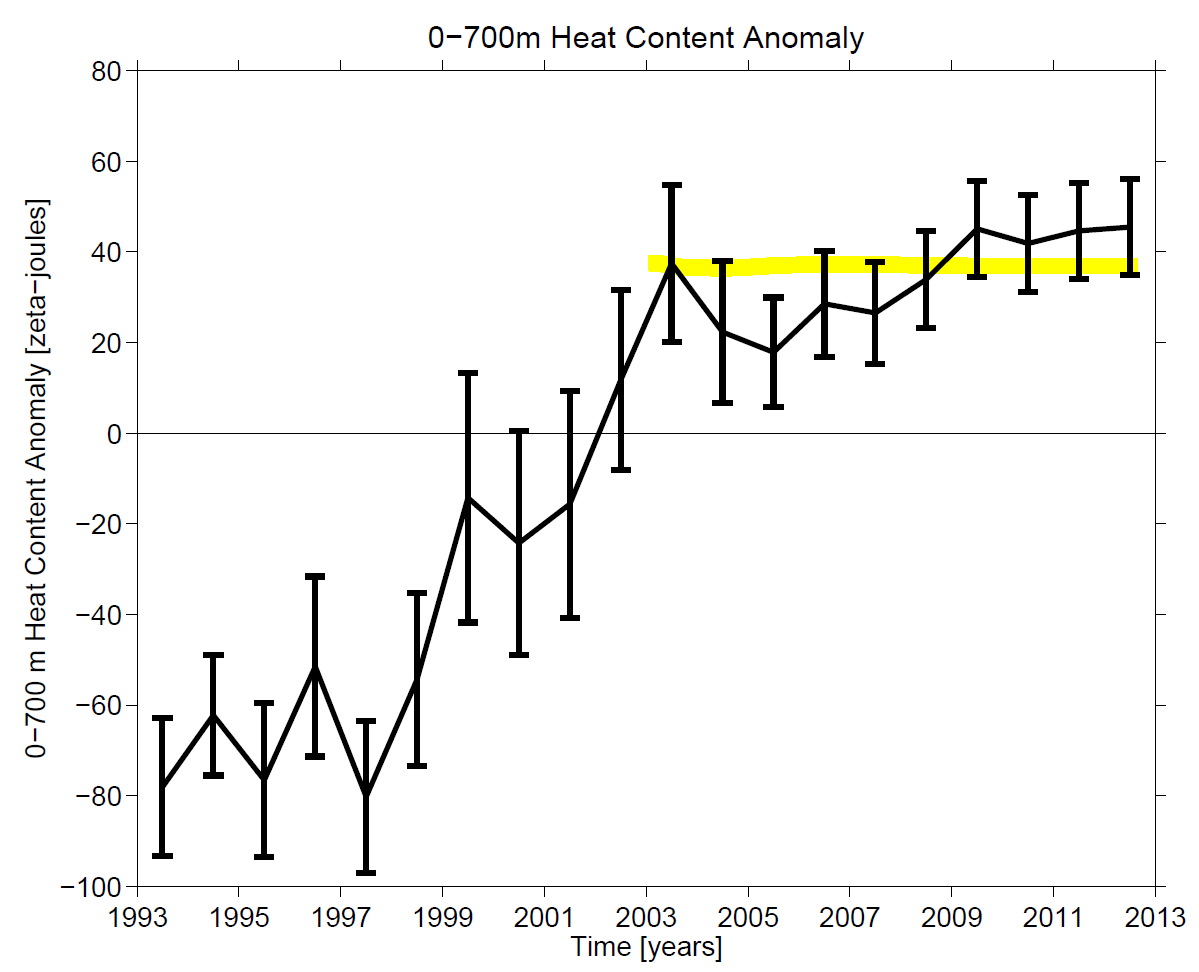
Figure 3: 0–700 meter ocean heat accumulation from NOAA PMEL using the methodology described in Lyman et al. (2010), with an arbitrary yellow line drawn in an effort to indicate slowed ocean warming.
The ocean heat content data used in Nuccitelli et al. (2012) and Figure 2 above are from the National Oceanic and Atmospheric Administration (NOAA) National Oceanographic Data Center (NODC) using the methodology described by Levitus et al. (2012), whereas the data in Figure 3 are from the NOAA Pacific Marine Environmental Laboratory (PMEL) using the methodology described in Lyman et al. (2010).
The Levitus methodology fills data gaps with the averaged value of the available data, which has the tendency to underestimate any anomalies. The Lyman methodology infills the data gaps with anomalies from nearby grids. The end result is that Levitus is likely to underestimate any warming trend, as discussed in Lyman (2008). As a result, the data plotted on the denialist blog actually shows more 0–700 meter ocean warming than the data plotted in Nuccitelli et al. (2012). This is illustrated in Figure 4.
Figure 4: 0–700 meter ocean heat content data from NOAA NODC (Levitus) and NOAA PMEL (Lyman) using the same baseline. The yellow arbitrary denialist line is shown, followed by the linear trends for 2003–2012 and 1993–2012 in red. Standard error bars are also shown.
Despite showing a larger ocean warming trend than Levitus, climate contrarians likely prefer the Lyman data because it does not include the ocean layers below 700 meters. However, even if we cherrypick this shallow ocean data and cherrypick 2003 as the starting point, the 0–700 meter ocean heat accumulation for 2003–2012 in the Lyman PMEL data is equivalent to 1.2 Hiroshima atomic bomb detonations per second over the past decade. For 1993–2012, this rate increases to the equivalent of 3.7 detonations per second, and when including global heat accumulation in Nuccitelli et al. (2012) including the 0–2,000 meter oceans, the Earth has accumulated the equivalent of 4 Hiroshima atomic bomb detonations per second over the past decade.
When we consider all the available data, it becomes quite clear that ocean and global warming continue unabated at a rapid rate. Cherrypicking cannot change that reality.


What's continually amazing to me is how the (fake) skeptics will give Anthony Watts a pass on such a blantant error, but turn around and scream all day long about nuances of the statistical significance of trends.
It just boggles the mind.
It took a few minutes, but I read through the various links. I have to say that Anthony Watts' post is not exactly a model of scientific rigor. I really love that he sums up on his site this post's Figure 3 in this especially rigorous way:
"Sure looks like a pause to me, especially after steep rises in OHC from 1997-2003. Note the highlighted period in yellow:"
And then Watts shortly goes on to write the following to underline his highly-rigorous scientific claim by quoting that highly regarded genuine faux physicist and bonifide television character "Dr. Sheldon Cooper":
"As Dr. Sheldon Cooper would say: 'Bazinga!'"
The delicious irony I find in Watts' choice to use this line from The Big Bang Theory is derived from the fact that it is used in the television comedy when the character has told a joke or pulled off a prank and is letting his friends know they've been played upon. Should anyone wish to fact check me, there is actually a website devoted to the character's use of the term:
www.sheldonfan.com/origin-sheldon-coopers-bazinga.html
Ironically, Watts wrongly seems to think "Bazinga!" is used by the character when he has made a valid scientific point.
I'd say Watts has exercised the same telling degree of intellectual rigor in using the bazinga quote as he's used in presenting his graphic with a yellow line (which, ahem, he only used to highlight the region, don't you know).
Well, sure, if you're gonna be such a stickler as to "consider all the available data".
(nice post - thanks)
I have the feeling that, if and when we deploy satisfactory instrumentation to measure heat content in the deeper ocean (below 2,000 m) we won't like the results.
Previous discussion on deep ocean behaviour has been discussed at Skeptical Science here.
I'm still having fun with Watts' quote: "Sure looks like a pause to me, especially after steep rises in OHC from 1997-2003. Note the highlighted period in yellow:"
Parsing this brief passage, I note that Watts has used the word "rises" to characterize the already brief 1997 to 2003 period. I suspect he did so because the data shows, if we use his vague concept of "a pause," that from 1999 to 2001 there was a similar "pause." And before 1997 there were arguably similar pauses from 1993 through 1999, as anyone with a yellow highlighter could show a la Figure 1.
Of course, by subdividing a graph that is alreadly a subdivision in a sense (as it excludes the data for deeper water) into shorter cherry-picked segments, Watts is able to hide or obfuscate the larger trend even as he leaves room for faux sceptics to point to short periods of decline or even short periods of lower rates of increase as evidence that a longer duration trend has reversed or paused.
I wonder if this kind of manipulation is not in some way linked to a kind of intellectual Attention Deficit Disorder where Watts' followers are concerned. Don't we see the same kind of deluded excitement from the Watts crowd every autumn when the Arctic starts to refreeze?
From the department of redundancy department...
As a literary scholar I find the other side's analysis is often as rich in verbal silliness as it is in scientific gobblygook. Here's a pithy verbal pearl of wisdom from Willis Eschenbach's guest post on WUWT, which was posted in response to the Watts post linked to above:
"the ocean is huge beyond belief"
The quote can be found here:
wattsupwiththat.com/2013/02/25/ocean-temperature-and-heat-content/
Eschenbach makes this profound point in an attempt to back up his notion--or maybe it's a scientific hunch?--that the data on the ocean's heat content or average temperature he is working with is suspect. Here is his complete sentence (the ellipsis is Eschenbach's):
"I find the claim that we know the average temperature of the upper ocean with an error of only one hundredth of a degree to be very unlikely … the ocean is huge beyond belief."
In other words, followers of WUWT should have faith in Eschenbach's idea that the temperature rise he's taken the trouble to graph is of no real signficance because the ocean is really, really, really big to the point where Eschenbach, who has possibly thunk about it hard and long, simply can't wrap his mind around the volume of water involved.
Okay. Fine. I grasp that Eschenbach is trying to imply that there aren't enough sampling points in the vastness of the briny deep to have faith in the stated accuracy of the data, but that is of course exactly the kind of thing scientists take into account when they do their work and present that data. And unlike those scientists, Eschenbach has provided no evidence to back up his claim beyond the aforementioned pearl of wisdom.
Oddly enough, if we accept that the ocean is so huge that even someone as talented as Eschenberg cannot believe how large it is, and we accept that the data is accurate to the degree scientists say it is, then it should occur to Eschenberg and others that the seemingly trifling increases in temperature he has graphed translate into vast increases in heat content over a short period of time.
As this is a very scary conclusion and I hate for people to actually worry about such scary things, I take a modicum of comfort from my own belief that it will not trouble the sleep of regular readers of WUWT.
Oops. I see I changed Eschenbach into Eschenberg in the second to last paragraph above. Mea culpa.
Don9000,
I spent some time today explaining to some deniers that you cannot just cherry-pick a reference value of zero, do a statistical test with your data for a significant difference in your mean value from the reference value (of 0), and then say that the "true" mean value "must be 0" if there is no significant difference.
A perfect example of the "begging the question" fallacy, assuming the result you want to prove as part of your "proof". The "reference value " of 0 has no justification in the data, but these guys were agog at the genius of Anthony Watts, who had given them their heart's desire.
I think my efforts will be in vain, because the main people these deniers want to fool is themselves. And they wll keep going back to the Watts' and McIntyres for re-assurance.
First time I've seen anyone draw an arbitrary line through a graph (Fig. 3), sprinkle magic stats fairy dust on it, and call it a trend.
The stats fairy will love and accept any arbitrary line if it's short enough. That's what makes her useless. I could likewise draw an arbitrarily short and steep — dare I say, alarmist? — line, and it would pass the same stats fairy test.
Even the eyeball test reveals the yellow line as nonsense. 2003-2007 are all near or well under the yellow line; 2008-2012 are all near or well over it.
Matt @10 - to be fair, Watts didn't say the yellow line was a trend, just that he was 'highlighting' the apparent lack of warming since 2003 (which is only apparent because he drew a bogus flat line and didn't plot the actual trends).
Matt,
It looks to me like the vague summation I've quoted above and the nonsensical yellow line was the best material Watts could come up with. After all, his tired comedy act must go on, but the material he's using has been ground very fine--perhaps even as fine as pixie dust.
If Watts has ringed the area in question with the highlighter he might have more of a defence!
Also, could someone from his camp point out the 'global warming "pause" ' since 1997 I keep hearing about in this, his very-own chart? I'm having some difficulty seeing it...
Don9000 @ 12... Oh! I had no idea that pixie dust came in flourescent yellow! ;-)
Well, Rob, it is very, very fine, and to see it you have to believe ... It might help if you donned a pair of ruby red shoes, clicked their heels together three times and--
No. I don't even think that would work.
Don... But it certainly explains a lot about Anthony's methodology.
Does the decrease in solar luminosity that started in 2002 have any bearing on the matter? Would ocean temperatures have increased more if the sun's luminosity stayed the same?
As a climate layperson, I find the lameness of this latest WUWT post to be very strong evidence in favour of AGW. Even without dana's comprehensive rebuttal, it just doesn't pass the sniff test. In fact, it reeks of desparation. If there were good arguments against AGW, presumably they would be getting all the blogspace, leaving no room for this nonsense. Anyone who could draw that yellow "highlighting" line and post it in a serious, non-spoof, non-satirical blog piece is clearly in the propganda business, and not even trying to be reasonable. In fact, the whole piece, if published in another context, could be read as a tremendous spoof on denialism - and Watts doesn't even seem to realse it. The fact that his fanboys don't call him on it immediately also speaks volumes about the whole denialist subculture. They really don't seem to care what the anti-AGW argument is; anything at all will do, no matter how intellectually bankrupt.
Dana1981@11 - Then why is the yellow line labeled "denial fake trend" in Figure 4? If you were aware it was not claimed to be a trend, what possible reason would you have to label it so?
Smith - it looks like a trend and it quacks like a trend. Watts can call it what he likes, but only a cursory dissection is needed to see it's a herring.
Cherrypicking? Generally speaking, cherrypicking is used to show info in the best possible light, it also implies intentional misleading. To present a claim that a trend has stopped, or even alterred, you must use the data at the end of the series. Since they are making the claim that warming has stopped since X, how else should the data be presented other then showing a trend from X to the present?
If they claimed that warming had stopped in 1997 by showing data from 1997 until 2010, then your claim of cherrypicking would be accurate.
In fig 1, by presenting the data with separate trendlines for 1997 - 2003, and 2003 - present, a claim could be made for you "cherrypicking" information, as they have made the calim that warming has stopped in 1997.
In the animated fig 4, Smith(19) already pointed out the yellow line, however, in the second animation, you show two red trend lines, I guess to show the trends for Levitus and Lyman, but both trend lines originate on the Levitus data point for 2004. This is wrong and makes the trend line steeper than it is.
Smith, Watts knows his audience. As you imply, if someone knows what the line is about, it becomes useless and irrelevant. Why, then, would Watts include it? It's reasonable to assume that Watts communicates toward an audience he understands quite well after all these years. That yellow line was not a mistake in communication. He knows quite well that most of his audience is going to read the yellow line as a trend. Even if it's not, and they become aware of that fact, they'll assume that it's close enough. This is SOP for Watts. He's always testing the limits of his audience's gullibility (e.g. the recent Goddard silliness on Arctic ice gain).
Kevin@ 21 - I think the trend lines for 2003-2012 are simply the trends for the two respective sets of data points; I don't think they both originate on any "data point".
To me, as a layperson, the bottomline is: Does Watts try to get at the reality of how ocean energy content is changing; if I read his blog will i be better informed? I have answer no to that question.
Why wouldn't Watts mention 700-2000m data in his post?
Kevin:
The point of the trend lines based on standard statistical practice in figure 4 starting at the same time as Watts' is to show that his claim (based on the eyecrometer and presumption) is false even when restricting oneself to the timeframe Watts has claimed represents a "stall".
Of course, a trend further back is plotted to show that ocean warming is in fact continuing unabated as the time frame Watts treats is much too short to be a reliable indicator of what is going on.
With regards to what constitutes cherry-picking of surface temperature (which is what the "Escalator" animated graphic is meant to lampoon), there are two ways in which claims that global warming has "stalled" or "paused" can be cherry-picks:
In any event, with regards to the specifics of your claim, pseudoskeptics have claimed in the recent past that warming has "paused" in 1997. Their claims constitute cherry-picking for the two reasons noted above.
That is my point! Get rid of the two "escalator" stairs and compute your own trend line from 1997 to the present. The result is very close to a slope of 0, with the margin of error greater than the slope. That means it is not significant!
What time frame do you consider long enough? If the "recent" warming period that CAGW subscribers point to as significant is roughly 30 years (1970 - 2000), then I would think that a significant "stall" of 16 years is note worthy.
Another way to paraphrase this one is to say - regardless of the data, I know it is happening, therefore it is happening.
Also of note in this regard are Kouketsu et al 2011, showing a 0.8x10²² J/decade ocean heat content (OCH) rise in waters >3000 meters, and Levitus et al 2005, showing 14.5x10²² J rise over 1955-1998 (3.37x10²² J/decade) in OHC 0-3000 meters.
---
Kevin - Learn some statistics. The surface air temperature of 1997-present is not statistically significant, the 16 year trend is not significant, and therefore the "stall" is not statistically significant either. Claims of a "stall" are therefore meaningless, and if (as in the choice of 1997 for a starting point) the time period is specifically selected to minimize the trend, it is by definition a cherry-pick, a fallacy of incomplete evidence.
As to how long? Well, for GISTEMP 1995 is sufficient to show that the trend is significant, that the null hypothesis of no warming is invalid.
For any of the instrumental series, over any time span ending in the present:
Stop cherry-picking.
Kevin, a cherry-pick is a rhetorical move. It's performed in order to make the data say what the presenter wants them to say. In essence, a trend period is picked for its support or falsification of the hypothesis. The trend period is not picked for scientific/statistical reasons. Any climate energy trend of less than 30 years used to describe "climate" is a cherry-pick unless it is accompanied by methodology/caveat that accounts for short-term oscillations and forcings. Even 30 years is sketchy.
Further, anyone who uses the clause "global warming has paused/stopped/experienced a hiatus" is being imprecise, and probably for rhetorical reasons (the alternative is ignorance). Increased atmospheric CO2 will increase global energy storage, regardless of what the surface/OHC trends are doing. It will always be warmer with CO2 than without. If there are forcings/feedbacks that balance or overwhelm CO2 forcing, then the phrasing should be "the surface temp trend has recently flattened," and that should be immediately followed by analysis. It would be unphysical to claim that "global warming has stopped" when CO2 continues to rise.
Your reputation as a critical thinker is also not supported by your use of "CAGW." The acronym means nothing without definition of "C." If you'd like to provide such definition, it would help further discussion with you. However, your definition would not be universal. According to the people with whom I have engaged on this issue, the "C" includes everything from the Earth being burnt to a cinder, to 200 feet of sea level rise in the next decade, to simply "more heatwaves." People who use "CAGW" typically know that the definition is ambiguous (I've pushed at least 50 users on this point, and most agreed; the rest refused to answer). What the "C" actually does is identify you as a "skeptic." It's a little "badge of honor," a (not so) subtle sign that you're still "a member," even if you are here engaging with the enemy.
The 16-year GISS surface temp trend from 1992-2007 is .284 per decade. Did any scientist claim, in 2007, that 1) this was evidence for global warming advancing at nearly double the expected rate and/or 2) that this was an indication that the theory/models had completely failed, and that sensitivity would necessarily have to be something like 6-7C? No. Again, if you're going to discuss short-term trends, have the critical awareness to work with the short-term forcings/feedbacks/oscillations instead of immediately honing in on "global warming has stopped!"
Yes, it's happening. Fire up your pyrgeometer. Go check.
OPatrick@20 - I have to disagree. The Watts article has the figure labeled "Sure looks like a pause to me, especially after steep rises in OHC from 1997-2003. Note the highlighted period in yellow:"
He calls it a highlighted period. A period is not a trend.
Besides, Dana1981@11 clearly states "to be fair, Watts didn't say the yellow line was a trend, just that he was 'highlighting'". So my question still stands. Why call it a "Denial Fake Trend", when Watts never claimed it was and Dana also knew it wasn't?
If it's not a duck, even though it looks like one and sounds like one, I would argue that calling it a duck anyway certainly isn't very scientific.
DSL@22 - Your claims to understand Watts' motivations are immaterial to my point. Watts never claimed the yellow line was a trend, Dana knew this, yet it was labeled a "Denial Fake Trend" anyway. All I am wondering is why?
Kevin:
Kindly refrain from paraphrases if you are going to misrepresent what is said.
First, the data do not say what you think they are saying.
The top-of-atmosphere radiative imbalance (reported by NASA to be currently 0.8 W m-2, across the entire surface of the Earth) means that every second the Earth accumulates an additional 4.08 x10⁸ Joules of energy over and above its current heat content. That energy has to go somewhere.
As is noted in myriad other posts on this site - and in fact on this very post - the majority of the excess energy (around 90%) goes into heating the oceans. The basis of your claim is the behaviour of the Earth surface, which represents but 2-3% of the additional energy accumulation and is therefore subject to much wider variability.
In order for global warming to have genuinely halted, it must be the case that the radiative imbalance at top-of-atmosphere is no longer present. As far as I am aware no self-styled skeptic has yet to present evidence showing that this is the case.
So your characterization is entirely false.
Second, the surface temperature record is not a meaningful marker of global warming.
As described immediately above, surface and/or lower troposphere temperature records account for perhaps 2-3% of global warming.
As such, an apparent pause in the surface temperature record just doesn't reveal very much. What would be reavealing is a statistically-significant pause in ocean warming coupled with empirical findings of a long-lasting change in the TOA energy imbalance.
Third, even granting for the sake of argument that the surface temperature record is meaningful, the 1997-present trend does not mean what you think it means.
Using the Skeptical Science trend calculator, the period 1997-2013 has the the following trends (using the datasets that are compiled in the "Escalator" graphic):
The calculator indicates these are 2σ results, so (unless I am mistaken) there is a 95% probability that the actual temperature trend over this period lies within the range given by the ± values.
Because the confidence intervals overlap '0', we cannot rule out the possibility that surface temperatures have not increased in this timeframe. But - and this is a very big but with respect to your claim - we also cannot rule out the possibility that they have increased more rapidly.
If there were really a pause in global warming, as revealed by the surface temperatures, we would need to see a negative temperature trend whose confidence intervals did not also overlap a positive number.
So, for example, the 1994-present GISTEMP trend is 0.135 ±0.106 °C/decade, which is the earliest trend in GISTEMP on the SkS trend calculator where the 2σ confidence interval does not overlap 0.
If, instead, the trend over that period was -0.135 ± 0.106 °C/decade, then we could be confident there was a pause of some kind (in the surface temperature record, anyway).
Finally, it is self-styled skeptics, not defenders of the science (who you smear as "CAGW subscribers") who are making hay over the statistically-insignificant period 1997-present, or indeed, over statistically-insignificant timeframes in the surface temperature record in general - or, in Watts' case as discussed in the OP, in the OHC record of 0-700 m depth of ocean.
Smith: All I am wondering is why?
Because Watts is a great artist of the Impressionist* school. There are pointilists and more lately there are linealists, with Watts being among the latter and intent on conveying an impression of a scene that is in fact not what it looks like at first glance.
*A literary style characterized by the use of details and mental associations to evoke subjective and sensory impressions rather than the re-creation of objective reality.
Wrong. That would imply that there was a decrease in the temperature, not a pause in the warming!
That is my point! Get rid of the two "escalator" stairs and compute your own trend line from 1997 to the present. The result is very close to a slope of 0, with the margin of error greater than the slope. That means it is not significant!
So what I said in 25, quoted above is inline. The margin of error is larger than the slope. At the current rate, after an additional 100 years, the temp will rise an additional 0.4 - 0.8 C. That does not seem that significant, and in fact will achieve the outcome of keeping the temp increase to less than 2 C.
As is noted in myriad other posts on this site - and in fact on this very post - the majority of the excess energy (around 90%) goes into heating the oceans. The basis of your claim is the behaviour of the Earth surface, which represents but 2-3% of the additional energy accumulation and is therefore subject to much wider variability.
As I stated before, AGW (removed the C) states that the warming originates in the atmosphere. If it slows, halts, increases, stops, starts, whatever, here, it will then and only then, continue on to the oceans, starting with the upper layer first. Regardless of whether there is an energy imbalance or not, it the temp increase stalls in the atmosphere, that will dictate a stall in global warming.
Smith said... "Watts never claimed the yellow line was a trend."
That's a fantastically lame excuse for being lazy. In fact, lazy in a very deliberate manner.
Watts flies off the handle for the most minor errors of others but thinks he gets a pass on this? No way!
Smith @19 - quite simply, lines on graphs in this situation usually depict linear trends. But if you want to play that game, I didn't accuse Watts of calling his yellow line a trend. I hope you're not holding me to a higher standard than you're holding Wattsy.
Kevin - choosing a starting point at an anomalously high (or low) point is the very definition of cherrypicking. If you want to argue that global warming has 'paused', make the argument by using real statistics instead of BS cherrypicking. Except you can't, because it hasn't. The only way to make the argument is with ultra-cherrypicking, as discussed in this post.
Smith, can you honestly tell me that if you glanced at that post (and the majority of viewers of Watts' site won't do more than glance at most of the posts) you wouldn't have assumed the straight line drawn on the graph was a trend line? If it had been meant just to highlight a period it would have been more natural to draw it above or below the actual data points to avoid such confusion, or far better still to use a double headed arrow or a highlighter block, rather that a line the same width a trend line would be.
It's not a duck and Dana didn't call it a duck, he called it a fake duck.
Kevin, a trend that is not significantly positive does not mean that there has been a pause; losely speaking it essentially means that the observations do not rule out the possibility of a pause. Anybody that claims that there has been a pause on the grounds of a non-significantly non-zero trend doesn't understand statistical hypothesis testing properly.
Furthermore, as has been pointed out, cherry picking the start date invalidates the hypothesis test anyway (unless you compensate for the implicit multiple hypothesis testing).
Kevin:
It would help if you respond to what other people atually write rather than resorting to quote-mining. Such behaviour is extremely disingenuous and frankly reflects poorly on you.
You also need to adjust your conception on what global warming is, and how the surface temperature record reflects global warming:
The Earth surface temperature, specifically, and atmospheric temperatures generally, are highly variable as a result of energy exhange between the atmosphere and other components of Earth system climate (mainly the cryosphere and the ocean).
One very prominent energy exchange is ENSO (El Niño/La Niña). During El Niño phases the net transfer is from the oceans to the atmosphere (increasing Earth surface temperature); the reverse is the case during La Niña years. But - and this is a very big but - ENSO does not fundamentally alter the Earth energy balance.
It is no surprise that one of the main reasons it even looks like there has been a "pause" is because there was an extraordinarily strong El Niño in 1998 and the last several years have been characterized by neutral or La Niña phases.
Bottom line: what you continue to insist is a pause is, based on the current evidence, an artifact of atmosphere-ocean energy exchange.
The way global warming can be said to be paused is if the energy imbalance at top-of-atmosphere can be shown to have disappeared and the Earth climate system as a whole can be shown to no longer be accumulating energy. Surface temperatures are unsuitable for this purpose.
Dikran Marsupial,
Let me ask the question from the opposite direction, has there been significant warming over this 16 year time frame?
Make sure the same criteria applies as to what is significant.
The warming trend over the last 16 years is not statistically significant. What do you think that actually means?
Composer99,
What/where are you referring to? (-snip-)Kevin wrote: "What is important is, the temp increase has slowed"
The observations do not support that statement (at least not from a statistical perspecive). To assert that this is the case, you need to show that there has been a statistically significant change in the rate of warming, which you have not done.
Dikran Marsupial,
It means that the statement "There has been no significant warming for the past 16 years" is accurate.
Kevin @ 38... If the trend is not statistically significant that merely means that that you have a noisy data set. It means you can't rule out a zero trend, but you also can't rule out a higher trend either, all at the 95% confidence level.
A trend that is not statistically significant means that you need more data. Once you go back far enough to get a statistically significant trend, what do you have?
Kevin, please don't play games. What does the lack of a statistically significant trend actually mean in terms of what we can conclude about global climate from that set of observations?
Kevin @ 42... Wrong. That is a completely inaccurate statement.
Dikran, (41)
What has the warming rate been for the past 16 years?
Compared to the warming rate of the past 30 years, which is greater? By what ratio?
Do we really need to be this explicit?
Does it really matter if the surface or upper ocean warming has slowed down in recent years?
Figure 2 clearly shows that the ocean warming down to 2000 meters has continued unabated after 1997, 1998 or whatever year the denialists prefer to start from.
From 1997 to 2010 the oceans accumulated about 10 x 1022 J of energy, which is sufficient to heat the entire atmosphere by 20oC.
The rate of warming was about 0.45 x 10²² J per year from 1966 to 1997 and 0.77 x 10²² J per year from 1997 to 2010, so the warming has in fact accelerated, not slowed down!
And the reason?
Definitely not the sun, since the present solar cycle seems to peak at the lowest level since the 1880s.
Maybe it's time to start listening to the scientists who predicted this warming many decades ago?
Kevin... You can't compare a trend that is not statistically significant with one that is and expect that you're revealing anything.
GISS since 1973 = 0.166/decade
GISS since 1995 = 0.116/decade
Both statistically significant. Both well within model projections.
Kevin, you appear not to understand statistical hypothesis testing. If you want to make a claim (such as "the temp increase has slowed") on the basis of a set of observations, you need to show that the Null hypothesis, i.e. the opposite of what you want to claim (in this case "the temp increase has not slowed") and show that the observations are not consistent with that null hypothesis.
Hypothsesis tests are not symmetric, the lack of a statistically significant trend does not mean that there has been no warming, just that you can't rule out the possibility that it hasn't warmed.
The "margin of error" as you call it, also include the long term trend, so the observations don't rule out the possibility that warming has stopped, but they don't rule out the possibility that warming has continued at the same rate either. Hence you cannot draw the conclusion that you did on statistical grounds.
You would benefit from dropping the hubris a bit, and just consider the possibility that you don't understand the issue quite as well as you think you do.
Although it's been pointed out that total energy accumulation in the "system" is continuously growing, Kevin seems to be saying that an essentially steady global warming cannot be considered to be occuring because there are changes in trends that approach zero for he surface and tropsopheric temperature record.The response given by Composer99@ 37 addresses this.
Is there any physics-based reason to think that the oceans cannot continue to gain heat energy without the surface temps mirroring them? It seems like their shouldn't be, as longs as thre is water, ice, air, land to allow heat energy flow
(sorry if this question is in the too-basic catoagory)