


 Arguments


Recent Comments
Prev 606 607 608 609 610 611 612 613 614 615 616 617 618 619 620 621 Next
Comments 30651 to 30700:
-
swampfoxh at 07:33 AM on 11 March 20152015 SkS Weekly News Roundup #10B
Anyone:
What are some of the better sources of valid information on the current and medium history (say, 25-30 years) of the Gulf Stream, flow rate in Sverdrups, pattern of the flow, assessments of the causes of changes, etc.?
-
swampfoxh at 04:59 AM on 11 March 2015New Series: Science Communicators – Why We Love Communicating Science
chriskoz,
Twenty years of fying the worlds oceans and continents (except Antarctica) and noticing the changes would take a book, but let me describe one example: On December 15, 1993, (very early winter), I ferried an aircraft from St Johns NFL to Cherbourg France. The North Atlantic from St Johns to Shannon IRE was populated with tens of thousands of icebergs the size of tractor trailers. On February 2, 2012, (quite late winter), I ferried an aircraft from St Johns NFL to Nottodden, Norway via Narsasuraq, Greenland, then Rejkavik, Iceland and on to Norway. There were NO icebergs in that route structure until I arrived approximately 70 miles south of Narsasuraq, Greenland. Between about 50 miles south-east of Greenland on the way to Iceland there were NO icebergs in that part of the North Atlantic.
Regards,
-
wili at 02:41 AM on 11 March 20152015 SkS Weekly Digest #10
Thanks for the El Nino updates.
Romm just posted something on likely increases in rates of warming: thinkprogress.org/climate/2015/03/10/3631632/climate-change-rate/
-
wili at 01:49 AM on 11 March 2015Consensus and geoengineering - how to convince people about global warming
All analogies are imperfect, of course. But comparing geoengineering to an airbag seems particularly inappropriate. If it is one, then it's one that has never been and can never be accurately tested before the crash.
So if it's an airbag, it's one that we're not sure, when activated, whether it will actually do much at all toward cushioning the blow, or whether it will rather smother us, or perhaps it is filled with deadly spikes that will eviscerate us.
We just don't know for sure.
And preliminary studies are not particularly hopeful (unless you only listen to the 'airbag' salesmen). -
Tom Curtis at 01:33 AM on 11 March 2015Ivar Giaever - Nobel Winning Physicist and Climate Pseudoscientist
Ivar Giaever:
"But in 2008 I was in a panel here about global warming and I had to learn something about it. And I spent a day or so - half a day maybe on Google, and I was horrified by what I learned."
Nephre @70:
"The truth is, that the true science is being discerned by collections of disciplines that include physicists, chemical engineers, biologists, and so on. So the idea of summarily attempting to invalidate the credibility to reason of someone ... is just shit."
I don't no about you, but I think spending just half a day (or perhaps a whole day) googling a topic, and then using the results of whatever blog posts you found in that google search to dismiss the work of thousands of scientists is an excellent example of "summarily attempting to invalidate the credibility of someone". So if Nephre is consistent (which they won't be) they will consider Giaever's foray into climate science as "just shit".
Well who could disagree with that assessment?
What is more important, however, is that the OP did not "summarilly attempt to invalidate" Giaever. Rather, it went in detail through the claims and in detail rebutted them. And the rebutals were not based on half a day on google, but (given that the author was Dana) a detailed knowledge of climate science built up by years reading climate science papers, IPCC reports, books and (I am sure) the occasional blogpost. The fact is that on Climate Science, Giaever by his own admission is completely inexpert. He lacks relevant domain knowledge and familliarity with the relevant literature. Dana can reasonably claim to be an expert on the topic. Nephre, however, is quite happy to summarilly summarily attempt to invalidate the credibility to reason of someone whose boots they are unlikely be able to fill themselves, without for a moment actually engaging with the relevant evidence.
We know what Nephre's conclusion would be - if there were any consistency in their reasoning. Unfortunately there is not. It is just more pointless denier crap.
-
Tom Curtis at 01:16 AM on 11 March 2015It's the sun
Dan Pangburn @1108:
1) ΔQ is actually average rate of change of heat content per unit area. That means all units on the right hand side are in terms of Watts per meter squared, and on the left hand side the units are Degrees Kelvin times Watts per meter squared per degree Kelvin = Watts per meter squared. I apologize for the mistatement. My mistatement in no way, however, justifies your failure to account for either OLR or ΔQ in your formulation.
2) Forcing is by definition "...is the change in the net, downward minus upward, radiative flux (expressed in W m–2) at the tropopause or top of atmosphere due to a change in an external driver of climate change, such as, for example, a change in the concentration of carbon dioxide or the output of the Sun" (AR5). As the forcing is a change, it must be specified relative to a particular index time. By convention, and by specification in AR5, that time is 1750. It can, however, be any time. There is no need for it to be the start time of any given period. Ergo, your definition of "break-even" is satisfied by my examples on condition that ΔQ = 0 at the initial point.
That, however, is entirely a distraction. My example can be easilly reworked so that the forcing in Scenario A is 0, that in Scenario B it starts at - N, and ends at + N, with a linear trend throughout, and so that in Scenario C it starts at + N and ends at - N, with a linear trend throughout. Once N, and the duration is specified, the logical consequences are the same. That, I believe is self evident so I wonder why you are distracting with irrelevant (and fallacious) trivia rather than actually trying to deal with the argument.
-
Nephre at 01:15 AM on 11 March 2015Ivar Giaever - Nobel Winning Physicist and Climate Pseudoscientist
Kind of interesting: The clear evidence that the writer of this article is a pseudo-climate-scientist ... or even just a pseudo-scientist is the use of an ad hominem attack against Ivar. It gets worse immediately because Ivar's credibililty as a thinker is attacked. Is it not understood that "climate science" is not the product of a University-awarded degree in "climate science?" Indeed, when you hear the neighbor's kid is getting his undergraduate degree in "climate science" don't you role your eyes (at least to yourself)? I do, because if there is one very likely scam degree it would be one so named - "climate science." The truth is, that the true science is being discerned by collections of disciplines that include physicists, chemical engineers, biologists, and so on. So the idea of summarily attempting to invalidate the credibility to reason of someone whose boots you are unlikely be able to fill yourselves is just shit. Sorry. By doing so, you really just smeared feces all over your own petty faces. You can't make the data go away and the data is the basis of reasoning if you pretend to science at all. Instead, by using ad hominem is the opening, and then pretending that the complexity of the data "goes your way" you simply undermine your own blog. I can't help you there.
Moderator Response:[DB] Fake ad hominems and inflammatories struck out.
Please note that posting comments here at SkS is a privilege, not a right. This privilege can and will be rescinded if the posting individual continues to treat adherence to the Comments Policy as optional, rather than the mandatory condition of participating in this online forum.
Moderating this site is a tiresome chore, particularly when commentators submit offensive or off-topic posts. We really appreciate people's cooperation in abiding by the Comments Policy, which is largely responsible for the quality of this site.
Finally, please understand that moderation policies are not open for discussion. If you find yourself incapable of abiding by these common set of rules that everyone else observes, then a change of venues is in the offing.Please take the time to review the policy and ensure future comments are in full compliance with it. Thanks for your understanding and compliance in this matter.
-
Dan Pangburn at 00:38 AM on 11 March 2015It's the sun
Tom - It appears that your equation has forcing, in Joules per sec (aka watts) subtracted from energy, in Joules. That would be like subtracting your speed in mph from your distance traveled, in miles.
Perhaps it is unclear that the beginning and ending temperatures are the same in the definition of break-even. Given that requirement, the time-integral of the forcing from beginning to end must be zero. Then each of the periods A, B, and C must (by definition) begin and end at the same temperature and the time-integral of the forcings for each of them must all also be zero.
This has only to do with the meaning of the word 'forcing' as used in discussing climate change.
-
Summary of climate change impacts
uncletimrob - It's very good to hear that your students are becoming more aware of the issues.
I would suggest that if interested you go to the IPCC reports (the most recent AR5 here) and read through the individual sections 'Summary for Policymakers' for overviews of the science, impacts, mitigation, etc. Those are written for non-experts, and present a good layout of what we know. Follow up with the 'Technical Summary' for any report you have more detailed interest in.
As an example, here's Figure SPM.2 from AR5 WGII showing the distribution of climate change impacts:

-
uncletimrob at 17:44 PM on 10 March 2015Summary of climate change impacts
Thanks for this post. Some of those high level reports are heavy going so I am reluctant to recommend them to my (high school) students. Your post is a good summary that I am more than happy to add to the recommended reading list. Slightly off topic but I'm getting more enquiry about AGW from my students than I have in the last few years. I have a science background but not in climate science so summaries like this are good for me too!
Tim
-
Tom Curtis at 06:48 AM on 10 March 2015It's the sun
Dan Pangburn @1106:
1) Your formulation ignores Outgoing Longwave Radiation (OLR), which is to a close approximation a linear function of Global Mean Surface Temperature (GMST). You also ignore change in heat content. Specifically:
αΔT = ΔQ - ΔF,
where ΔT is the change in temperature, ΔQ is he change in heat content, and ΔF is the change in forcing, and α is the climate feedback parameter, ie, the change in OLR in Watts per meter squared per unit change in temperature in degrees Kelvin. (The climate senstitivity parameter should not be confused with the climate sensitivity factor, λ, which is 1/α.)
Because OLR is a function of temperature, you can in theory have identical forcing histories with different temperature histories and end up with a different final temperature as a result. Ergo, your concept of "break-even" is undefined. There is no unique integral of forcing history such that given that forcing history the temperature will always be the same at the initial and final points of the period of integration.
2) Ignoring point (1), if your analysis is correct, then if we have a period, t, over which we have an integral of forcing, then we also have two non-overlapping periods of lenght t/2 in which the same reasoning applies.
Now consider three possible forcing histories, each with the same integral of forcing. In history A, forcing is constant over the full period at "break even". In history B, forcing stars at half of the level in history A, and increases linearly to 1.5 times the forcing in history A. In history C, forcing is the mirror image of history B, starting high and ending low. In each case, the integral of forcing over the full history is identical, and at break even.
Given your reasoning, however, the integrals of forcing for the first half of t are 0.5, 0.375 and 0.625 for A, B and C respectively, treating the forcing integral over the full period as being 1. Conversely, the integrals over the second period are 0.5, 0.625 and 0.375 respectively. Ergo, according to your reasoning, temperatures will stay constant in history A, initially fall, and then rise in history B, and initially rise and then rise in history C. Ergo, according to your theory we can distinguish as to whether a given forcing is an adequate account of a temperature change by tracking not just the integral, but the integral over subunits of the total time.
Indeed, according to your theory, if we make the subunits the smallest value for which we have clear resolution of the data, temperatures over those subunits should track the integral of forcing over those subunits. In fact, ignoring noise, if a given factor is the dominant forcing, temperature should track the actual forcing with high correlation.
But, of course, temperature does not track TSI with high correlation. That is why you introduced your theory to begin with. Ergo, your theory actually disproves your contention unless you deliberately avoid applying it critically. That is, your argument only looks good by avoiding detailed analysis.
-
scaddenp at 06:09 AM on 10 March 2015The oceans may be lulling us into a false sense of climate security
I think the ocean cycles are quasi-periodic and thus do not have the predictability which would allow prediction of when they would next reinforce.
-
william at 04:53 AM on 10 March 2015Does providing information on geoengineering reduce climate polarization?
The danger of discussing geo-engineering is that the public will then think they have a get out of jail card. We can continue to pollute - no need for developing renewable power supplies because the engineers will come up with a solution. Even supposing that we could find a solution, what happens at the next economic chrisis when geo-enginering is the first item to be cut. Doesn't bear thinking about.
-
william at 04:48 AM on 10 March 2015The oceans may be lulling us into a false sense of climate security
Presumably, if the authors have a handle on the periodicity of these two waves that influence climate, they should be able to predict when will be the next time that they reinforce each other in the warming direction for the climate.
-
David Kirtley at 02:57 AM on 10 March 2015Summary of climate change impacts
Good post, Anders. You (and SkS readers) may be interested in the series of posts I did at Global Warming Fact of (the Day last May on the impacts of climate change. I also used the WG II report as a rough guide to specific impacts around the globe.
-
Dan Pangburn at 00:23 AM on 10 March 2015It's the sun
KR - To have an effect, forcings, must exist for a duration. The time-integral of the forcing accounts for both a variation in magnitude and the duration.
Break-even is defined (by me) as the constant net forcing that would result in the same average global temperature (AGT) at the end of a duration as existed at the beginning. For example, the duration could start at some time during the MWP and end at a more recent time when the AGT was the same.
If net forcing exceeds break-even, AGT will rise (AGT at the end of the duration will be higher than it was at the beginning) or if it is less than break-even, AGT will decrease. (Break-even is not the static (steady-state) solution to a dynamic heat transfer problem)
The net (or total) forcing is the algebraic sum of all constituent forcings. The constituent forcings could each vary but the algebraic sum of the time-integrals of the individual constituents is the same as the time-integral of the algebraic sum of the constituents (for the same time period).
The time-integral of the algebraic sum of the constituent forcings is the energy change of the planet (for the duration of the forcings) and the energy change divided by the effective thermal capacitance (sometimes called thermal inertia) of the planet is the AGT change (during the time period).
If TSI is considered to be one of the constituent forcings, then its effect on AGT (as one of the constituents, its contribution to the total AGT change) is determined by its time-integral. To be conceptually correct, when on the same graph, the time-integral of TSI is the correct metric for comparison with AGT change.
-
CBDunkerson at 22:47 PM on 9 March 2015There's no empirical evidence
Talvar is almost certainly referring to data from the Swarm satellites which recently showed that magentic field strength was changing ~10 times more rapidly than expected over a six month period. The expected rate, based on research suggesting that a magnetic pole reversal is underway, was approximately 5% per century... multiplied by ten yields his 5% per decade. However, as noted, that is based on six months worth of data from a new system. There is no evidence whatsoever that this has been going on for a long time as he implies.
Further, it just isn't relevant because this cannot "very easily account for elevated temperatures". To my knowledge no one has even suggested a mechanism to explain how variations in the Earth's magnetic field would cause massive planetary warning. If anyone ever tries they will have a fun time explaining why there seems to be no connection between the pattern of magnetic variation and the pattern of warming... e.g. during that six month period the magnetic field over the entire North America continent actually strengthed greatly (that change being offset by declines elsewhere around the globe), yet the western part of the continent was warmer than normal and the eastern portion colder.
-
Talavar at 16:08 PM on 9 March 2015There's no empirical evidence
I find it rather odd that nobody ever brings up the fact that our Magnetosphere has been steadily weakening during all of this "climate change" nonsense.
It has been weakening by 5% per decade, this could very easily account for elevated temperatures and erradic weather patterns. Just food for thought.Moderator Response:[PS] Please substantiate your claim of 5% per decade and that this has only started happening over period of global warming, and how a weakening magnetosphere can warm the earth. Unsupported claims are sloganeering and violate comments policy.
Further - if you are linking to Svensmark cosmic ray hypothesis, then please see here for what the science has to say about this
-
One Planet Only Forever at 06:05 AM on 9 March 2015The oceans may be lulling us into a false sense of climate security
Rob P, The Kelvin wave appears to be significant and has grown since the Mar 4 image you shared in response to the first comment. It will be interesting to see what ultimately develops. It will also be interesting to see if the SOI values grow more suportive of El Nino. The Prelimiary SOI values here indicate that the SOI may be returning to steady negative values. Time will tell.
Also, a further clarification of my comment about the Australia Bureau of Meteorology ENSO forecasts of last year compared to this year. The history of their ENSO Tracker levels is here. The February 2014 level was El Nino Watch. The February 2015 level was El Nino Neutral. The current ENSO Tracker level on the most recent ENSO Wrap-up here has reterned to El Nino Watch
-
Jim Hunt at 03:45 AM on 9 March 2015Arctic sea ice has recovered
Re @73 & @74 - A whole range of Arctic sea ice metrics, now including Cryosphere Today area and DMI extent, are currently at their lowest ever levels for the date in their respective historical records:
-
One Planet Only Forever at 01:45 AM on 9 March 2015The oceans may be lulling us into a false sense of climate security
Regarding my previous point about how the El Nino season of 2014 started not beaing an indication of how it will develop, I was referring to the strong SOI values in early 2014 whish are often precursers of a developing El Nino. THe SOI history is here. In the SOI history the March value was strongly negative at the time of the season an El Nino condition has historically been seen to begin. That SOI was very short lived and the ONI never reached +0.5 C. However, the Australia Bureau of Meteorology ENSO forecasts for 2014 were for a higher probability that an El Nino would develop in 2014 than they are currently indicating for 2015 (current report is here).
Moderator Response:[Rob P] - Current status of the Kelvin wave making its way east across the equatorial Pacific Ocean...

-
One Planet Only Forever at 01:35 AM on 9 March 2015The oceans may be lulling us into a false sense of climate security
This discussion about 'declaring an El Nino' has brought up some new details that help me better understand what is going on. It appears there are actually two different El Nino related matters being discussed:
- Have the recent months met the NOAA threshhold for being declared an El Nino event? If March 2015 is warm enough then the 5 consecutive ONI values of +0.5 C or warmer will have occurred starting in SON 2014. The NOAA ONI value history is here. And the current SST in the Nino 3.4 region presented here is currently +0.7 C which would mean it is quite likely that the March 2015 SST in the Nino 3.4 region will be warm enough to meet NOAA's threshhold for an El Nino event.
- Is an El Nino event going to develop in 2015? This is a disussion about what will happen in the upcoming time frame which is historically the time that an El Nino event would begin to develop. The model predictions presented in Figure 7 in the NOAA ENSO discussion start with the December-January-February value of the ONI of +0.5 C, down from the preceding NDJ value implying that the previous near-El Nino event was waning. So the discussion is about what will happen through 2015. The indications are that El Nino conditions have started to strengthen, in line with the average of the model predictions. And the current developing conditions could be the start of a significant El Nino event. However, 2014 proved that how the El Nino "potential event" starts is not a guarantee of what is to come.
Reviewing the NOAA ONI history it is clear that many El Nino conditions begin in May, June, or July of one year and continue until the early part of the following year. However, the ONI record includes several instances where the El Nino events get established later in a year and continue through the next year only waning after a nearly 2 year period. The following are the cases where this occurred:
- DJF 1953 to JFM 1954
- JAS 1968 to DJF 1970
- JAS 1986 to JFM 1988
- ASO 1976 to JFM 1978 (a bit of a cheat because from FMA 1977 to JAS 1977 the ONI values are +0.3 and +0.4)
- (many La Nina events also span periods longer than 1 year)
What is certain is that the CO2 concentration in the atmosphere continues to rise rapidly. And that increased amount of CO2 will produce significant changes, including changes ine the oceans bue to a large percentage of human produced excess CO2 going into the oceans. And those changes can be seen in the history of many measurements, including in the changes in the 30 year average SST values in the Nino 3.4 region that NOAA updates every 5 years seen here.
-
Jim Hunt at 00:17 AM on 9 March 2015A melting Arctic and weird weather: the plot thickens
Yet more Arctic melting! A whole range of Arctic sea ice metrics are currently at their lowest ever levels for the date:
Arctic Sea Ice Area Lowest Ever (For the Date!)
What's more yet another storm is brewing!
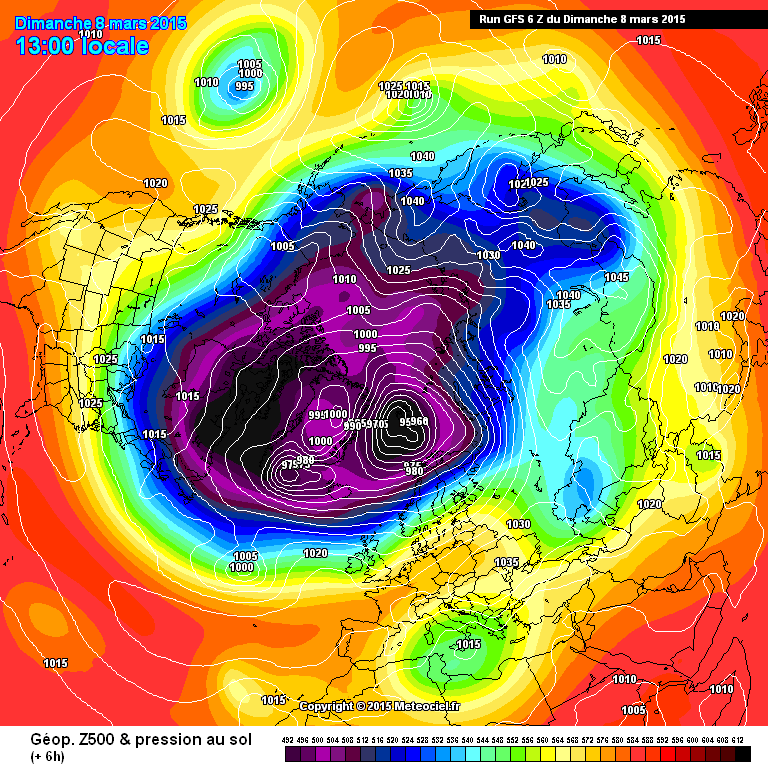 and air temperatures above the North Pole are much the same as on the shores of the Great Lakes.Moderator Response:
[RH] Resized image. Please keep images down to 500px so they don't break page formatting. Thx.
-
billthefrog at 20:56 PM on 8 March 2015The oceans may be lulling us into a false sense of climate security
@ John H #14
Of course what's far more significant than semantics is the effect that this el Nino-ish thing is going to have on global temps. (And more importantly still on people's lives.)
As you know, Gistemp, HadCRUT, NCDC, BEST and JMA all had last year as the warmest on record. Focussing just on Gistemp (as an example - hopefully not cherry-picked) Jan 2015 was 0.07oC up on the equivalent month in 2014. This will already have pushed the rolling 12 month average up by another ~0.006oC.
Feb 2014 was the real party-pooper, as (on Gistemp) it was almost a quarter of a degree down on the J-D annual average. However, the Nino 3.4 monthlies are frighteningly different. This year, the Feb anomaly is about 1.3 or 1.4oC up on last year. Similarly, the deltas on the Nino 3.4 monthlies for Dec and Jan were both a fraction under 1.2oC up on their equivalents from a year earlier.
If there is any predictive skill there, one might reasonably expect Feb 2015 global surface temps to be > ~0.1oC up on Feb 2014, hence pushing the rolling 12 up by about another ~0.01oC.
Of course, as the Pacific has an area of about 165 million sq kms, as compared to the paltry 6.2* million sq kms of the Nino 3.4 region, some caution is called for. (* Assuming I can still remember how to work out areas on a sphere.)
@OPOF #16
"I would suspect that the next update of the ONI baseline for 1986-2015 will not be another leap up"
Yep, that's exactly how I interpreted it as well. Let's wait and see if we're correct.
cheers bill f
-
Jim Hunt at 19:53 PM on 8 March 2015Understanding Time of Observation Bias
By way of example, my particular hobby horse is Arctic sea ice. I went away and posted a helpful answer to a question on the topic of "State of the Sea Ice – February 2015" that remained unanswered at WUWT. My answer is still invisible at WUWT, and the question is still unanswered:
https://archive.today/aNInJ#selection-12501.0-12507.54
-
Tom Curtis at 11:07 AM on 8 March 2015The oceans may be lulling us into a false sense of climate security
Cool Hand Luke @15, there has been some discussion of this at And Then There's Physics which you may find useful, starting with Jac's question.
In short, CO2 will be drawn down essentially by four processes. They are:
1) Draw down and equilibrization into the surface ocean and biosphere;
2) Draw down and equilibrization with the deep ocean;
3) Reaction of oceanic CO2 with calcium carbonate (CaCO3); and
4) Chemical weathering of rocks leading to a long term draw down of CO2.
All of these occur at different rates. The first occurs over the first year after emissions, and accounts for most of the reduction of the airborne fraction (ie, the fact that only 45% of total emissions actually remain in the atmosphere). The rates of the other three are illustrated by this diagram:

The diagram assumes an instantaneous pulse of CO2, so it does not distinguish between the surface and deep levels of the ocean. Further, it shows all CO2 initially entering the atmosphere. In the actual situation, with the gradual ramp up of CO2 emissions (in human terms), the start point for draw down would be at about 700 ppmv for the emissions shown in the diagram. Therefore ocean equillibriation (step 2) would draw down from 700 to 650 ppmv over 300 years, or at a rate of 0.167 ppmv per annum. As there are 2.12 (IPCC AR5) to 2.13 (CDIAC) Gigatonnes of Carbon per ppmv of atmospheric CO2, that amounts to 0.355 GtC per annum to allow a stable atmospheric concentration over the first approx 300 years of after peak emissions*.
After that, calcium carbonate buffering (step 3) draws down CO2 from about 650 to 450 ppmv over 5000 years. That represents a reduction of 0.043 ppmv per annum, or about 0.09 GtC per annum to maintain constant CO2 over that period.
Finally, the remainder of the CO2 is drawn down by chemical weathering over the course of about a million years. That represents 0.00017 ppmv per annum, or 0.0004 GtC per annum, for what is practically for ever (as David Archer points out).
To summarize, that is approximately 0.355 GtC per annum for the first 300 years, 0.043 GtC per annum for the next 5000 years, and 0.0004 GtC per annum thereafter. In terms of current emissions, that is 3.55% for the first 300, 0.43% for the next 5000 years, and diddlysquat thereafter.
You should not get too hung up on these figures. Different models of carbon uptake will vary the results by up to 30%. Further, the exact figures change significantly with increased cumulative CO2 emissions. Further, increased climate sensitivity reduces the permissible short term emissions (due to reduced capacity for the ocean to store CO2), but increases permissible long term emissions (due to increased chemical weathering). Finally, and obviously, I have made linear estimates of obviously non-linear functions so that there will be substantial variance over some years, particularly in the short term. In short, these are ballpark figures, not exact values. The important points to realize are that:
1) Currently only 45% of emissions remain in the atmosphere because we are using the bulk of short term storage in other earth systems (ocean, biosphere). Therefore we cannot simply reduce CO2 emissions to 45% of current values and expect CO2 concentrations to stabilize. We need a much larger reduction than that.
2) Within a very short time in historical terms, we will need to reduce CO2 emissions to essentially zero. Given that, we might as well make that our current target.
3) Stabilizing CO2 is a bad call in any event, as it ensures we experience the full equilibrium climate response, whereas by reducing CO2 levels (by natural draw down if by no other method) we can ensure an earlier and lower peak climate response, significantly reducing the damaging impacts of anthropogenic global warming.
* I have not read a decription of the model run used for this graph, and may be misinterpreting the net emissions and time period over which they occur. Calculating the short term stabilization target by a rule of thumb by David Archer, ie, that we will 25% of emissions will remain in the atmosphere in the short term, with the rest lasting effectively forever, we can calculate that there will be a 20% further reduction over the three years. For current emissions, that amounts to 55 ppmv over 300 years, or 0.18 ppmv per annum (0.4 GtC per annum). Ergo, the figure is in the right ballpark. More importantly, it is nowhere near the 45% (or even 55%) of current emissions some people mistakenly estimate.
-
One Planet Only Forever at 08:21 AM on 8 March 2015The oceans may be lulling us into a false sense of climate security
billthefrog,
The NOAA presentation of the history of 30 year averages of the Nino 3.4 region that they re-baseline every 5 years also shows that the most recent 30 year baseline values (1981-2010) are about 0.4 C warmer than the first of the 30 year baselines (1936-1965). This means that an el Nino event today has suface temperatures that are 0.4 C warmer.
And as you noted there are definite leaps of the baseline that were due to significant El Nino events during the 1991-1995 and the 2000-2005 period (which can be seen in the NOAA ONI history). Note that the 1997/98 event did not produce a step up because it was in a set of years that included significant la Nina events. So I would suspect that the next update of the ONI baseline for 1986-2015 will not be another leap up.
-
Cool Hand Luke at 08:15 AM on 8 March 2015The oceans may be lulling us into a false sense of climate security
At what level of Global CO2 emission would the Atmospheric PPM of CO2 come down?
-
John Hartz at 05:33 AM on 8 March 2015The oceans may be lulling us into a false sense of climate security
bill f: To complicate matters further, see the discussion contained in:
El Nino declared as climate scientists watch on with 'amazement' by Peter Haman, Sydney Morning Herald, Mar 6, 2015
It appears that meterologists in both Japan and Australia were surprised by the NOAA declaration.
The bottom-line seems to be that the chararcteristics of the current El Nino do not completely align with those of the typical El Nino.
-
billthefrog at 01:06 AM on 8 March 2015The oceans may be lulling us into a false sense of climate security
@ John H & Wili
Hi again guys,
As Tom Curtis sagely states in #11, a single number is a pretty restrictive way of thinking about ENSO. The people at NOAA obviously think so as well, as, back in January, they put out a blog piece describing the need for, and relationships between, a multitude of ENSO-related indicies.
In the body text of NOAA's diagnostic discussion and the NOAA blog piece that were both linked to in #10, the phrase "el Nino conditions" occurs more often than does "el Nino" without the trailing modifier. When restricting the context to references to the current state of affairs in the Pacific, the phrase "el Nino conditions" is vastly more prevalent.
By way of an analogy, in the whacky world of economics, there exists the dreaded word - recession. A country can often (always?) be described as being "in recession" when it has experienced two consecutive quarters of negative growth. (I just love that expression!)
If we were 70%-80% of the way through the second quarter of negative growth, and things were still in the shit, some analysts would say the country was in recession. Others (especially those representing the party in power) would cavil at this, saying a necessary criterion had not been reached - yet.
OK, call me Mr Cavil. I am aware that I am raising a petty objection, but, in the NOAA blog relating to multiple indicies, it clearly states in the opening paragraph...
"At NOAA, the official ENSO indicator is the Oceanic Niño Index (ONI), which is based on sea surface temperature (SST) in the east-central tropical Pacific Ocean."
It is also perhaps worth remembering that, in addition to not yet having 5 consecutive rolling 3-month averages >= + 0.5oC, we don't even have 5 individual months, as the October figure was +0.46oC.
To avoid going round in circles further, I have sent an email to Michelle l'Heureux at NOAA to ask if she, or a colleague, might care to drop in and tell it like it is.
cheers bill f (pedant to the nobility)
-
billthefrog at 00:14 AM on 8 March 2015The oceans may be lulling us into a false sense of climate security
@OPOF #9
The NOAA page showing the rolling 5 yearly baseline increments to which you linked does indeed contain a wealth of information .
Up until the last 4 such periods, the rise was pretty monotonic, but has subsequently gone up in punctuated lurches. If you calculate an overall average for the ONI in each of the 4 most recent 30-year windows, you see that it also lurches in an analogous fashion. Each time the baseline is recalculated, it is somewhat affected by the relative frequencies and intensities of ENSO events occurring within that 30 year window.
In December last year, I thought I had noticed a typo in the page describing the changes, but I was just being thick. Michelle L'Heureux of NOAA had to patiently explain to me that the first of the 5-year shuffles was anomalous because it wasn't 5 years long - it was 6 years.
cheers bill f
-
Jim Hunt at 22:30 PM on 7 March 2015Understanding Time of Observation Bias
Zeke - The folks at WUWT, including Anthony himself, are regularly "economical with the truth". Here's proof positive of that assertion:
http://GreatWhiteCon.info/2015/01/mark-serreze-and-the-arctic-sea-ice-death-spiral/
Tony and his band of merry moderators also suppress polite but adverse commentary. How much luck do you suppose I would have if I tried to put them all straight on this occasion?
-
MA Rodger at 21:40 PM on 7 March 2015Arctic sea ice has recovered
As of today, NSIDC's Charctic graph is showing 2015 as the lowest SIE on record having just dipped below 2006. JAXA, who show a less icy 2006, put 2015 well below 2006 & 2011.
Mind, the timing of the maximum freeze is a little delayed nowadays compared with the climatology in the graph @73 so there is still a couple of weeks for things to change around.
-
MA Rodger at 21:31 PM on 7 March 2015There's no empirical evidence
Continuing from #247 in the absence of a RedBaron reply.
I see no evidence that Houghton and others are in error over CO2 emissions from land use.
Concerning the issue of the role of soils in the reduction of atmospheric CO2 levels over the last 19 million years, this contention is based solely on the work of Retallack (eg Retallack 2013) which attempts to argue that there are three competing theories that could be responsible for this reduction, rock weathering, ocean up-take and soil creation and Retallack argues that soil creation is the most likely. Such argument is badly flawed as Retallack makes the same basic mistake as Teague & Savory described @244. From Retallack (2013):-
"If grassland soils sequester approximately 1 kgC per sq m more than do preexisting woodland soils (Retallack 2001), 40% of the current world’s land surface of 148,940,000 sqw km could have sequestered an additional 596 PgC, comparable with 750 PgC as CO2 currently found in the atmosphere (Sanderman et al. 2010) and compatible with the observed halving of atmospheric CO2 over the past 19 million years ."
However, to draw down atmospheric CO2 to half the level, say by 700 PgC, there will also be a need to sequester the resulting emissions from the biosphere (350 PgC) and the oceans (2,450 PgC) as the atmospheric level is in balance with boisphere and ocean. This totals at 3,500 PgC. (These figures very roughly based on the work of David Archer.)
The colder oceans would have taken perhaps 1,400 PgC leaving 2,100 PgC but the oceans can be considered as a feedback mechanism due to global cooling. The appearance of deeper soils may have reduced the amount of rock weathering required to handle the 2,100 PgC, but if this was something like 600PgC, the largest contribution to CO2 draw-down remains rock weathering.
The final line of argument fron RedBaron was the use of agriculture to sequestrate CO2 from the atmosphere and reduce the atmospheric levels despite continuing emissions from fossil fuel use. Because of the basic error described above, this could only hold CO2 levels static. It could not reduce them with the present CO2 emission levels. That in itself would be a wonderful thing to achieve if it were possible but it would require a change in agricultural practices worldwide to get such a result, a task almost as difficult as weaning mankind off the fossil fuels which is the primary cause of our problem.
-
Tom Curtis at 12:29 PM on 7 March 20152015 SkS Weekly Digest #9
Barry Bickmore has a beautiful take down of the "argument from authority is a fallacy" cannard, which neatly punctures Delingpole into the bargain.
(And just to be clear, an argument from authority is a logical fallacy. That is, the premises can be true and the conclusion false - even if it is just once in every billion times the argument is used. The argument from induction is likewise a logical fallacy. Indeed, it is impossible to draw any conclusion except in maths and logic without invoking a logical fallacy. The key question is whether the "logical fallacy" you invoke is inductively sound, ie, whether, of the premises are true there is a very high probability that the conclusion is also true.)
-
Tom Curtis at 11:34 AM on 7 March 2015Arctic sea ice has recovered
michael sweet @72, perhaps more interesting is the Cryosat data, which for the most recent update (Dec 15) showed reduced ice volume relative to 2013:
"Measurements made during October and November show that the volume of Arctic sea ice now stands at about 10 200 cubic km – a small drop compared to last year’s 10 900 cubic km."
At that time, Piomass was showing the ice volume to have been the largest since 2008, whereas Cryosat ranked it fourth in its five years of observation. The drop in volume relative to last year is more consistent with the sea ice extent figures, as linked by moderator PS:

-
Tom Curtis at 11:11 AM on 7 March 2015The oceans may be lulling us into a false sense of climate security
Here is the running 30 day SOI index:

Negative values indicate El Nino like conditions, while positive values indicate La Nina like conditions. Clearly, since July 2014 El Nino like conditions have prevailed, and by comparison with the SOI figures of 2010, you could argue that we have been experiencing an El Nino if you used SOI figures alone. However, the sudden rise to positive values call into question the continuation of those conditions. Such sudden changes often immediately reverse themselves, as in May 2013, or April 2014, but they can also be followed by a sustained reversal.
The SOI is a proxy for the strength of the trade winds, and we can now look at direct measurements of that strength. The BoM writes:
"Trade winds were weaker than average over the western half of the tropical Pacific for the 5 days ending 1 March (see map). A reversal of wind direction was seen in the far western tropical Pacific; westerly winds have been observed in parts of this area for about three weeks now. However, it is worth noting that westerly wind anomalies in parts of the western tropical Pacific sometimes occur during as a normal part of the breakdown of an El Niño.
Trade winds over the eastern half of the tropical Pacific were near average strength.
During La Niña there is a sustained strengthening of the trade winds across much of the tropical Pacific, while during El Niño there is a sustained weakening of the trade winds."(My emphasis)

The weakening, and even reversal, of the trade winds in the western tropical Pacific would weaken the Tropical Warm Pool as surface water flows east to the central Pacific. The continued strength of the trade winds in the eastern tropica Pacific, however, will prevent the warm water flowing further east, and the formation of a true El Nino.
This can be seen in the SST data:

There has been a marked warming in the Nino3 to Nino 4 region, but the rest of the tropical Pacific is neutral with respect to 1961-1990 average. Taking into account the effect of global warming, that means they are slightly cooler than we would expect. Crucially, that means while we currently have drier conditions for eastern Australia, as would be expected from an El Nino, we do not have a pool of warm water of the central American coast bringing wetter conditions there.
It is possible that the eastern Pacific trade winds could weaken, turning this into a true El Nino, but it is by no means certain. I think the BoM is right to be cautious. I also think looking at more data than just the SST in a single constrained region shows my distrust of such indices (ie, Nino 3.0, 3.4 and 4) is justified.
Unfortunately, the pages for the Multivariate Enso Index are currently down, so I cannot add them into the analysis.
-
John Hartz at 09:08 AM on 7 March 2015The oceans may be lulling us into a false sense of climate security
bill f:
Wili and I both documented that NOAA had declared an El Nino as also detailed in the following:
National Oceanic and Atmospheric Administration climate scientists reported the switch to official El Niño status in their latest technical bulletin on Thursday, and outlined their decision process in a blog post .
El Niño Has Arrived, and It Could Produce the Warmest Year on Record by Eric Holthaus, Slate, Mar 5, 2015
-
michael sweet at 08:24 AM on 7 March 2015Antarctica is gaining ice
Quantummist,
I posted a reply here where it is on topic.
-
michael sweet at 08:22 AM on 7 March 2015Arctic sea ice has recovered
Quantummist,
Your quote from NSIDC is interesting. I wonder why you picked a quote from Feburary 2014 istead of a more recent quote.
This years NSIDC report did not mention the CRYOSAT data. Nevin has a good article on the January 2015 PIOMAS data here. PIOMAS and CRYOSAT usually agree. The data does not really have anything unusual to report. Perhaps next week when the new PIOMAS data comes out it will be more interesting since, as the moderator pointed out, Arctic sea ice is currently at it's all time low for the date.
-
One Planet Only Forever at 08:11 AM on 7 March 2015The oceans may be lulling us into a false sense of climate security
billthefrog@8,
I share your understanding of the terminology. El Nino/La Nina conditions are the average surface temperature anomaly of the of the Nina 3.4 region. As indicated on the NOAA ONI history page we both linked to in our earlier comments, the anomaly is being measured against a 30 year average. And that 30 year average is updated every 5 years because the ocean has been warming. The NOAA ONI page includes a link to a page that presents how the 30 year average has increased. It also shows that the 30 year average is not just 'a temperature', the 30 year average that the anomaly is calculated from has a different value for each month.
So an El Nino condition occurs any time the Nino 3.4 region anomaly is 0.5 C or warmer (the term is probably even applicable when weekly average values are 0.5 C and above). And NOAA declares an El Nino event to have occured when a set of 5 consecutive 3 month averages of the Nino 3.4 anomaly, what they call the ONI, are 0.5 C or warmer.
The Australian Bureau of Meteorolgy definition of what constitutes an El Nino event may not be exactly the same. Their latest ENSO update here states there is a 50% chance of El Nino forming in 2015 even though by NOAA methods only one more month of warm enough waters would be needed for NOAA to declare that an El Nino event has occurred.
There is also a range of strengths of El Nino events and even the linking of the ocean surface temperatures to trade wind patterns that could spread the warming effect of air passing over the warmer ocean surface to other areas of the planet. And there is other Pacific Ocean surface anomalies like the current large warmer area off the west coast of N. America shown on the following Australian link that can occur without an El Nino event being declared.
It is very complex, but regardless of the potential variations of terminology there is no doubt that the warming due to excess CO2 from human activity continues to occur.
-
Quantummist at 05:42 AM on 7 March 2015Antarctica is gaining ice
In a statement issued on 5 February, the NSIDC said: “Preliminary measurements from the CryoSat show that the volume of Arctic sea ice in autumn 2013 was about 50% higher than in the autumn of 2012. In October 2013, CryoSat measured approximately 9,000 cubic kilometers (approximately 2,200 cubic miles) of sea ice compared to 6,000 cubic kilometers (approximately 1,400 cubic miles) in October 2012.”
Moderator Response:[PS] Please note that this topic is for discussion of Antarctic sea ice so arctic conditions are off topic. Also note that it is better to look at trends rather than short term variation though today's ice numbers are "interesting".
-
billthefrog at 05:12 AM on 7 March 2015The oceans may be lulling us into a false sense of climate security
@ John Hartz #6
Hi John,
On the Oceanic Nino Index page to which I linked in #5 (and unwittingly repeated in #7), it states that...
"For historical purposes cold and warm episodes (blue and red colored numbers) are defined when the threshold is met for a minimum of 5 consecutive over-lapping seasons"
I've always taken that to indicate the difference between el Nino conditions being met for some undefined transient period, and a formal el Nino declaration. (That's why the red/blue periods are always in groups of at least 5.
However, I was sure I had also read something to that effect elsewhere. The page I was trying to remember is here, and the relevant bit says...
"Niño 3.4 SST anomalies are averaged over the three months ending with the current month, and that value is called the Oceanic Niño Index (ONI). If the ONI exhibits warm or cool phase conditions for at least five consecutive values, it officially becomes an El Niño or La Niña event."
Obviously, if the basis of your understanding supersedes the above, then I stand corrected and humbly defer to you and Wili.
Either way, this is almost at the semantics level: I'm sure we all agree that it's on the cards - if not now, then next month.
cheers bill f (and apologies again for the inadvertent repetition)
Moderator Response:[PS] Fixes done as requested
-
Zeke Hausfather at 04:54 AM on 7 March 2015Understanding Time of Observation Bias
Slight error: the above figure is correct, but the TOBs corrections shown for USCRN are from midnight to 4 PM. All the TOBs corrections done to USHCN data are relative to a midnight observation time.
-
One Planet Only Forever at 04:53 AM on 7 March 2015The oceans may be lulling us into a false sense of climate security
The NOAA report indicates that current Nino 3.4 conditions are in the El Nino range. It also indicates the expectation is for low level El Nino conditions through 2015.
The NOAA report includes Figure 7 showing the ONI predictions of models (The NOAA ONI is the 3 month average of the Nino 3.4 region). Only a few models indicate the potential for a reasonably strong El Nino in 2014/15. Even the strongest model predicted event is significantly less than the magnitude of the 1997/98 event which had ONI peak values of 2.3 and 2.4 C as can be seen in the NOAA ONI value history here). Most models indicate a low level El Nino and a few indicate no El Nino.
The latest Australian summary of ENSO conditions here also indicates the expectation is only weak El Nino conditions to develop.
Modelling of long term generalized multi-year average climate conditions has been proven to be quite reliable (with the primary uncertainties being the actual impacts of things like how much excess CO2 will be generated), however, the accurate prediction by models of near term things like the ENSO is less 'reliable'. In spite of the variable success of near term prediction, in the big picture the average of the model predictions of many such potential climate related events is likely quite reliable. Said another way, if you looked at many years of predictions of the ONI the average predictions of all the models through all of the years would probably be seen to be quite reliable, even though specific years could be found where the outliers among the predictions were the ones that got 'that year right'.
So, for a strong El Nino event to develop in 2015 an outlier model prediction would need to be the correct one, which has a low likelihood of occurring, but such unlikely events can still be what happens.
What exactly will happen in the near term can be quite uncertain and is best forecast by "Wait and see", even though what will happen long term, in the averages of many years, is able to be quite reliably predicted.
-
Zeke Hausfather at 04:40 AM on 7 March 2015Understanding Time of Observation Bias
The folks at WUWT provide a critique of TOBs adjustments today that, ironically, provides a pretty good validation for those adjustments. They compare the Kingston USHCN station to a nearby pristinely sited USCRN station. The Kingston station had its time of observation shifted from 9 PM to 4:30 PM. If we do the same shift to the hourly Kingston CRN data, we get quite similar results:
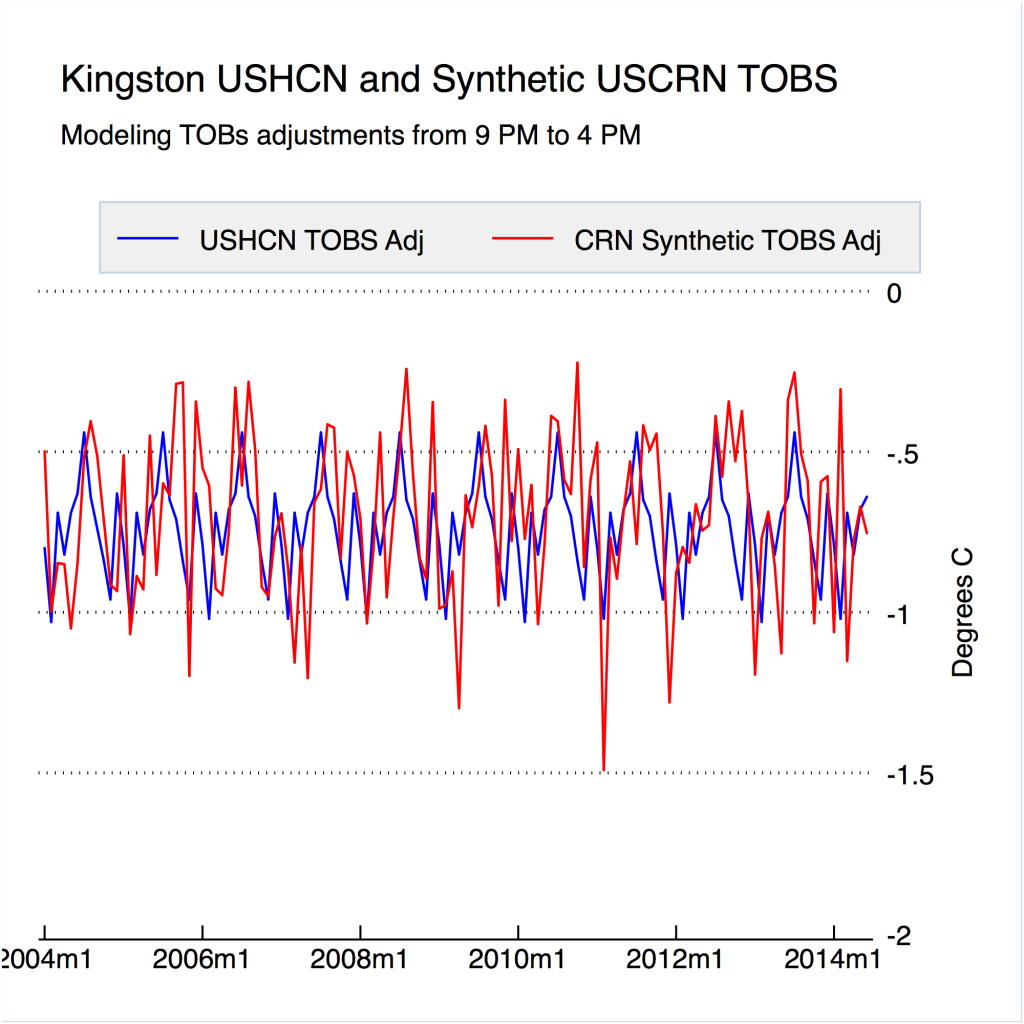
Over this period, the mean USHCN Kingston TOBs adjustment is -0.74
The "correct" TOBs adjustment based on the USCRN Kingston station is: -0.70Moderator Response:[RH] Adjusted image size. Please try to keep your images limited to 500px wide.
-
John Hartz at 04:15 AM on 7 March 2015The oceans may be lulling us into a false sense of climate security
bill f: I do believet hat wili is correct...
Just when everyone had pretty much written it off, the El Niño event that has been nearly a year in the offing finally emerged in February and could last through the spring and summer, the National Oceanic and Atmospheric Administration announced Thursday.
This isn’t the blockbuster, 1998 repeat El Niño many anticipated when the first hints of an impending event emerged about a year ago. This El Niño has just crept across the official threshold, so it won’t be a strong event.
“We’re basically declaring El Niño,” NOAA forecaster Michelle L’Heureux said. “It’s unfortunate we can’t declare a weak El Niño.”
After Much Ado, El Niño Officially Declared by Andrea Thompson, Climate Central, Mar 5, 2015
-
billthefrog at 02:58 AM on 7 March 2015The oceans may be lulling us into a false sense of climate security
Hi Wili,
I think you will be proven correct, but you're slightly premature at the moment.
The key phrase to look out for is "el Nino conditions".
For an el Nino to be declared, the 3-month rolling average has got to be 0.5oC (or more) up on climatology for at least 5 consecutive periods. The last 5 such periods were as follows...
ASO(+0.2) SON(+0.5) OND(+0.7) NDJ(+0.7) DJF(+0.6)
We therefore need to wait for the March numbers, but - assuming I've got my sums right - unless the monthly anomaly drops to below about +0.2oC, then the 3-month JFM figure should be at least +0.5oC (with rounding).
The rolling-3 figures are given here.
cheers bill f
-
hank at 02:52 AM on 7 March 2015The oceans may be lulling us into a false sense of climate security
> potential for a strong El Nino developing this year too.
Did you mean to quantify that as "low potential for a strong ..."?
I haven't found an agency suggesting a strong El Nino is at all likely.E.g. http://www.realclimate.org/index.php/archives/2015/02/climate-oscillations-and-the-global-warming-faux-pause/comment-page-3/#comment-626577
Moderator Response:[Rob P] - Don't have much time to explain at the moment, but I'm writing a series on the Interdecadal Pacific Oscillation (IPO) which ties into this.
You are, however, misinterpreting what I have written. The potential for a strong El Nino exists because the southern hemisphere subtropical cell and subtropical ocean gyre circulation have spun down, unlike last year where the trade winds were persistent south of the equator. There is a greater potential for the current Kelvin wave to cross the Pacific and not be weakened by the subtropical cell and South Equatorial Current pumping heat out of the tropics - thus encouraging atmospheric reinforcement.
This doesn't mean we are due for a strong El Nino, merely that underlying oceanic conditions are more conducive to such. The situation could quickly change. As ever, I keep a beady eye on the situation.

-
hank at 02:48 AM on 7 March 2015The oceans may be lulling us into a false sense of climate security
Typo alert for the main article above:
"continued warming of the plant"
Prev 606 607 608 609 610 611 612 613 614 615 616 617 618 619 620 621 Next


