


 Arguments


Richard Tol accidentally confirms the 97% global warming consensus
Posted on 4 June 2014 by dana1981
An updated version of this post has been published at The Guardian

“There is no doubt in my mind that the literature on climate change overwhelmingly supports the hypothesis that climate change is caused by humans. I have very little reason to doubt that the consensus is indeed correct.”
These are the words of economist and Global Warming Policy Foundation advisor Richard Tol in a new paper published in Energy Policy. Despite accepting that the expert consensus on human-caused global warming is real and correct, Tol has nevertheless spent the past year trying to critique the study the Skeptical Science team published last year, finding a 97% consensus in the peer-reviewed climate literature.
The crux of Tol's paper is that he would have conducted a survey of the climate literature in a slightly different way than our approach. He's certainly welcome to do just that – as soon as we published our paper, we also launched a webpage to make it as easy as possible for anyone to read the same scientific abstracts that we looked at and test the consensus for themselves.
Tol chose instead to look for faults in our study's methods in what he described as a "destructive" approach. Ultimately he concluded that because those who were categorizing the abstracts based on their position on the cause of global warming were human, our ratings were imperfect (this is certainly true), and that accounting for these imperfections brings the consensus value down to about 91%. That's where Tol made his big mistake.
Tol's big mistake
To minimize our uncertainties, we had at least two people categorize each scientific abstract. Where those two raters disagreed, we had a reconciliation process. The disagreeing raters first checked their ratings again; if the disagreement persisted, a third person acted as the tiebreaker to establish the final rating.
Using the difference between our initial and final ratings, it's possible to estimate the number of papers that still remain in the improper categories after our reconciliation process. Tol put the estimate at about 6.7% of the total, and noted that 55% of our reconciliations from initial to final ratings were 'towards stronger rejection', while 45% were 'towards stronger endorsement' of human-caused global warming.
Tol then made a basic and critical error. His methodology resulted in assumptions that, for example, 55% of the remaining incorrectly rated 'no position' category papers should actually be rejections, while 45% should be endorsements. He didn't check to see how the reconciliations changed the initial and final ratings for each category, and this assumption led him to incorrectly conclude the consensus is actually 91%. Still a high percentage, but nonetheless in error.
In reality, as our response to Tol's critique (accepted by Energy Policy but not yet published) shows, there simply aren't very many peer-reviewed papers that minimize or reject human-caused global warming. Most of the papers that were reconciled 'towards stronger rejection' went from explicit to implicit endorsement, or from implicit endorsement to no position. For abstracts initially rated as 'no position,' 98% of the changes were to endorsement categories; only 2% were changed to rejections.
That makes sense when you think about it, because less than 3% of all climate papers reject or minimize human-caused global warming. There's no reason to expect 55% of incorrectly rated 'no position' papers to reject the consensus – in reality there just aren't that many rejection papers. I asked Tol about this point, and he responded,
"I indeed use the marginal distribution of error corrections rather than the conditional ones. There are not enough observations to estimate all the conditionals."
However, the 'no position' category was the largest in our sample, and was the main source of Tol's mistaken calculation, as shown in the figure below. The top frame illustrates the result when calculation is done correctly using the actual reconciliations for each category, while the bottom frame shows the result using Tol's faulty assumptions.
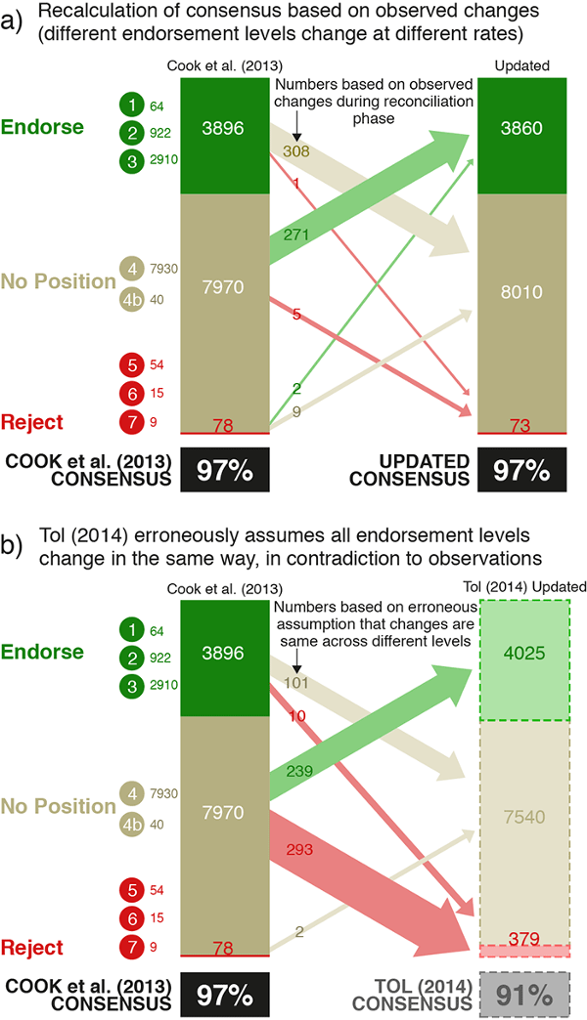
Recalculated consensus based on actual paper reconciliations (top frame), and based on Tol's erroneous assumptions (bottom frame)
An anonymous individual has also published an elegant analysis showing that Tol's method will decrease the consensus no matter what data are put into it. In other words, his 91% consensus result is an artifact of his flawed methodology.
Pulled from thin air
As the above figure illustrates, by making this mistake, Tol effectively conjured approximately 300 papers rejecting or minimizing human-caused global warming out of thin air, with no evidence that those papers exist in reality. As a result, his consensus estimate falls apart under cursory examination. Ironically, when discussing our study in a US congressional hearing last week, Tol claimed,
"...as far as I can see, this estimate just crumbles when you touch it ... this 97% is essentially pulled from thin air."
When our team corrected for Tol's error, accounting for the ways in which the reconciliation process actually changed the ratings for each category, we found a slight increase in the consensus, from an initial 97.1% to a corrected 97.2%. Accounting for the uncertainties involved, we ultimately found the consensus is robust at 97 ± 1%.
It's also important to remember that our finding of 97 ± 1% consensus in climate research abstracts is consistent with the scientist author paper self-ratings in our study (97.2%), Doran & Zimmerman's 2009 study (97%), the Anderegg et al. 2010 study (97.5%), Oreskes' 2004 study (zero abstracts rejecting human-caused global warming in a sample of 928 papers), 80 National Academies of Science and dozens of scientific organizations from around the world endorsing the consensus (none rejecting it). And of course Richard Tol acknowledges it,
"Published papers that seek to test what caused the climate change over the last century and half, almost unanimously find that humans played a dominant role."
"The consensus is of course in the high nineties"
This is an important point, because a new George Mason University report finds that only 12% of Americans are aware that more than 90% of climate scientists have concluded humans are causing global warming. Ironically, even Tol's flawed critique finds the consensus is higher than 88% of Americans believe.
Another Gremlin infestation?
Tol nevertheless tried to find fault in our approach, and as a result submitted a flawed paper. In addition to making several basic errors, Tol cited numerous denialist and GWPF blog posts, including several about material stolen from our team's private discussion forum during a hacking. Similar to the Climategate incident, Tol even took quotes out of context from the hacked discussions to try and invent evidence of 'rater fatigue' among our team where no such evidence exists (we rated papers at our own leisure without any set deadlines).
The flaws in his critique are reminiscent of Tol's recent corrections to errors in his climate economics research, where he explained, "Gremlins intervened in the preparation of my paper." Perhaps the Gremlins struck again.
One might wonder how Tol's critique made it through the peer-review process with so many serious flaws. It took five tries, as the paper was first rejected four times by three other journals. He received some harsh but fair criticism from the Environmental Research Letters reviewers, who listed 24 problems and ways the paper could be improved. When I asked Tol about these critiques, he told me, "I incorporated all comments by ERL that hold water."
However, a side-by-side comparison reveals that Tol's Energy Policy paper still contains nearly all of the shortcomings identified by the Environmental Research Letters reviewers, plus some new ones. Our team's critique of Tol's paper identified several of the same problems as the Environmental Research Letters reviewers and many more – some they didn't catch and some that Tol added to the Energy Policy version – again, 24 in total.
In any case, Tol's critique explicitly acknowledges the expert consensus on human-caused global warming is real and accurate. Correcting his math error reveals that the consensus is robust at 97 ± 1%, consistent with the results of previous consensus studies.
While the consensus may be an inconvenient truth for those who seek to obstruct and delay the implementation of global warming solutions, it's nevertheless an indisputable reality; one we'd be better off if people learned to accept.


Basically, it seems to me that Dr Tol doesn't really dispute the existence of the scientific consensus (either in the form of consilience of evidence or the form of consilience of opinion of practicing scientists).
It appears, rather, that he wants to take down Cook et al because... well, because reasons. (At least that is the best I can come up with.)
He wants to take Cook et al. down, but he failed miserably. His error couldn't be more obvious - he created about 300 rejection abstracts out of thin air from a claimed 6.7% error rate, when in the entire sample we only found 78 rejection papers. This has been explained to Tol several times using several different methods, and he still can't seem to grasp it.
It's astonishing that Energy Policy's "review" apparently didn't ask for a single example of the ~300 gremlin-conjured rejection abstracts.
"If I submit a comment that argues that the Cook data are inconsistent and invalid, even though they are not, my reputation is in tatters." [Dr. Richard Tol, 2013-06-11]
Not necessarily. Retracting errors is difficult but ultimately helps one's inner peace and reputation because it shows integrity and healthy confidence. When in a hole, stop digging.
I notice that the list of 24 errors by Tol is not exhaustive. In section 3.2 "signs of bias", Tol writes:
In fact, there were not 24,273 abstract ratings (strictly abstract rating records) released to Tol, but 26,848. They are the records of all first ratings, second ratings, review ratings and tie break rating generated for the 11,944 abstracts rated for the paper. That Tol dropped 2,573 ratings records from his analysis is neither explained nor acknowledged in the paper. That is clearly an additional (25th) error, and appears to go beyond error into misrepresentation of the data and analysis.
Paranthetically, Tol is unclear about that number, claiming that "Twelve volunteers rated on average 50 abstracts each, and another 12 volunteers rated an average of 1922 abstracts each", a total of 22,464 abstracts. That is 1,424 less than the total of first and second ratings of the 11,944, and is too large a discrepancy to be accounted for by rounding errors. He also indicates that abstracts were rated on average 2.03 times, yielding an estimate of 24,246 abstracts. That is within rounding error of his erroneous claim of 24,273 ratings, but inconsistent with his estimate of the number of ratings by volunteers and the actual number of rating records.
Some clarrification of why Tol inlcuded only 24,273 ratings is found in his blog, where he describes the same test as used in the paper, saying:
The initial ratings are the first and second rating for each abstract, of which there are 23,888. However, comparison of the 100 point average of the mean value with S6 from the paper shows the test to have been the same. A problem then arises that his graph of "initial ratings" is not restricted to just first and second ratings. Consider the following figure:
The middle graph is Tol's figure S6 as displayed at his blog. The top graph is the 100 point mean of all endorsement_final ratings from the rating records (the values actually graphed and analysed by Tol). As can be seen, Tol's graph is clearly truncated early. The third graph is the 100 point mean values of enfdorsement_final ratings from all first and second ratings. Although identical at the start of the graph (of logical necessity), the end of the graph diverges substantially. That is because the first 24,273 ratings in chronological order do no included all first and second ratings (and do include a significant number of third, fourth and fifth ratings ie, review and tie break ratings). So, we have here another Tol mistake, though technically a mistake in the blog rather than the paper.
Far more important is that without strictly dividing first ratings from second ratings, and excluding later ratings, it is not possible for Tol's analysis to support his conclusions. That is because, when selecting an abstract for a rater to rate, the rating mechanism selected randomly from all available abstracts not previously rated by a particular rater. Initially, for the first person to start rating, that meant all available abstracts had no prior rating. If we assume that that person rated 10 abstracts, and then ceased, the next person to start rating would have had their ratings selected randomly from 11934 unrated abstracts, and 10 that had a prior rating. Given that second ratings were on average slightly more conservative (more likely to give a rating of 4) than first ratings, this alone would create a divergence from the bootstrapped values generated by Tol. Given that raters rated papers as and when they had time and inclination, and that therefore they did not rate at either the same pace or time, or even at a consistent pace, the divergence from bootstrap values from this alone could be quite large. Given that raters could diverge slightly in the ratings they give, there is nothing in Tol's analysis to show his bootstrap analyses are anything other than the product of that divergence and the differences in rating times and paces among raters. His conclusions of rater fatigue do not, and cannot come from the analysis he performs, given the data he selects to analyse.
This then is error 27 in his paper, or perhaps 27-30 given that he repeats the analysis of that data for standard deviation, skewness and autocorrelation, each of which tests is rendered incapable of supporting his conclusions due to his poor (and mistated) data selection.
In the OP it is stated:
I assume that error margin is based on the uncertainties arising from an analysis of internal error rates (such as used by Tol, and done correctly in the section with the quote). As such it does not include all sources of error, and cannot do so. It is possible, for example, that the raters displayed a consistent bias which would not be detected by that test. Thus that statement should not be interpreted as saying the consensus rate lies withing 96-98% with 95% probability, but that certain tests constrain the 95% probability range to not be less than that. Allowing for all sources of potential error, it is possible that the actual consensus rate may even be in the low 90 percents, although it is likely in the mid to high 90 percents.
Tom, we used several methods to estimate the error. Using Tol's approach it's ± 0.6 or 0.7%. Individual rater estimates of the consensus varied by about ± 1%. Hence that's a conservative estimate. As you know, our approach was quite conservative, so if anything we may have been biased low. However, there's not much room above 97%.
I'm not sure if this is actually covered in previous addressings of Tol's analysis as I am skim-reading this during my lunch break, but I have an issue with his implicit assumption that the causes for categorisation discrepancies in those papers where the scorers initially disagreed, are present at the same statistical distribution within the population of papers where there was initial concordance.
By the very nature of the scoring process the more ambiguous categorisations would 'self-select' and manifest as discordances, leaving those initial concordances more likely to be so than if the whole population was retested blind.
Tol appears to be making assumptions of homogeneity where there is quite probably no basis for such. And inhomogeneity is a significant modifer of many analytical processes.
Dana @6, thankyou for the clarrification.
One thing detailed analysis of the data shows is a very slight, but statistically significant trend towards more conservative ratings in both first and second ratings. The trend is larger in first ratings. That can be construed as an improvement in rating skill over time, or a degradation of performance. The former is more likely given that third and later ratings (ie, review and tie break ratings) also tended to be more conservative than initial ratings. It may also be an artifact of relative number and time of ratings by individual raters, given that they rated at different rates. So, first, have you tested individual raters results to see if they show a similar trend? And second, does your error term include allowance for this trend either as a whole, or for individual raters?
More generally, I think a similar rating excercise to that in the Consensus Project carried out by raters exclusively recruited from WUWT would generate a substantially different consensus rate to that found in Cook et al (2013). We only need look at poptech's contortions to see who willing pseudoskeptics are to distort their estimates. They do not do such rating excercises (or at least have not till now) because even with that massive bias they will find well over 50% endorsement of the consensus, and likely well over 80% which would demolish their line about no consensus and potentially undermine the confidence of raters too much. Or at least that is what I believe. The crucial point, however, is such a general bias among raters will not show up in internal consistency tests such as used by Tol, and as I understand, by you, to determine the error rate.
Being objective, we must allow at least the possibility of equivalent pervasive bias by the SkS recruited rates used for Cook et al. I think there is over whelming evidence that we are not as biased as a similar cadre from WUWT, but that does not mean we are not biased at all. Such general bias within the raters cannot be tested for by internal estimates of error or bias. They can be partly tested for by external tests such as comparison with the self ratings, but there are sufficient confounding factors in that test that while we can say any such bias is not large, we cannot say it does not exist. It is because of the possibility of this bias (more than anything else) that leads me to reject a tightly constrained error estimate (+/- 1%).
Tom@8,
How do you reconcile your opinion that "pervasive bias by the SkS recruited rates" may have inflated the results the Cook 2013, with the fact that scientists' self rating confirmed the Cook 2013 findings at even higher (98%+) rate? Shouldn't we rather conclude from that confirmation, that Cook 2013 findings are more likely biased low, rather than high as you suggest?
[DB] Fixed text per request.
So... even with numerous mathematical errors, blatantly false assumptions, and generally slanting things to the point of absurdity... the 'best' Tol could do was claim that there is 'only' a ninety-one percent consensus?
You've got to wonder what keeps them going... even when their own best spin proves them wrong they still just keep right on believing the nonsense.
Tom,
Additional very strong constraints can be placed on possible bias in the SkS raters. Since the authors of the paper set up a web site (referenced in the OP) that allows individuals to rate abstracts, lots of people have presumably rated papers. Skeptics could easily search for papers from people like Spencer, Lindzen or Poptech's list to find misrated papers. In addition, authors like Spencer who are skeptical could bring attention to their misrated papers. Dana could correct me, but I have only seen reports of less than 5 such misrated papers that have been found . About 30 are needed to lower the consensus to 92%. Tol found zero papers. It seems to me unlikely that enough papers have been misrated to lower the consensus even to 92% with so few misrated papers found by those skeptics who have searched. I will note that in his congressional testimony Spencer said that he was part of the consensus. Presumably that means his papers had been misrated as skeptical and should be subtracted from the skeptical total.
I think you are making a maximum estimate of error and underestimating the efforts by the author team to check their ratings.
Chriskoz @9, the author ratings are drawn from a subset of the papers which had an abstract rating, and that subset is not representative in that it is heavilly weighted towards more recent papers. Further, authors had access to far more information (the complete paper plus their known intentions) than did abstract raters. Further, author ratings may have been self selected towards people with stronger views on AGW, either pro or anti or towards both extremes. Finally, authors may have been more confused about interpretation of the rating criteria than abstract raters, who had the advantage of more copious explanation through the ability to direct questions to the lead author, and discuss the responses. It is also possible that author raters are biased against endorsement due to scientific reticence, or that abstracts are biased with respect to papers in terms of rejections due to "skeptical" scientists deliberately keeping abstracts innocuous to ensure publication of conclusion portrayed as rejecting AGW either in brief comments in the conclusion, or in press releases. Together these factors make direct comparison of author and abstract ratings difficult, and not susceptible to precise conclusions.
One of those factors can be eliminated with available data by comparing author ratings with only those abstract ratings on papers that actually recieved an author rating. If we do so we get the following figures:
_________Abstract__Author
endorse___787_____1338
neutral___1339______759
reject______10_______39
Reduced to percentage terms, that represents a 98.75% endorsement rate among the subset of abstract ratings also rated by authors, and 97.17% endorsement rate among the corresponding author ratings. The simplest interpretation would be that the abstract raters demonstrated a 1.6% bias in favour of endorsements, and a 125.7% bias against rejections. I would reject such an interpretation as too simplistic, ignoring as it does the other confounding factors. However, a small abstract rating team bias in favour of endorsements is certainly consistent with these results. Thus, the abstract rating team may have been biased in favour of endorsements. (Given available evidence it may also have been biased against endorsements as well, although with far less probability.)
This in no way invalidates the author ratings as confirming the basic result of the abstract ratings, ie, a endorsement rating relative to endorsements and rejections >95%. The results give that value no matter how you slice it. But that should not be interpreted as confirmation of the precise figure from the abstract ratings (98%), or even confirmation of that figure within +/- 1%. Finally, even though the author ratings confirm a >95% figure, that does not preclude uncertainty from allowing realistic probabilities for values below 95%. After all, emperical "confirmations" are falsifiable and the next study from impeccable sources may turn up a lower percentage.
michael sweet @11, Cook et al found 3896 abstracts endorsing the consensus and 78 rejecting it, and endorsement rate of 98% (excluding abstracts indicating no opinion, or uncertainty). To drop that endorsement rate below 95% requires that 121 abstracts rated as endorsing the consensus be rerated as neutral, and 121 rated as neutral be rerated as rejecting the consensus. If more endorsing abstracts are rerated as neutral, fewer neutral abstracts need be rerated as rejecting to achieve so low a consensus rating. If endorsing abstracts are reduced by 40%, no increase in rejecting abstracts is needed to reduce the consensus rate to 95%. (You will notice that pseudoskeptics do spend a lot of time trying to argue that endorsement is overstated ;))
Anyway, the upshot is that I agree that a large bias by the SkS rating team is extraordinarilly unlikely. Never-the-less, even a small bias coupled with other sources of error could lift an actual consensus rate from just below 95% to 97% with relative ease, both by inflating the endorsement papers and simultaneiously deflating rejection papers. For instance, taking the prima facie bias shown by comparison with author ratings (discussed above), and correcting for it in the abstract ratings drops the endorsement ratings to 3834, while lifting the rejection papers to 176, giving an endorsement percentage of 95.6%. Dropping another 1% due to "uncertain" papers, and 0.5% due to other error factors brings the consensus rate down to 94.1%. As previously stated, I do not think the prima facie bias shown in the author comparisons should be accepted at face value. There are too many confounding factors. But we certainly cannot simply exclude it from the range of possible bias effects.
As the range of uncertainty I allow, I work in units of 5% because the uncertainty is too poorly quantified to pretend to greater precision (with exception of error due to internal rating inconstency which has now been quantified by Cook and co authors). I extend the range of plausible consensus ratings down to 90% because in calculating the effects of numerous skeptical and pseudo-skeptical objections, I have never come up with a consensus rating lower than 90%; and I think it is unlikely (<33% subjective probability) to be below 95% because of the size of the biases needed to get a consensus rate less than that. I think it is important to be aware, and to make people aware of the uncertainty in the upper range (95-99%) so that they do not have an unrealistic idea of the precision of the result, and of the unlikely but possible lower range (90-95%) so that people are aware how little significance attaches to the obssessive attacks on the concensus paper result, very well summarized by CBDunkerson above.
Terrific analysis. This is not denial, rather this is displacement or distraction. Argumentation by written hand waving.
If we assume the paper authors accurately categorized their own research, the fact that our abstract ratings arrived at the same result (97%) is another strong indication that we did not introduce any significant bias.
As I noted, we were very conservative in our approach, tending to err on the side of 'no position' or 'rejection' where possible. Again, if anything our estimate was probably biased low, but the fact that it matches the author self-ratings adds confidence that our result was pretty darn accurate. It's certainly not wrong by several percent.
Despite the broad agreement between the abstract analysis and the author self-rating survey and C13 with previous studies, there remains the possibility that the SkS abstract raters introduced a systematic bias. The only definitive way to test for this is for more "skeptical" raters to repeat all or part of the abstract analysis.
They can easily do this, using the online tool that is provided here, or doing their own study. It is a pity that nobody has tried this yet, obviously, it's not something any of us can do.
In reality, all of the raters in the TCP study were aware of this potential source of bias and made efforts to be as impartial as possible. For that reason, I doubt that different raters would get substantially different results. I suspect that many of our critics know this too.
A shortcut for our critics would be to identify the rejection abstracts that we missed, there's no need to look at the rest of the database. There are long lists of rejection papers on the internet and thse could be used to search for them in our sample. If our critics could show that, say, we missed or misapplied the ratings for 300 rejection abstracts, then Professor Tol would be vindicated. It shouldn't be that hard to do. Our paper is easy, in principle, to falsify. The fans of Karl Popper should be pleased.
Tom: I just tried the naive test and set up a matrix of p(self|abstract), multiplied this by n(abstract) to get an estimate for n(self) for the whole dataset. If I haven't made any mistakes (I only spent 10 mins on it), it looks like this:
1806.6 4435.8 4014.7 1337.4 217.2 60.6 71.7
That's a consensus score of 96.7%. Most of the neutrals have gone one way or the other, so there are both more endorsements and more rejections.
I had to drop multiple self ratings with fractional scores. There will be a few more multiple self ratings which lead to integral scores which should also be dropped. Better, all the self ratings should be included weighted according to the number of self ratings for the paper. The TCP team should have the data to do this.
I also added 1 extra count in each diagonal self=abstract category to address the lack of self ratings for papers starting at 7. This will have no discernable effect on the heavily populated endorsement and neutral categories but tends to ensure that rejections stay as rejections. Increasing this number to 10 or 100 doesn't affect the result.
There are only 6 rejection papers with integral self-ratings which leads to potentially large uncertainties, but I think that is addressed in a conservative manner by inflating the diagonal elements. An unquantifiable but probably bigger uncertainty will arise from self selection of respondents.
(Apologies to anyone who has done this before - I have a feeling I may have seen it somewhere.)
Oh, it was in the original paper. Ignore me...
Kevin C @18 & 19, first, I have never found it profitable to ignore you.
Second, simply multiplying abstract ratings by the ratio of author ratings to their corresponding abstract ratings will simply reproduce the author rating percentages. Doing so thereby assumes that the rate of endorsement did not increase in time (given the temporal bias in author ratings). It also assumes that the massive difference in neutral ratings between author ratings and abstract ratings is simply due to conservatism by abstract raters. If instead we assume it is mostly due to the lack of information available in abstracts (almost certainly the primary reason), then we should require neutral ratings to be almost constant between the abstract ratings and abstract ratings adjusted for bias relative to author ratings. The prima facie adjustment I used makes that assumption and only multiplies endorsements or rejections for their relative bias ratios, thereby keeping neutral ratings constant.
I am not arguing that that is the uniquely correct approach. I am arguing that it is a reasonable approach, and hence that reasonable assessments of the biases allow endorsement percentages below 95% with reasonable though low probability.
Third, if you are using the values from Richard Tol's spreadsheet (as I am at the moment due to lack of access to my primary computer), you should note that the itemized values (ie, totals for ratings 1 through 7) do not sum to the same values as the summary values (ie, binned as endorsing, neutral or rejecting) in his spread sheet. Further, the itemized values do not have the same totals for abstract ratings and author ratings. Using the summary values, and applying your method, the endorsement percentage is 95.6% excluding all neutral papers, and drops to 95.3% if we include 0.5% of neutral papers as "uncertain".
I am most appreciative of the link to data for the monumental literature review that has become popularly known as the “97% consensus. “ I have no qualms with the analysis as presented by Cook et al., but given data I cannot resist applying my own analysis to see what other inferences may be drawn upon it.
My method was to first reduce the data to include only abstracts that somehow endorse or not AGW. Then, in order to statistically summarize individuals instead of articles, I created a database by individual Author and Title, and carrying through the Date, Category and Endorsement values. In this way I was able to identify the endorsement of individuals, and could eliminate duplicate counting due to multiple titles by the same author. This approach produced about 13,500 unique Author-Titles in my dataset.
Thus, I am able to make the following inference:
A literature survey of peer-reviewed articles published in the 20 year interval of 1991 through 2011 reveals that one-third of about 12,000 abstracts considered made some pronouncement on global warming. Of these, 73 titles generated by 188 authors quantify the human impact on the observed global warming as either being greater or less than 50%.
This is a highly qualified but strong assertion, and is but one of many that can be gleaned from the data provided.
MThompson @20, it is well known (and noted in Cook et al, 2013) that only a third of abstracts endorse or reject explicitly or implicitly that 50% plus of recent warming is due to anthropogenic factors. Even lower rates of physics papers discussing gravity will note in their abstracts that g is approximately equal to 9.8 m/s^2 for the obvious reason that what is uncontroversial (in science) and not novel does not get noted in summaries of the important findings of a paper (abstracts), except occasionally and in passing.
It is also well known and largely irrelevant that there were only 73 abstracts endorsing or rejecting that 50% or more of recent warming is due to anthropogenic factors (ie, those falling in rating categories 1 and 7).
What is not clear is why you think it is important to mention these largely irrelevant facts. Particularly in such an obscure manner. It is almost as though you are trying to stealth in some denier talking points without having to defend the imputation that they somehow undermine the overwhelming evidence that acceptance among climate scientists of the fact that 50% plus of recent warming is anthropogenic in origin.
Mr. Curtis, thank you for your thoughtful consideration of my comment numbered 18. It is true, as you have so alluded, that a survey of abstracts is insufficient to extract determinations that may be presented in the bulk of the published work.
I most fully appreciate your comparison to the abstracts referencing values for the acceleration of gravity. The approximation you cited has been used successfully over the centuries for military ballistics and engineering. The notion that there exists a force of gravity is the consensus of scientists and of educated people across the globe. Newton’s theory of gravitation is in fact so successful that it has been elevated to “Newton’s Law of Universal Gravitation.” Yet two hundred years after his teachings A. Einstein proffered a theory that states the force of gravity does not even exist. Despite this, the consensus persists and is so ingrained in our knowledge that it may be held by the vast majority for centuries.
Dispensing with these pleasantries, Cook et al. rightfully state in their abstract: “Among abstracts expressing a position on AGW, 97.1% endorsed the consensus position that humans are causing global warming.” As stated previously, I have no qualms with this conclusion or characterization. Furthermore, any tacit agreement tortured from my commentary is not accidental.
If I must be plain, the method of my analysis to identify the endorsement of individual authors is to highlight the common mischaracterization of Cook et al. as “Over 97 percent of scientists agree …” This kind of irresponsible trivialization grates on me. I am similarly displeased when people breathlessly report another year (month, day, hour?) of “global warming hiatus” or “This September’s sea ice coverage.” Many readers of this auspicious blog are likely troubled by such bastardization of global climate change theory as well.
As scientists we must not be seduced by notoriety and politics. Solid science is the way to educate the public about global warming and climate change. Every time a blog shows clouds of steam emanating from a cooling tower in a popular story about pollution, and every time a television anchor cites a particular storm’s ferocity, science looses esteem. If we remain silent when such egregious errors agree with our opinions, what have we become?
I have found yet another error by Tol, although this one is not as convenient. As part of his analysis, Tol found a final error rate of 6.7% That is based on the 33% disagreement rate (D) after initial ratings as stated in Cook et al (2013). In essence he calculates an individual error rate (i), such that
D= 2i-i2/6
He divides by six because there are six possible categories that an error might fall into, a procedure that assumes that all errors are equally probable. Of course, not all errors are equally probable. In fact, almost all errors are just one category greater or smaller, so that a better approximation would be given by:
D= 2i-i2/2
A slightly better approximation is given by:
D= 2i-A*i2
where A is the sum of the squares of the average probabilities for errors by difference from the correct value as given in Tol's graph S20. It turns out that A is 0.525514. That reduces theindividual error rate to approximately 17.3%, but increases the final error rate to 7.28% due to an increased rate of undetected errors from initial rating. An even more accurate estimate could be made allowing for the differences in probable errors for different endorsement ratings, but I doubt the difference would be sufficiently large to make a substantial difference.
I strongly suspect it makes no substantial difference to the correct analysis of probable errors using this higher error rate. Never-the-less, I would be interested in seeing the results of such a re-analysis if any of the authors of the response to Tol would be willing to plug the values into their algorithm.
As many of you know, an anonymous person identifying themselves as "A Scientist" has written an critique (PDF) of Tol (2014). A Scientist indicates the anonymitty is due to Tol's vituperative and bullying responses to those having the temerity to criticize his work. The criticism is interesting, and seems valid in principle, but unfortunately is marred by some errors. I have yet to determine if it stands up after those errors are corrected for. (Neal King of SkS has corrected all bar one of the errors, and shown that apart for that one error the analysis is sound after correction.)
In looking at that critique, I have noticed that there is a simpler means to show that Tol's method, and in particular his error correction matrix, is nonsense. Tol assumes two things - that all endorsement levels (1-7) have the same error rate, and that the ratios among possible errors are constant regardless of the endorsement category, and are given by the ratios of average errors over all the data. The interesting thing I noticed is that by assuming that, he predicts that the forward error rate varies greatly between endorsement values. In fact, he predicts the following error rates:
1: 35.61%
2: 10.36%
3: 8.56%
4: 1.36%
5: 84.69%
6: 62.94%
7: 29.51%
That is, he predicts that just 1.36% of papers that actually had neutral abstracts were rated as something else by the Cook et al, 2013 (C13) rating team; but that 84.69% of papers with abstracts that actually implicitly rejected AGW were mistakenly rated as something else. But not only that, he also predicts that these massively disparate forward error rates were somehow coordinated such that the each category as reported in the paper would have just 6.67% errors.
Such a feat would require extraordinary precision in the "errors" purportedly made, and all without coordination or prearrangement. The notion that such precision errors could arise by chance is laughable. Coordination or prearrangement is ruled out not just by the known facts pf what was done but also by the sheer pointlessness of coordinating errors to achieve the same final error rates in all categories. The hypothesis that predicts this precision error production is therefore, laughable.
When it is realized that the evidence in support of this absurd result is a simple mathematical fallacy, ie, that the product of the means will equal the mean of the products, you have to wonder why Tol persists in defending this absurdity. It is as though he wants the world laughing not only at his blunder, but at him as well.
Despite the recent news on Tol's comments, the Weekend Australian 7/8 June went ahead with a news item "Doubts on climate consensus" quoting an earlier position by Tol as if the news did not exist. It appears that the Australian deliberately distorts news items on global warming issues. The Australian, our "authoritative" national daily, appears to have a policy of negatively influencing decision makers on carbon mitigation strategies. Such a stance supports deliberate misinformation put out by our prime minister - quoted this morning as stating that carbon trading schemes are being discarged internationally when in fact this is a direct denial of World Bank reporting the opposite that eight new carbon markets had opened last year. Although appearing in the West Australian, this item would never appear in the The Australian . The Murdoch mob can only be regarded as basically evil, note their top brass facing criminal charges in the UK.
RobH@25,
The Australian's report, technically does not need to pay attention to the news in blogosphere, when it wants to report on verified, peer reviewed publications only. And that is the current state of C13 critique: Tol 2014 comment is an accepted, verified article; whereas all subsequent critiques of Tol 2014 are unverified rumours. In particular, Tol's critique herein, has been "accepted by Energy Policy but not yet published". When is it going to be published? Then, you'll be technically rightful in your statement that: "the Australian deliberately distorts news items".
chriskoz @26, The Australian does not need to pay attention to the blogosphere, but in principle they do need to adhere to the Press Council standards. In particular, they need to ensure that their reporting satisfies the first standard:
At a minimum, balanced reporting would require at least contacting the lead author of the study criticized by Tol to get their take on the cricitisms. Now either The Australian contacted John Cook, in which case they new of the flaws in Tol's work and chose not to mention them (in which case the story is neither accurate, nor fair, nor balanced); or they chose not to contact John Cook in which case their reporting is at minimum not balanced.
I have been reading The Australian with a close eye to see if it now satisfies the next two principles:
So far neither have been complied with, and nor do I expect them to do so. They have in the past ignored adverse rulings by the Press Council in order to push a denier line. I see no reason why they would now improve their performance.
Tom@27,
Thanks for your link to APC. Re your quotes about principles, they only apply to the constituent bodies of APC. Incidentally, I looked at APC complain page and found out this:
Note the assertion by RobH@25:
I don't read Australian so i'm not sure what's going on here but based on the above,it now appears obvious that this article by Graham Lloyd, the Sydney-based env editor, was deliberately placed in West Australian, so as to avoid the adjudication by APC.
But that does not preclude anyone, like me and you from making a complain to the publisher itself. I remember having sent couple complains to newspapers like smh or HP about their climate science contents. In each time, the response was positive and the contents fixed. What makes you think that the Australian ignores the rulings of APC? Have you sent them any comments/complains in the past (like I did to smh) but were ignored?
chriskoz @28, regardless of RobH's assertions, the article did in fact appear in the Australian, and the Australian is certainly published by one of the constituent bodies, ie, News Ltd. Further, publication of this sort of biased, and poorly researched story on climate science is par for the course for the Australian and Grahame Lloyd. Indeed, the Australian is so bad that Tim Lambert, prior to becoming unfortunately inactive, was up to number 83 in his series on "The Australian's war on science". The Australian's treatment of climate science also features heavily in Robert Manne's astute criticism of that publication (very worth buying by any Australian citizen or student of the press).
Meanwhile, returning to the actual topic, I have been running through the data and found a genuine error in Cook et al 2013. Specifically, in Cook13 it is claimed that initially "... 33% of endorsement ratings disagreed". In fact, a careful comparison of all first and second ratings shows that only 15.56% of first and second ratings for given papers disagreed. I presume the authors determined that figure as I did, by determining the number of 2nd ratings that disagreed with first ratings (or vice versa) and doubled it to allow that a disagreement between a second rating and first rating is also a disagreement between first and second ratings but did not double the denominator to allow for the fact that there were twice as many abstracts if both ratings are considered.
Given the detailed analysis of the paper performed by Tol, it is remarkable that he did not also check the initial disagreement rate and simply accepted the stated figure. Regardless, with the correct figure, the "error rate" drops from his (incorrectly calculated) 18.5% to 7.6%. That leads to an estimated final error rate of 1.43% (compared to Tol's 6.67%). Applying that error rate using Tol's demonstrably faulty method then results in a corrected consensus rate of 96.5% (compared to Tol's 91.4%).
So even if Tol's primary analysis were correct, rather than the absurdity it in fact is, his conclusions do not follow from the data he analyses.
Richard Tol has now published a response of sorts to the "24 errors". I say of sorts in that he merely responds in a single line, often with fairly straightforward falsehoods. As an example of the later, he responds to Error 22, ie, his claim that the trend in endorsements in Cook13 is due to a trend in composition by saying:
However, C14 explicitly state (and highlight in a side box) that:
So, the 24 Errors document explicitly rejects Tol's claim, providing clear cut evidence for that rejection. I don't know whether Tol's straightforwardly false claim is a consequence of his reading no more of the document than section headings, or whether he does not care about the truth of the matter, and expects his supporters to care no more, so that a straight forward falsehood is all he needs. As a response to criticism, however, it is simply not good enough.
CBDunkerson @10: "You've got to wonder what keeps them going... even when their own best spin proves them wrong they still just keep right on believing the nonsense."
What keeps them going (And I don't think that they believe the "nonsense" for a second. In fact, they may understand the horrific reality better than most which is why they "exist") is that every time they publish their gibberish, it gets cited, re-cited, referred to as truth, ad infinitum. Which, of course, is their sole intent. Their consumer/audience remains people like Marc Morano who just made Tol's ridiculous Fox News article (http://www.foxnews.com/opinion/2015/05/28/climate-change-and-truth-mr-obama-97-percent-experts-do-not-agree-with.html) his website's headline.
It doesn't matter that it's jumbled up drivel. Most Climate Depot readers will just look at the title and feel relieved that all is well in their little world, without knowing the backstory or the reality of the situation. As long as there is a market for Tol and his ilk's phony "research," it will keep getting pumped out. I'm so grateful for SkS.