Climate Science Glossary

Term Lookup

Enter a term in the search box to find its definition.

Settings

Use the controls in the far right panel to increase or decrease the number of terms automatically displayed (or to completely turn that feature off).

Term Lookup

Settings


All IPCC definitions taken from Climate Change 2007: The Physical Science Basis. Working Group I Contribution to the Fourth Assessment Report of the Intergovernmental Panel on Climate Change, Annex I, Glossary, pp. 941-954. Cambridge University Press.

Home Arguments Software Resources Comments The Consensus Project Translations About Support

Twitter Facebook YouTube Mastodon MeWe

RSS Posts RSS Comments Email Subscribe


Climate's changed before
It's the sun
It's not bad
There is no consensus
It's cooling
Models are unreliable
Temp record is unreliable
Animals and plants can adapt
It hasn't warmed since 1998
Antarctica is gaining ice
View All Arguments...


Username
Password
New? Register here
Forgot your password?

Latest Posts

Archives

Empirical evidence for positive feedback

Posted on 30 November 2007 by John Cook

In our recent post on model uncertainty, we found uncertainty is skewed towards higher climate sensitivity (and hence greater temperature change). However, this is based on the assumption that the climate system has net positive feedback. Do empirical observations confirm the existence of positive feedbacks - and more importantly, a net positive feedback?

Water Vapour as a positive feedback

Water vapour is the largest positive feedback in our climate system. The amplifying effect of water vapor is detected in Soden 2001 which observed the global cooling after the eruption of Mount Pinatubo. The cooling led to atmospheric drying which amplified the temperature drop.

Satellites have observed an increase in atmospheric water vapour by ~0.41 kg/m² per decade since 1988. A detection and attribution study (Santer 2007) found the primary driver of 'atmospheric moistening' was the increase in CO2 caused by the burning of fossil fuels. More on water vapour...

Carbon cycle feedback

That CO2 lags temperature is a popular skeptic argument but the implications are often overlooked. If rising temperatures lead to more CO2 outgassing from the oceans and other sources, that means current global warming will lead to more CO2 being released, amplifying the warming. While the mechanisms are not fully understood, the amount of CO2 change from changing temperatures and subsequent feedback have been observed in ice core records. Torn 2006 looks at the last 360,000 years and finds a warming of 1.5–4.5°C is amplified by CO2 feedback to 1.6–6.0°C. Scheffer 2006 focuses on the Little Ice Age, from 1500-1600 AD and estimates CO2 feedback will amplify warming by an extra 15 to 78%. More on CO2 lag...

The ocean's diminishing ability to absorb CO2

While the ocean absorbs around half of human CO2 emissions, observations indicate the oceans are losing their ability to absorb CO2. Quéré 2007 found the Southern Ocean has reached its saturation point, diminishing its ability to absorb more CO2. Similarly, CO2 absorption by the North Atlantic has dropped even more dramatically, halving over the past decade (Schuster 2007). If this trend continues, it potentially leads to a positive feedback where the oceans take up less CO2 leading to CO2 rising faster in the atmosphere. More on the carbon cycle...

Plankton growth slowing

Microscopic ocean plants called phytoplankton account for about half the transfer of carbon dioxide (CO2) from the environment into plant cells by photosynthesis. Land plants pull in the other half. However, warmer water creates more distinct ocean layers and limits mixing of deeper nutrient-rich cooler water with warmer surface water. The lack of rising nutrients keeps phytoplankton growth in check at the surface. Satellite observations of plankton growth have observed the rate at which plant cells take in CO2 has declined more than 6 percent globally over the last two decades (Gregg 2003).

Arctic sea ice melt

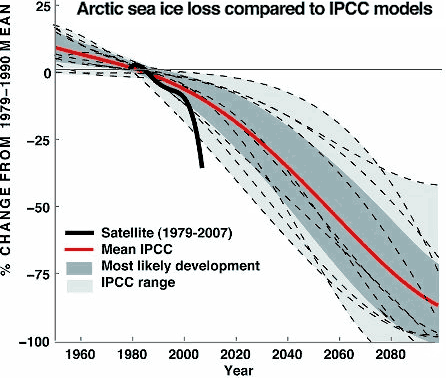
As Arctic sea ice melts, more ocean is exposed. Sea water is more effective at absorbing sunlight than ice which reflects sunlight back into space. Hence as sea ice melts, temperatures rise which causes more melt and so on. Arctic sea ice loss has not only has exceeded IPCC model projections - it has fallen below even the extreme lower limit of predictions (Stroeve 2007).

Melting Permafrost

The Arctic permafrost contains more carbon locked away in frozen soil than the entire atmosphere (Zimov 2006). On top of this, thawed permafrost can release its carbon as methane, 20 times as potent a greenhouse gas as carbon dioxide. Methane has been observed to be bubbling from Siberian thaw lakes five times higher than previously thought (Walter 2006).

Melting snow cover extent

A study on Northern Hemisphere snow cover extent over the period 1972–2006 (Déry 2007) found significant declines in snow cover during spring over North America and Eurasia. It also found an enhanced snow-albedo feedback over northern latitudes that acts to reinforce initial warming. Eg - as the snow melts, the ground and sea absorbs more warmth from the sun.

Putting it all together - climate sensitivity

While empirical observations confirm the existence of distinct positive feedbacks, the crucial question is what is the net positive feedback? Another way of asking this is what is climate sensitivity? Climate sensitivity is typically defined as the amount of temperature change for the doubling of atmospheric CO2. If there was no net positive feedback, climate sensitivity would be around 1°C. A number of studies calculate climate sensitivity directly from empirical observations, independent of models.

  • Hansen 1993 looks at the last 20,000 years when the last ice age ended and calculates a climate sensitivity of 3 ± 1°C.
  • Lorius 1990 examined Vostok ice core data and calculates a range of 3 to 4°C.
  • Hoffert 1992 reconstructs two paleoclimate records (one colder, one warmer) to yield a range 1.4 to 3.2°C.
  • Gregory 2002 used observations of ocean heat uptake to calculate a minimum climate sensitivity of 1.5.
  • Tung 2007 performs statistical analysis on 20th century temperature response to the solar cycle to calculate a range 2.3 to 4.1°C.

So climate sensitivity is around 3°C. The warming from a doubling of CO2 amounts to around 1°C with positive feedbacks contributing another 2°C of warming. More on climate sensitivity...

UPDATE 5 Apr 2008: Tamino gives a good overview of feedbacks, both positive and negative.

UPDATE 22 Apr 2008: there is new evidence that the Arctic floor is thawing and releasing methane

0 0

Printable Version  |  Link to this page

Comments

1  2  Next

Comments 1 to 50 out of 83:

  1. One of Pielke's posts pointed out the differing effects of CO2 and water vapor. http://climatesci.colorado.edu/2006/05/05/co2h2o/ Here's a paper by Minschwaner, indicating that many models overestimate the postive feedback of water vapor, and that the actual warming would be more in the range of 1.2C to 1.6 C. http://meteo.lcd.lu/globalwarming/water_vapour/dessler04.pdf
    0 0
    Response: Thanks for the comment. The Minschwaner/Dessler paper is an interesting one - it led me to a list of the publications by Andrew Dessler. As well as many studies on water vapor, it includes Minschwaner 2006 which concludes "current global climate models are simulating the observed behavior of water vapor in the tropical upper troposphere with reasonable accuracy." Added to my to-do list is going through all of Minschwaner/Dessler's studies as they seem to be some of the leading authorities on the role of water vapor in climate.
  2. You mention here Tung and Camp, in a paper by Camp and Tung published in Geophysical Research letters volume 34 this year, these same two authors found a link between total solar irradience and temperature change including a short time lag. I suspect this is part of the same research. If this research is valid than one of the things it suggests is that total solar irradience explains a significant chunk of late 20th century warming, perhaps all of it detected by satellite measurements. While this research may support your point here it is somewhat contradicting your argument in the "it's the sun segment." From reading your link it appears to me that they are showing a positive feedback for total solar irradience changing. This is likely to mean CO2 would also have a positive feedback but it is not actually evidence of that. As the sun varies the amount of energy reaching us varies not only in amount but in distribution of wavelengths. Since high solar activity correlates with higher temperatures it may be that UV of x-ray radiation have a larger proportional affect on climate than visible and IR. If so they would also have a place to look for a mechanism for the phenomena they report. Am I the only one out here who is waiting hopefully for global warming? We are having a heat wave, warmest day in weeks at -8.
    0 0
    Response: Tung's work looks at the short term effects of solar variations. Eg - over the 11 year solar cycle. Global warming is a multi-decadal trend and so to find out how much the sun is contributing, you need to look at the long term trends of solar variation. And studies on the long term trends (Usoskin 2005) show that in the past, long term solar trends have correlated with climate but the correlation ended in the mid 70's when the modern global warming trend began. It's past correlation coupled with the break down in correlation that tells us the sun cannot be the main driver of global warming.

    UV does have an amplifying effect but as with Total Solar Irradiance, the UV long term trend over the last few decades is small. This is especially significant as UV typically shows greater variation than TSI.

    I'm sure there are people who benefit from global warming, particularly in high latitudes. But compare the positives to the negatives to see if overall, global warming is a good thing.
  3. Scientists are also seeing a net negative feedback Time series analysis results on the basis of 24 long temperature series from various European and Asian stations do not support the IPCC conclusion about the dominant role of positive feedback (e.g Soden and Held 2006) as long as the cumulative feedback sign is considered. Vice versa, the variability of the air temperature at these stations during the last centuries shows that the influence of growing CO2 concentration in the atmosphere has been totally eliminated by the system’s negative feedback. One can expect that the IPCC used four key feedbacks represent too weak tool to properly describe the cumulative effect of all actually operating feedback loops in the climate system. Its results are therefore not relevant for understanding the current climate system variability. http://www.aai.ee/~olavi/EE2007-ok.pdf
    0 0
  4. I think what I am disagreeing with above is your contention that there is some great disconnect starting in the seventies. That is not evident in Tung's paper, nor is it as big a disconnect as 1940-1970 is from the AGW hypothesis. The sun climate correlation is not great but it does have a higher correlation than the CO2 climate connection. On your last paragraph you refer top your own positives and negatives page? There is a reason that warmer periods in the climate record are referred to as climate optimum. More than half of the surface area of North America, Asia, and Europe, is farther North than I am. Most of this land is very limited at the present for any significant agriculture. Currently far more people die as a result of cold related problems, (not just exposure) as due to heat waves. The idea that warming would cause reduced food supply and access to resources is not supported by the historical record. People are still not fighting for my beachfront property on Lake Baikal. Compare property prices on Lak Havasu and Lake Huron if you want to evaluate how people feel about too warm and too cold. Lake Huron is a lot nicer by any other measure. The economy as a whole does not share your preference for cold.
    0 0
  5. Wondering Aloud, I find your view overly simplistic. In my opinion, and from reads like those of Jared Diamond, it seems that what is really favorable is a temperate climate without too much excursion one way or another. It is interesting to note that, for a while, the expansion of white colonization northward from South-Africa was stalled by a number of climate related factors: no crops, diseases etc... "The economy does not share your preference for cold." How does that translate when comparing at a macro level (not only real estate prices) the economies of, say, Sweden and Mauritania? Norway and Central African Republic? I find this statement so vague as to be meaningless. How about comparing the economies of various regions in Australia according to average temps? What results do you get with that? Also, when considering land area, it is better to look at a globe than a map (except a conical lambert projection, not very suitable for very large areas). It is also necessary to think about positive and negative there, i.e. how much land will no longer be available due to change in rain patterns or simply excessive temps. In a (overly) simple representation in which you map good agricultural regions as a belt defined by a latitude range (that's what you seem to allude to), moving that belt poleward will decrease its total area, there is no doubt about that. Furthermore, you seem to confuse global and regional just for the sake of your argument when you ask "am I the only one hoping for warming?" Global does not mean local, there will still be local variations and, while Baikal may see slightly warmer weather, other changes in precipitation, wind or whatever might not be to your liking and won't be compensated by the warming. If you really don't like it up there, you should move to a warmer place now, rather than wait for a phenomenon whose existence you doubt.
    0 0
  6. You would have to say that extra water vapour was a NEGATIVE FEEDBACK. The idea of it being a positive feedback only comes about because of the climate scientists looking at the wrong metric. The metric has to be accumulated joules in the ocean. And if we could find out the information, accumulated joules in the planet itself. But it looks for now like we will soon have pretty good data for accumulated joules in the ocean. The air temperature is a SYMPTOM of the accumulated energy in the ocean. Because that accumulated energy will cause extra water vapour. But in no way is this a positive feedback. In fact water vapour is like the oceans sweating. Extra CO2 in the atmosphere ought to be considered in this way as well. What at first looks like a positive feedback may well turn out to be a negative feedback.
    0 0
  7. Phillipe. Climate history is very clear on this. The warmer times are the better times.
    0 0
  8. You cannot make such conclusions about "climate sensitivity". Since we already know that volcanoes can cool things and we know that extra solar activity can warm things. But we have no evidence that extra CO2 can warm things. So its a big leap to say that CO2 can warm things on the basis of aerosols and solar variation. "A big leap" is an understatement.
    0 0
  9. "However, warmer water creates more distinct ocean layers and limits mixing of deeper nutrient-rich cooler water with warmer surface water. The lack of rising nutrients keeps phytoplankton growth in check at the surface." This is a negative feedback. It means the deep oceans cannot warm as well. The stratification will mean more energy lost from the surface. If the mixing was more robust the ocean could retain more heat energy. An ocean-focus tends to change all these alleged positive feedbacks into negative feedbacks.
    0 0
  10. GMB, do you have cites for your assertions on feedbacks? You're suggesting a large bunch of scientists have it all wrong. If I am to take your word for it, can you show your credentials or own publications? You address John Cook as "you", but he is mainly relaying the core message emerging from the existing body of research. The radiative properties of CO2 are known and there is a considerable amount of published science indicating that these properties are "warming things up" in the way physics would let you expect. Such as in these papers: http://pubs.giss.nasa.gov/docs/2003/2003_Santer_etal.pdf http://www.aos.wisc.edu/~deweaver/lorenz_deweaver_uchange.pdf Only examples, there is too much to list really. Refuting all of it would be quite an undertaking, you haven't really given much details on how that would be done. General ideas are fine but studies and publications are better. Any models exploiting the principles that you mention in post #9? About climate history, you're a little vague. What kind of ranges and timelines are we loking at? Are we comparing anything from the times after Panama closing with before (which would be kind of pointless)? http://marine.rutgers.edu/faculty/rosentha/rosenthal_files/Lear_NADW_inpress.pdf What are you criteria for "better." Total biomass? Human expansion? Are you considering only very recent history (past 2500 years)? If yes, can you substantiate some more? Besides, I could add that comparing our times, during which humans have become a major limiting factor on virtually all components of the total biomass, with times past, during which they were one component among others and going with the flow, might be inappropriate and lead to meaningless comparisons.
    0 0
  11. You cannot find any evidence that CO2 is warming things up. The whole movement is based on running down what the other guy says. No such evidence exists. Which means of course that the effect is not there or its just not strong enough to register. There's wiggle room for a sliver of warming but even me saying this is pure speculation. I don't know how you can have a study for something that isn't there. And these are hardly scientists we are talking about. More like "science workers."
    0 0
  12. Total biomass wouldn't be a bad metric one supposes. And Total biomass is largely a function of the presence of CO2. The human race using a lot of net or gross primary production strikes me as an astoundingly good reason to keep the CO2 coming. You'll find my logic is quite unassailable. And that ought to be sufficient without any further references.
    0 0
  13. Tell me. Before I go and spend a lot of time on the two studies you linked... Have they made the same obvious mistake that Annan made? I mean are they investigating CO2-warming? Or are they investigating solar variance warming, volcanic aerosols warming, anything but CO2-warming, and making invalid inferences from one to the other? Because you could put up 1000 studies and it wouldn't mean a thing if they didn't have actual evidence for specifically CO2-based warming.
    0 0
  14. You say there is no evidence that CO2 is warming things up. Although I beg to differ (that's what the links are for), for the sake of the discussion, it can also been said that there is no evidence that the Sun, or anything else is specifically warming things up either. For the Sun, there is actually evidence to the contrary. One can point to a source of warming if one can find a physical feature that constitutes a signature for that source. Stratospheric and tropopause changes are pretty good signatures for increased GH effect. What exactly is the difference between a scientist and a science worker? I am layman myself and would certainly not make such a distinction. You feel confident making it but still do not present your credentials, which, I assume, should include significant scientific background. "Total biomass is largely a function of the presence of CO2." This needs elaboration. My own knowledge of biology indicates that the availability of liquid water is a a much more important factor. Why is total biomass a bad metric? "The human race using a lot of net or gross primary production strikes me as an astoundingly good reason to keep the CO2 coming." Although I have a vague idea of what you might refer to, what do you mean by "production"? What exactly is the link between "keeping the CO2 coming" and the "production"? "You'll find my logic is quite unassailable. And that ought to be sufficient without any further references." Considering you're arguing against physics, I'll say no, it is not quite sufficient. I'll add that this is exactly the kind of argument that "skeptics" find unacceptable. In response to your last question, atmospheric physics suggest that the tropopause would behave in a certain way if there is warming in response to increased greenhouse effect. That behavior was modeled and observations of the actual changes in the tropopause matched the expectations and model results. As for your ocean dynamics ideas, surely, if the logic of it is made of steel, there should be no shortage of researchers using them to try understand oceanic thermal behavior. I would be very interested in having a glimpse of their work, so I don't see why you would withhold links to related scientific work.
    0 0
  15. Do your links make the same mistake that Annan does or not?
    0 0
  16. Right. I just looked at the introduction of your second link. It doesn't even ATTEMPT to find evidence for CO2-warming. It merely assumes and asserts that CO2 has this warming effect. When people keep doing this they are not engaging in science. Rather they are engaged in theology. The spectroscopy is in the armchair inference that CO2 will make a difference on a global scale. We know about the spectroscopy. Thats already in the HYPOTHESIS. It cannot be used as evidence to test THAT hypothesisl. Now before I go to your first link can you tell me if there is any evidence there?
    0 0
  17. All I can do is repeat what I previously said. Physical laws allow to identify what the signature of a specific cause of warming is. Observations show whether or not that signature is found in Nature. For example, a signature of solar warming would be stratospheric warming, an observable feature (nowhere to be seen however). I don't know what an armchair inference is. If Physics shows that an effect exists, there is no reason to believe that this effect will somehow disappear. Spectroscopy shows the thermal behavior of CO2 and allows to calculate a radiative forcing. If you want to argue that this radiative forcing does not exist because of some reasons, go right ahead. You could also argue that the pressure differential afforded by Bernouilli's principle is just a hypothesis and there is no reason to think that it can make a wing generate lift. By your reasoning, this would have been a perfectly defendable position before airplanes started flying (there was no "evidence" for it). Let's examine the oceans "sweating" idea. I assume that you are knowledgeable enough about what sweating does in humans and used the analogy accordingly. If the oceans are "sweating", they are trying to dissipate heat by evaporation, relying on the thermic loss from the latent heat of evaporation. Why would the oceans do that? Because they have excess heat to dissipate (that's why we humans sweat, whatever the reason of the excess heat). This leads to interesting questions: Where is the excess heat coming from? If the "sweating" process is working, oceans should show a loss of energy, most noticeable at the surface under the form of decreased temperatures. Just like skin temperature drops (significantly) when sweat evaporates. Do sea surface temperatures show anything of the sort? Once the water vapor is released, what happens to it? After all, water vapor is a potent greenhouse gas, physics tells us so and it is bound to trap heat, regardless of what you think. Overall thermodynamic balance: if the "sweating" is working, what happens to the dissipated energy? You did not answer the following of my questions: -your credentials? -science worker vs. scientist? -biomass/CO2? -biomass as a bad metric of "better" times? -link between biomass and CO2? -What exactly are net and gross productions? -Scientific work exploring the idea of ocean sweating?
    0 0
  18. There is no signature for CO2 warming. And no thats not right. Solar warming won't lead to stratospheric warming. It will lead to stratospheric cooling indirectly via higher water vapour levels and then subsequently lower ozone levels. This is in fact what has happened. You are talking about "SIGNATURES?". Well we know whats happened already. The signature in the stratosphere is such that the build-up in water vapour is robbing energy from the stratosphere. The signature comes from the wavelengths that are missing there. Which are the wavelengths primarily that water vapour absorbs and to a smaller extent the wavelength (speaking of long-wave-radiation) that ozone absorbs. Hence we can deduce that what is behind the cooling is the following transmission method. Really the only transition imagineable if you think long enough and clearly enough about it: INCREASED SOLAR ACTIVITY.....DELAY.....BUILD-UP IN JOULES IN THE OCEAN.....DELAY.....BUILD-UP IN WATER VAPOUR IN THE AIR.....DELAY.....BUILD UP IN HEAT ENERGY IN THE ATMOSPHERE....REDUCTION IN HEAT ENERGY IN THE STRATOSHPERE... So the signature you are talking about is not there. And where you are coming off the beam is you are imagining that this is some sort of instantaneous light-and-air show. So the factor of imbedded joules in the ocean is discounted. As is the factor of TIME!!!! No doubt if the sun starts up a major level of activity all of a sudden the first thing that will happen is that the troposphere and stratosphere will warm. But its what happens over years and decades that counts here. And whats happened is that the oceans have slowly absorbed energy. This leads to more water vapour in the air. This leads to on average a warmer troposphere and a cooler stratosphere. Now I'm right and you are wrong. And we can see that because my broad understanding of whats going on fits what we are seeing. Whereas you are yet to show me where the signature is for this alleged CO2-warming. You are going to have to come up with some evidence fella. Thats the problem with this cult. No evidence. You don't have any evidence. Lets see some evidence.
    0 0
  19. Dr. Elmar Uherek from the Max Planck Institute has thought about this long and clearly and I find his views more compellig than yours: http://www.atmosphere.mpg.de/enid/2__Ozone/-_Cooling_nd.html All you have is a funny theory, yet I'm supposed to think it's better thah anything else out there just because you say so? Sorry, no can do. This took me just a minute to find. However, I still had no luck so far with the sweating oceans. I really like your way of dialoguing, though: "Now I'm right and you are wrong." That's funny.
    0 0
  20. And why should I bother coming up with some evidence when you don't show any?
    0 0
  21. Really, all you have is a set of ideas attempting to fit the data you're aware of in a way you like. However, you forget that there is an entire body of research out there that you must invalidate if you are to prove you're right. Santer, Ramaswamy and Schwartzkopf have a lot of research and modeling work on the stratosphere; the modeling of WV effects has been shown to be appropriate by Cess (2005). You must demonstrate all this stuff to be wrong, just saying it is does not make it so. Furthermore, where exactly is the increased solar activity capable of producing the kind of ocean heating we're considering? You talk joules, how are the very small variations of TSI in W/square meter (which could never be actually observed from the surface) converted into so many joules in the very short time during which it was witnessed? "The estimated increase of observed global ocean heat content (over the depth range from 0 to 3000 meters) between the 1950s and 1990s is at least one order of magnitude larger than the increase in heat content of any other component." From Levitus et al (2001). Does it really add up? Is the total energy really there only with the TSI? Is the delay consistent with what is observed? How does one know what the delay is? A delay without physical principles is an awfully convenient fudge factor. Since you're so gung-ho on evidence, I'm sure you have some on all that. Or do I need to just believe you again? I keep an open mind, however. You seem very confident in your theory, so you really should try to have something coherent reviewed and published. I will be happy to look at it then and integrate it to the extent of my abilities. Until then, all you have is an opinion, and as the saying goes, we all have one. Incidentally, your "I'm right you're wrong" comment is kind of moot, since, unlike you, I have not presented any personal theory or opinion. I have instead summarized what I've seen of the research published out there. So your comment should more accurately be: "I'm right and all those other guys publishing articles and studies are wrong." Who I will find more credible, however, is up to me. Usually, I am wary of people going "I'm right, you're wrong." Funnily enough, that's very reminiscent of those religious ideas you alluded to.
    0 0
  22. Have you got that evidence? I tell you there is no evidence anywhere that industrial-CO2-release is BAD for the environment. Every last scrap of extant scientific evidence confirms that industrial-CO2-release is good for the environment. But if you find any evidence or anything that contradicts anything I've said do let me know.
    0 0
  23. And you have not shown evidence of solar warming. I've seen trolls before but you're an extreme. Not a single reference to back up any of your assertions in the all thread, yet asking for evidence while it is obvious that no evidence could ever satisfy you. The upper stratospheric cooling, as explained by Dr. Uherek is accepted by experts in atmospheric physics, but not by you. Dude, how could I possibly take you seriously? Keep yelling in the dark.
    0 0
  24. "The upper stratospheric cooling, as explained by Dr. Uherek is accepted by experts in atmospheric physics, but not by you." As I explained to you. The stratospheric cooling quite clearly comes from extra WATER VAPOUR IN THE TROPOSPHERE. And a small amount of it from a subsequent reduction in Ozone in the stratosphere. The transmission goes: extra solar brightness.....DELAY....buildup of joules in the oceans....DELAY.....buildup of water vapour in the troposphere....DELAY....cooling stratosphere. The spectroscopy will reveal that the missing radiation in the stratosphere is at the wavelengths that water vapour and ozone typically absorb. Not where CO2 absorbs. So your science worker has it wrong.
    0 0
  25. Please keep going, this is getting better by the minute, LOL!
    0 0
  26. In case someone is reading this and wondering what in the heck you're trying to talk about, stratospheric radiative processes have received attention for a long time. This is from a 1996 german study abstract: "As previously reported, the CO2 15-µm bands are dominant." However, this link has very nice graph (bigger than the ESPERE page) that gives a visualization allowing to better understand the respective roles of the various significant gas significant of the radiative process.
    0 0
  27. Your link looked promising but its meaningless. Since its a model. Hence the word "scheme". The dominant band from longitudinal studies turn out to be a single band for water vapour. Thats real world observations as opposed to your mans modelling. The abstract leaves too much out too conspicuously for that not to be the case. They would need to say from which to which date. They would have needed to have a start and a finish date to see the difference.
    0 0
  28. Actually that is interesting after all. Why are they claiming that 15 microns is where the action is? Why not 2.7 or 4.3? Or whatever the other two CO2 absorption peaks are? Are these guys claiming that the 2.7 or 4.3 absorption peaks are for some reason barely operational? The best case scenario is if CO2 warms but only a small amount. That would be the best dumb luck the human race had in a long while.
    0 0
  29. You know what? If its observational my bet is that they would have to be talking about the UPPER stratosphere. These abstracts can be tantalizing and annoying. But if there is something about 15 microns that passes the other peaks by that could throw some light on things.
    0 0
  30. Fiat Lux
    0 0
  31. No actually I figured it out. Looking at black body radiation we see that for the temperature of the earth...... only the 15 microns is particularly relevant. Since the earth isn't warm enough to generate much in the way of radiation around the 2.7 and 4.3 area. But there ought to be a bunch of incoming at 2.7 and 4.3. And extra CO2 might help block that. I still contend that they are talking about a MODEL and not the actual empirical data. So you are still out of evidence.
    0 0
  32. No no thats not right. You just haven't come up with any evidence yet. And science fraud is offensive. But you only have the abstract. You don't have the data. And while the loss of Ozone and the extra water vapour shows up in the data, when it comes to the stratosphere cooling, the signature from extra CO2 is not there.
    0 0
  33. Even abstracts deserve to be read, they can lead to much other info. Those models that you assert have no validity, actually have been validated and refined over the years through ERBE and the ARM program for example. I suspect that's why they are so widely used in the atmospheric science community. Most of Clough and Iacono's work seems to be published by AGU, which requires subscription, but a lot of other material can be found full text (with data and references) from other sources. ERBE and ARM make a lot of data available, and so does CERES, I believe.
    0 0
  34. "Validated" is a most unscientific word. Its a new word in the business. You would not have seen it around 40 years ago. It is a symptom of the current UNSCIENCE. Yes abstracts deserve to be read and although my first reaction was that the study was more bullshit-make-believe-modelling it did get me thinking. So this is Clough and Iacono? Actually I've been looking for these guys. Didn't know how to spell their names so couldn't google them. Well that changes things. These guys do in fact do empirical work and I will follow it up. The abstract got me to thinking. I started trying to compare peak wavelengths under theoretical black body situations with the temperatures that matched the peak. And came to the conclusion that two of the three absorption regions that are usually attributed to CO2 would be totally irrelevant for outgoing long-wave radiation on Earth. And yet incredibly relevant for Venus. But I must be making some basic mistake. Because when I did the maths for the 15 microns my answer came out too cold. It came out with -80 degrees celsius when I'd seen graphs on the internet wherein it looks like the peak would be more like -18 degrees celsius so I don't know what dopey mistake I might be making. In any case the 2.7 and 4.3 region just cannot be relevant for outgoing even with a maths mistake of the magnitude described YET THEY COULD BLOCK INCOMING NO PROBLEM. Even with some mistake in my maths I'm sure that would be the case. Clearly I need some peer review here. But this highlights the mistake of people simply categorising everything as LONG WAVE RADIATION. They do so so flippantly and when you do this the armchair inference that CO2 will warm seems unassailable. But bring it down to the specific absorption regions you are going to get an whole different picture. The other thing I would want to find out is what possible effect the extra CO2 is having on the air pressure. To my mind increasing air pressure would be something that would assist warming. But I don't know how large or small the effect of extra CO2 is on air pressure. The best possible outcome for man and nature is if CO2 is warming but only a tiny bit. Like the warmth that the 15 microns and the extra air pressure might be retaining is JUST OVERMATCHING the warmth the the 2.7 and 4.3 regions might be blocking. Overmatching by a small but not a great amount. Hoping for such a thing won't make it true of course. But thats what we would be after since then the best policy option would be IMPOSE NO COSTS.
    0 0
  35. There are a lot of things we wouldn't have seen in 40 years ago science. Doesn't mean they're all bad. Try to sequence genes without computers, or fold proteins without models. Things change. Science is getting more and more into the issue of complexity, which can't be tackled without modeling. If climate was only about radiation, or chemistry, or fluid dynamics, it would be easy to study. But it's not. That's not to say we have an ideal set of tools. Overall, I believe scientists are doing a decent job with the tools they have, and that they would be foolish not to take advantage of the possibilities offered by those tools. By the way, I had never heard of Clough and Iacono until I looked at the graph on the SPARC page linked in post 26, which I found through a generic Google search (not on scholar). So there is plenty of stuff out there that you can easily find even if you don't know the exact spelling of an individual's name, and even this heavily edited discussion has participated in making you find stuff you were looking for. Kudos to John, his site is doing its job.
    0 0
  36. I think in this area the scientists are doing an absolute crap job once they go outside their area of specialty. Its as though they've lost their inductive/decductive ability. Or any ability to apply commonsense to anything that they do. Validation is a bad concept. And this overemphasis of peer review is also unscience. Peer co-operation would be a much better idea. But you go to realclimate and the bastards refuse to answer your questions. People are now frightened of being caught out not knowing some tiny detail not related to the main thrust of the argument. So the alarmists and humans both will clam up on you. It should be taken as given that the science worker is only likely to be on safe ground within his own narrow specialty. But since a policy judgement call in this controversy requires one to look at a number of different specialties the current alarmism is incredibly dysfunctional. And also scientists have little advantage over the laity. I mean I can't expect Roger Pielke Senior to get everything right and not to make mistakes. But there you have whole sites waiting for him to trip up on any number of areas not necessarily to do with his core training. Anyway. Here's a Clough and Iacona diagram. What do you make of it? Tell me what you think is going on from this diagram. I have my interpretations of it. But to me the labelling is hard to sort out. So I'm likely to misinterpret things here and so are you I suspect. But tell me what you think you see. http://www.3bmeteo.com/html/images/immaginigiornale/6956_3.jpg
    0 0
  37. This is the graph that I linked in post # 26 and also post #19. I believe that it was mostly finalized in this paper, although AGU requires a subscription, so I'm not sure: http://www.agu.org/pubs/crossref/1995/95JD01386.shtml On the right (color scale) is heat absorbtion in degrees kelvin per cm. On the left, pressure levels (indication of vertical repartition). On the bottom, wave length at which absorbtion occurs. The ESPERE page (link from post #19) has a nice explanation from Dr. Uherek: "Stratospheric cooling rates: The picture shows how water, carbon dioxide and ozone contribute to longwave cooling in the stratosphere. Colors from blue to red, yellow, green show increasing cooling, grey areas show warming of the stratosphere. The tropopause is shown as a dotted line with troposphere below and stratosphere above. Especially for CO2, it is obvious that there is no cooling in the troposphere, but a strong cooling effect in the stratosphere. Ozone, on the other hand, cools the upper stratosphere, but warms the lower stratosphere. Figure from: Clough and Iacono, JGR, 1995; adopted from the SPARC Website" To my knowledge, the way this graph (quite a piece of work if yo think about the maths involved) was done was by analyzing stratospheric composition data obtained from probes and balloons and from the known, lab obtained, spectroscopic characteristics of each of those gases. I could be wrong on that, it's just my thinking and a little reading I did. However, data from the ERBE and ARM programs (remote sensing, mostly) has been used to refine and validate it. ARM also has this paper, which seems to reinforce the idea of water vapor warming feedback: http://www.arm.gov/publications/proceedings/conf10/extended_abs/iacono1_mj.pdf It is an older piece (1992), so you should look at the more recent stuff, to see if the conclusions are still valid (as always).
    0 0
  38. As for RC, my experience is that they will not pay much attention to you if what you're asking: - can be found through their search engine - refers to a previous post - is widely explored in the litterature (readily googleable). Also, if it appears that you're not reading stuff they point to, (I linked that graph twice, yet you found it through another channel)sometimes they'll say so, but most likely they'll just ignore you. Those guys all have lives and jobs too and, regardless what you think of their views, they are high level professionals. They have dropped many of my comments/questions, which I found out later were really goofy, so in retrospect I was glad they didn't post them.
    0 0
  39. Right thanks for that. At first I thought they had screwed it up and that the CO2 thing was mislabelled. But I finally figured out that we need to convert wavenumber to wavelength: http://www.impublications.com/convert.php See if you can find out whats wrong with the labelling. Because on the face of it, it appears to be showing us that CO2 is making a WARMING CONTRIBUTION to the stratosphere. Why is that not right? Look at the Ozone. Higher up it appears to be making a WARMING CONTRIBUTION but in the lower stratosphere a COOLING contribution. I know that souonds wrong for CO2 but look at the scale? The positive scale is highly coloured as is the CO2-region. That main stratospheric-warming(?) band is at around 15 microns or 15000 nanometres. Since if you stick 650 in the converter it spits out 15,384 nanometres. The ozone absorption kicks in at about 1050 and that converts to 9.5 microns. Which is about right for Ozone too. Putting 2700 nanometres into the converter we find that comes to a wavenumber of 3703...which goes right off the scale. But we need to investigate that part of the scale since I showed the extra CO2 ought to be blocking incoming at that level. 2.7 microns ought to be irrelevant to outgoing radiation. 4.3 microns? 4300 nanometres? This converts to a wavenumber of 2325 which is also off the scale and suspiciously so. But note that on the face of it the 15 microns CO2 level appears to be warming and not cooling the stratosphere. And it appears to be achieving next to no effect at ground level. If anything it appears to be slicing what the authors think of as the H2O band in two. Almost as if it was neutralising the effect of water although that might be a natural break in water vapour absorption. There's a solid mild warming from halfway up the troposphere all the way through the stratosphere. It appears to be all the way from about 30 to 200 microns. What could that be? Well it might be direct from the sun???? That is a reflection of a tiny growth in solar brightness. That appears to be the case to me since its attenuating mildly most of the way down. Nothing conclusive can be taken from this. But its a good start to figure out the information we really need. But what I want you to suss out is........ why the 15 microns appears to be making a WARMING contribution and not a COOLING contribution to the stratosphere. Whats wrong with the scaling on the far right? I'll just have to assume its making a warming contribution if I can't find anything wrong with the scaling on the right. Great work anyhow. Thanks.
    0 0
  40. You have to establish yourself as a faithful alarmist to get any information out of those realclimate guys. They aren't in any way the professionals you make them out to be but I do need their specialist information.
    0 0
  41. The colored scale is a heat absorbtion scale, i.e. a cooling scale. The negative part of the scale indicates a negative heat absorbtion, i.e. warming.
    0 0
  42. Great stuff. So is there anywhere an extended version of this graph that goes right up to at least a wavenumber of 4000? And the other thing is, whats the time scale of the observations that make up this graph? Is it some sort of instantaneous thing? Like it would be more meaningful if it showed a change in average radiation levels between 1978 and 1995 since presumably CO2 has gone up in that time and under that scenario the higher CO2 effect would be a real standout, at least at the 15 micron level.
    0 0
  43. You see we don't want to be bigoted or discriminatory about light and colour. We ought to want to see what these gasses do all the way across the spectrum. To take in everything thats done right up to ultraviolet light would mean going down to 280 nanometres. Which means we have to go all the way up to a wavenumber of 37000. The other thing is the graph stops at the ground. But we need to know how things go right down to the bottom of the photic zone in the ocean. Whats happening 15m under the water? So we don't want to be bigots when it comes to greenhouse liquids versus greenhouse gasses. For that matter, if I want to take this principle to its logical extreme, we might wish to know what happens under 5m of ice on a Mountain somewhere. We don't wish to discriminate against greenhouse solids. This graph we are talking about centres itself over the only absorption region for CO2 that is relevant for outgoing. Thats giving us a skewed picture. Take the ozone band for example. Its showing warming in the lower stratosphere. Clearly this is coming from blocking long wave radiation from the ground. And its at that wavelength that is more appropriate than any other for typical earth temperatures. So at that wavelength the CO2 is warmer for the lower stratosphere. But thats not the whole picture along the spectrum. Its all light in my way of thinking. Why have we excluded every last part of the spectrum that would show these gasses blocking radiation from the sun before it gets to where we live or before it lodges itself in the ocean? This is just madness. We are not taking a balanced view. The absorption bands of 2.7 and 4.3 microns are highly relevant to blocking energy from the sun before it hits the ground.
    0 0
  44. Just another thought. Supposing that radiation with a wavelength of 15 microns peaked on a blackbody with a temperature of -18 degrees or so like it appears to in this graph in the link below. http://www.atmos.washington.edu/1998Q4/211/absorption.gif Now I calculated it at -80 degrees but I likely made a mistake. So going with this graph we can see intuitively that this would be a good range to block for the melting of ice. The earths surface may well be giving off this sort of wavelength where the earths surface is ice. So for example when you have a wind blowing and sun beating down on the ice it would absorb, disperse and reflect light. But it would disperse a lot of this light within itself. But its actual surface temperature might be such that its giving off radiation particularly around this 15 microns frequency. Think of the ice at night so as not to complicate matters with what the sun is doing. Its possible that the extra CO2 could be having no effect on the heat budget more generally, or even having a cooling effect, but it could at the same time be having a dissproportionate ice-melting effect in the scenario I'm outlining. We have to dissaggregate the world spacially to see what effects the extra CO2 is likely to be having. It could be cooling things over the oceans at the equator and warming things over a snowy mountain. We don't really know unless we check these things out. Intuitively one might imagine a high CO2 world helping us prevent frost damage even if it was doing nothing to the imbedded energy in the oceans and therefore to cumulative warming.
    0 0
  45. "Colour scale x 10-3 is in units of K d-1 (cm-1)-1" Thats commentary on the selfsame graph but from another link. I copied it the d to the negative 1 looks like a d-1. BUT WHAT DOES "d" MEAN? I think I might be finally able to figure out the implications of this graph if I only found out what "d" means?
    0 0
  46. You need to get on Google scholar and do your research, or ask one of your teachers, if you're a student. There is only so much I can do. I assumed that they focused on long wave bewcause that's heat and that's what the graph was about. The d is for day: cooling per cm per day.
    0 0
  47. But they don't say from which to which day? It meaningless if we don't know that. It would be meaningful if we knew it was from 3pm to 3am in the morning. People are very careless with the conclusions they take from things. Unless we know the time period there is nothing to learn from this thing. Its a radically different scenario if this graph is between 1978-1995 or if its 12 hours in mid-summer. You get people saying "Ho Ho look there is the signature for CO2 cooling the Stratosphere" but there is just no such thing unless we know what the damn graph is about. The other thing is if its a heat absorption scale thats a bit odd. Since after all if a molecule absorbs radiation IT HEATS UP. So far the graph can mean nothing. No conclusion can be taken from it. Certainly not that extra CO2 cools the stratosphere.
    0 0
  48. A day is 24 hrs. 3 pm to 3am in the morning is only 12. Once again, you need to read the paper if you want to know all the details. The graph is a nice one glance summary of the findings, but it's not the all paper. It is likely that the people pointing to the CO2 cooling signature know what the graph is about, especially the authors themselves.
    0 0
  49. I wouldn't count it as cut and dried that its a cooling signature at all. You look at that graph and it appears on the surface to be immensely clear in what its telling you. It appears to be an immensely user-friendly graph. But this is likely a lie. A skewed snapshot, taken througha prism, tricked out to look like a clear narrative. If CO2 is absorbing "LIGHT" (ie electromagentic radiation) in the stratosphere then it is doing its best to WARM AND NOT COOL THE STRATOSPHERE. That energy goes somewhere. If energy is absorbed in that part of the spectrum it will be reconverted to kinetic energy in Brownian motion as well as radiated out in a fuller spectrum in accordance with the molecules temperature yet allowing for its absorption characteristics. Environmentalists must be thought to be lying or wrong until proved true. Thats the only productive attitude. That is their track record. I see not one scintilla of evidence here that CO2 contributes to Stratospheric cooling on some sort of net basis. Not a scintilla. Its just pretty pictures. In this game your mind can be turned four of five times over contemplating a single diagram such as this. You are on the inside as a certifiable alarmist. You can find out the technical details. Whereas I, as a human, am excluded. Go forth and do your duty.
    0 0
  50. Really, you don't seem interested in finding out anything that disagrees with your worldview. It is unfortunate, because if you want to refute something, you need to at least read and preferably understand it. All the talk about blackbody and wave length makes it look like you know about radiative physics but in fact you revealed post after post that your knowldege of the subject and scientific understanding in general is rather lacking. You insist on saying that you have refuted stuff that you don't even read, I don't understand that attitude. You rant about the idea of validation, which is almost as ancient as science itself. The first light bending observation in 1918 validated Einstein's theory of General Relativity (even though the observation was botched). Observations validated the calculated existence of Pluto, and countless other space bodies. Advanced microphotography validated the Sliding Filament theory of muscle contraction, etc... Furthermore, I take offense of being called (among other things) an alarmist while I have not mentioned any kind of alarmist belief/scenario/whatever anywhere in this thread (find one if you can). I don't know what you mean by "the inside." I can't even get the Clough and Iacono paper without paying. I can not find any more details than anybody else. The reason why there is heat absorbtion in the stratosphere in those IR wave numbers is because GH gases, in the STRATOSPHERE, RELEASE HEAT TO SPACE. If you had read Dr. Uherek explanation linked in post 19, you would have seen this: "Greenhouse gases (CO2, O3, CFC) generally absorb and emit in the infrared heat radiation at a certain wavelength. If this absorption is very strong as the 15µm (= 667 cm-1) absorption band of carbon dioxide (CO2), the greenhouse gas can block most of the outgoing infrared radiation already close to the Earth surface. Nearly no radiation from the surface can, therefore, reach the carbon dioxide residing in the upper troposphere or lower stratosphere. On the other hand, carbon dioxide emits heat radiation to space. In the stratosphere this emission becomes larger than the energy received from below by absorption. In total, carbon dioxide in the lower stratosphere and upper troposphere looses energy to space: It cools these regions of the atmosphere. Other greenhouse gases, such as ozone (as we saw) and chlorofluorocarbons (CFC), have a weaker impact, because their absorption in the troposphere is smaller. They do not entirely block the radiation from the ground in their wavelength regimes and can still absorb energy in the stratosphere and heat this region of the atmosphere."
    0 0

1  2  Next

You need to be logged in to post a comment. Login via the left margin or if you're new, register here.


The Consensus Project Website

THE ESCALATOR

(free to republish)


© Copyright 2024 John Cook
Home | Translations | About Us | Privacy | Contact Us