


 Arguments


Talking Trash on Emissions
Posted on 7 January 2014 by jg, Andy Skuce
While attending the recent AGU conference, some of us were struck by a statistic presented by Professor Richard Alley: On average, a person's contribution of carbon dioxide waste to the atmosphere is forty times greater than their production of solid trash to landfills when measured as mass.
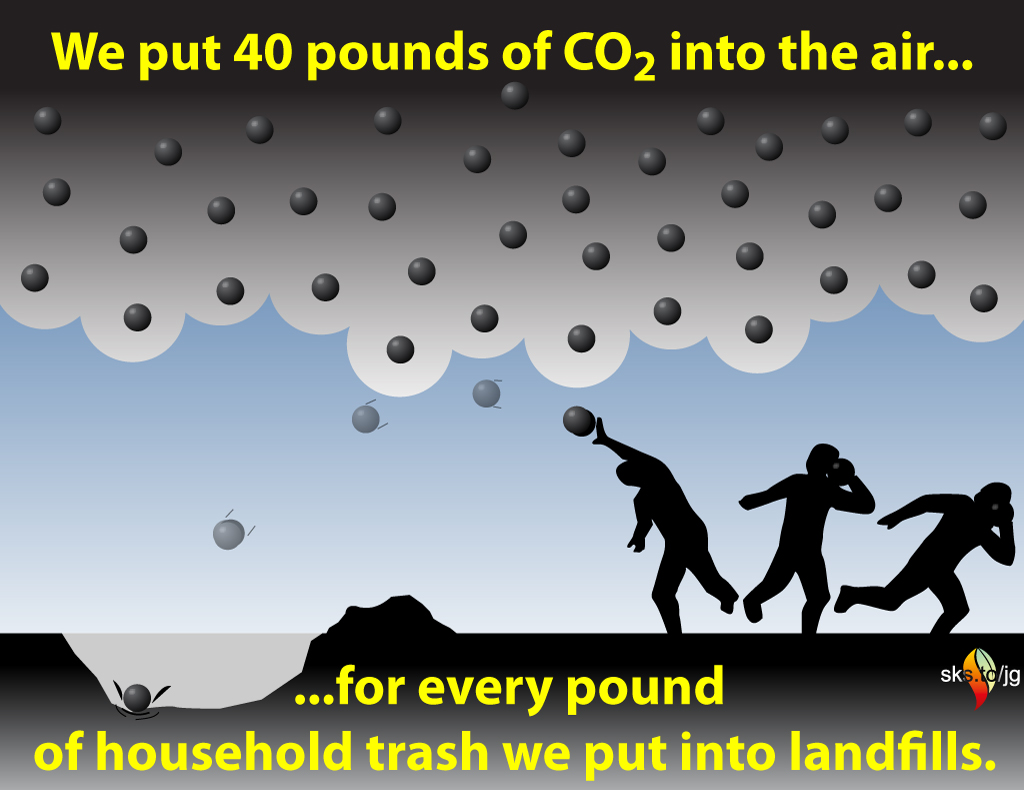
It can be difficult to grasp the huge quantities of CO2 that we emit. It’s an invisible gas with no odour and we are not used to thinking about amounts of gas in terms of mass. But we do have a good sense of how much solid waste we throw out, since we all have to lug our garbage to the curb. If we had to do the same with our greenhouse gases, instead of one can a week, we would have to haul forty.
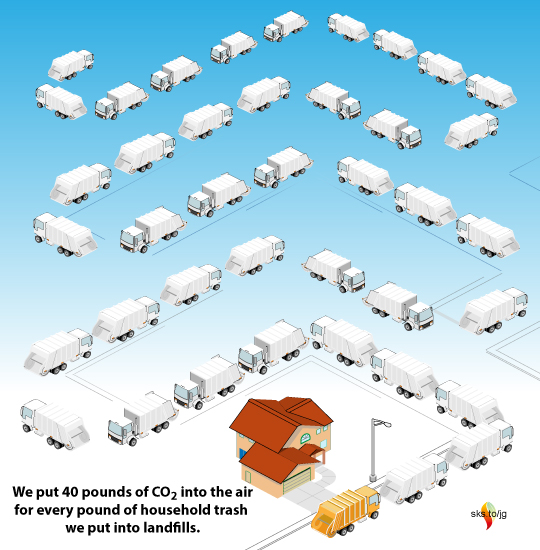
Every time we see a garbage truck, let’s imagine forty others following it, all taking our carbon dioxide to a dump site. When we hear of municipal politicians struggling to find new landfill sites, imagine the problems we would have finding forty subterranean landfill sites if we ever tried to dispose of our CO2 in the subsurface instead of dumping it freely into the air.
The EPA estimates that American households and businesses generate, on average, 4.4 pounds (2kg) of waste per person per day, of which 35% is recycled and composted and 12% is combusted. This leaves approximately 1.1kg per person per day of waste that goes to landfills. For a couple, that would be a 15kg (34lb) can of garbage per week. The average American produces about 17 metric tons of CO2 per year, which works out to 46kg each per day. Consumption of goods and energy are both linked to GDP, so it’s likely that a roughly similar CO2/garbage ratio applies everywhere, but let’s round it down to forty. (People who produce relatively little garbage probably also have relatively small carbon footprints.)
SkS authors discussed various ideas to illustrate our impressive CO2-to-trash ratio and we settled on the shot-put image to convey the weight and significance of our CO2 emissions. Imagine tossing a chunk of iron or shoe-box sized rock. For each one you toss, another forty dissolve in the air and disappear. Or do they?
About 45% of the CO2 we put in the air stays there, with 30% going into the biosphere (plants, animals and soil) and the remaining 24% is absorbed into the oceans, (Canadell et al 2007). Of course, the CO2 that goes into the ocean is changing the chemistry of the seawater, with severe consequences for ocean ecology.
Most of the CO2 in the air will stay there essentially forever, trapping heat and changing the climate for many millennia to come. According to David Archer in The Long Thaw, the CO2 emitted by fossil fuels will have an ultimate heating contribution millions of times larger than the energy released from burning it. (Archer claims the number is 40 million, David Appell argues that it is more like—a still impressive—3.5 million times.)
Unprecedented climates will be experienced soonest by those countries nearest the equator that have become adapted to historically stable tropical conditions (Mora et al, 2013). These typically poorer countries have fewer financial resources to draw upon to adapt to a changing climate. They are also countries that have done less than average to contribute to the problem, either in terms of greenhouse gas emissions or, for that matter, as garbage (e.g., see this UNEP report, page 37). Greenhouse gases have mainly come from wealthy people living in temperate climates, but the consequences of dumping of them into the atmosphere will be felt first by the poor in the tropics and later by all our descendants everywhere.
The website Carbon Visuals has some excellent info-graphics that help visualize the huge quantities of our emissions. They offer a free poster for download (pdf, 10MB).
As with all our resources, these illustrations are available to republish under our Creative Commons license.


Thanks for this excellent piece. I like the ability to hone in on a particular activity and assign a particular GW value to it. Is there a program to expand this to other high-impact behaviours?
It may also be useful to have an over-all number for the typical first world consumer (those of us who Kevin Anderson has said must start reducing our total carbon emissions by at least 10% a year starting this year for any chance of staying below 2 degrees).
If we take the general idea that 20 percent of the population is doing about 80% of the polution, and combine that with the atom bomb figures you have above, does it work out that, on average, every such top consumer (probably including anyone who would be reading this) has 'dropped' the equivalent of about one Hiroshima bomb worth of energy into the climate system in about the last decade? Would that at least be about the right order of magnitude?
wili @1, the article does not describe the total CO2 released by decomposition of solid waste from households. Rather it quantifies the average mass of CO2 emitted from all activities as a ratio to the average mass of solid waste generated by households. Reducing our solid waste will probably reduce out CO2 emissions, but not by 40 kg per kg of solid waste reduction. Indeed, necesarilly by conservation of mass, not by more than 3.7 kg CO2 per kg solid waste, although the CO2 equivalent may be higher in that some of the waste may be released as methane.
If you want a good series of articles on how to personally reduce CO2 emissions, Shrink is a good place to start. Others probably have other usefull recommendations.
Obviously this is a typo. Should be "17 metric tons". Further, the link underneath quotes 17.2 tons number in 2009 - four years ago. Since then, that value has improved (down to maybe 15) because USA emissions declined in last 3-4 years while population keeps increasing.
Tom, thanks for the link to Shrink--what a great site!
Chriskoz, thanks for pointing out the typo, now corrected.
I second the thanks for the link to Shrink - it's a site that deserves to become very popular. It reminds me that I need to do more doing.
I'm with Wili here. I thought the article was about our trash producing 40 pounds of CO2 daily.
I guess the article is, as Tom states, trying to quanty our CO2 output with a comparison to somethign we can relate to, like trash output? Is this like the comarison the the Hiroshima bomb and AGW heat output?
A somewhat confused Caiti.
Nice article, thanks! This is a good way to illustrate the amount of CO2 being released.
I especially was interested in the comment in the 3rd last paragraph:
"the CO2 emitted by fossil fuels will have an ultimate heating contribution millions of times larger than the energy released from burning it".
I've made an estimate along similar lines, but my results are nowhere near as dramatic. I find that of the energy released by burning 1 kg of coal, somewhere between 1/4 and 1/2 will remain permanently in the atmosphere due to the global warming effect of CO2 that is released.
Details of the estimate are at www.sunoba.blogspot.com, post for 6 June 2011.
Excellent obervation of the fact that the atmosphere is our preferred "dump". It's so handy. Just burn things and they magically "disappear". Take note of the growth of this approach with the current expansion of incineration and its fig-leaf clothed sibling, waste to energy. These along with other clever schemes like cooking plastic to turn it into a handy liquid fuel are all moves to replace the cost of landfilling with that free dump, the atmosphere.
In my trash handling, I separate out the organics for our city operated composting, and my glass, metal, plastic containers, paper and cardboard for conventional recycling. What's left is mainly non-recyclable plastics. I think of it as my contribution to carbon sequestration. Fossil fuels that were converted to plastics and then reburied.
I know people are very concerned about plastics in the environment and thus the great war on plastic bags. I like free plastic bags (mainly made from natural gas) because I make sure all mine go to the landfill. The plastic bags that get into the environment as a hazard is a behavioral problem known as littering. Now, in Canada, all paper money bills have been replaced with new counterfeit resistant plastic money bills. Consider that! Billions more pieces of plastic manufactered and circulating through society. Does this represent an environmental problem? I think not. There is a strong economic incentive not to throw your cash onto the ground so it doesn't happen.
Bottom line, burying plastic is the cheapest fossil carbon sequestration program I can imagine.
Another confusing aspect of this otherwise excellent article is the question of the source of the CO2 being measured. We humans, like other animals, release CO2 when we exhale. But the CO2 we breathe out does not raise the level of CO2 in the atmosphere, because the CO2 we exhale comes from the carbon in our food, which was recently extracted from the atmosphere by plants during the process of photosynthesis. What's not clear is whether the CO2 discussed in this article is only CO2 derived from fossil sources, or does it also include exhaled CO2?
Joel, if you follow the link for the source of 17 tonnes of CO2 emissions, you find this statement:
"The data only considers carbon dioxide emissions from the burning of fossil fuels and cement manufacture, but not emissions from land use such as deforestation."
So this is total emissions for a country from CDIAC inventory divided by population. It includes emissions by businesses as well personal use.
Further to scaddenp @11, that only fossil fuel and cement manufacturing emissions are not included means that CO2 emissions from human respiration is not included (as it should not be). It does mean, however, that US emissions are slightly over estimated as the US has been a net sink for CO2 due to land use change. Globally, however, land use change is a net source of CO2, accounting for about 20% of all emissions.
Using EPA figures, US land use changes result in net emissions of -800 million tonnes of CO2e per annum, out of 6,700 million tonnes of CO2e per annum. That is, emissions from fossil fuels and cement manufacture would have been 7,500 million tonnes per annum absent the regrowth of forests, draining of swamps and other land use changes. The "e" means they are recording CO2 equivalents, ie, the total emissions of all greenhouse gases measured in terms of equivalent effect of CO2.
Recalculating for CO2 equivalents, and using the 2011 population, that means US citizens dump 58.8 kg of CO2e per day, or 53.5 kg CO2e for each kg of solid waste they dump. Thus, the overestimate by ignoring land use changes is more than made up by the underestimate of the effect by considering only CO2.
AGU meeting 5-9 Dec 2011 has Davied Archer et al graph showing residual CO2 in air after future years as:
100 52%-79%
200 48%-74%
500 36%-68%
1k 32%(24% outlier)-61%
2.5k 21%-50%
3k 19%-44%
10k 10%-32%
Since 2.5ky is only a small fraction of forever, the "Most of the CO2 in the air will stay there essentially forever" is somewhat hyperbole and contradicts the following "for many millennia". Fine for social-science of course (human lifespans & whatnot) but unsuitable as a physical science comment.
Tom@12,
Thanks for that important update.
So the numbers in this article appear to underestimate (contrary to my previous assertion) US emissions when grant total CO2e is considered which is reasonable.
It's also worth noting that US land use changes are part of terestrial carbon sink when total CC budget is considered, therefore land use emission importance, or "seriousness factor", is smaller than the "seriousness" of 100My old fossil carbon. Therefore, I agree with the land use can be exclused from this consideration.
As a side note, I want to mention that US, similar to many developed countries) export lot of their emissions to G77 countries. Lots of products and goods requiring energy to produce therefore having high C footprint, are produced in countries like China and then imported to US for consumption. Emissions used to manufacture the products are attributed to China. If we attribute them to US, calculating the more proper "total consumer emissions", the average US citizen would "dump" even more CO2e in the air. Has anyone done such "consumer emissions" calculations and can show the numbers?
grindupBake@13,
Your critique is inaccurate. You argue that:
while the sentence in the article "Most of the CO2 in the air will stay there essentially forever"
Note that "essentially forever" is different than "forever", so your critique does not aply. I think that 2.5ky can well be considered "essentially forever" is human lifetimescale, especially the lifetime of those who only want to "enjoy" the benefit, or to pocket the profit from the continuous FF burning. Therfore, "essentially forever" should not be considered a "hyperbole" here.
grindupBaker @13, the graph you are thinking of is from Archer et al, 2009:
It should be noted that the percentages you give are for a one of, instantaneious dumpt of CO2 into the atmosphere. As it happens, just 44% of all human emissions including those from landuse change currently remain in the atmosphere. That means the reduction will be to 60% of the current CO2 anomaly over the next couple of thousand years, ie, to about 25% of the total emissions.
The aphorism is intended to place things in perspective in human terms, not geological terms. In human terms, 2.5 ky is the age of western civilization, dating from its origins in ancient Greece. It it 3 times the duration since the early beginnings of modern constitutional government with the signing of the Magna Charta. It is 10 times the duration since the signing of the declartion of independence. In a world in which governments have difficulting pursuing policies with a time scale greater than the electoral cycle, it is forever.
Even form a geological perspective, however, the increase in CO2 is noticable. It will not finally return to natural levels until a million years from now, 80 times the duration since the invention of agriculture, and five times the duration of our species.
(Note: the duration to eliminate excess CO2 from the atmosphere depends critically on the amount dumped, with significantly shorter times to a given percentage remaining with lower levels of cumulative emissions.)
chriskoz @14, emisssions from LUC are considered distinct from those due to the CO2 fertilization effect, melting of permafrost and other feedbacks. Consequently they are not strictly part of the terrestial carbon sink. Nor should we consider them so unless we also want to consider deforestation in the Amazon as also part of that sink. As noted before, while LUC in the US is a net sink, globally it is a net source of emissions. I don't object to the exclusion of LUC or CO2e in popular articles to allow simplicity of communication. However, when queried we should point to more detailed sources that include those complications. Indeed, if we follow Schneider's principle, we should include pointers to such more detailed treatments in the article, or at least indicate that you are simplifying.
Your point about the export of emissions, however, is a good one. I do not know where any such detailed calculation is made, however, the US exports 0.7% of its GDP to China, and imports 5% of China's GDP back. The net effect gives, as a first approximation, that the US trade with China "exports" 5% of US emissions. That is, US emissions per capita would be 5% greater if it manufactured internally the products it currently purchases from China.
Wunderful idea to make the numbers less abstract!
I reposted it with the numbers for germany:
597 kg waste per year ( http://de.wikipedia.org/wiki/Abfall )
11,2 tons of CO2 per year ( http://de.wikipedia.org/wiki/Länderliste_CO2-Emission )
11200kg / 597g = ca 18.76 kg CO2 per kg of waste ...
Tom@17
See graph #4 in this link. It shows the extent to which rich countries are outsourcing emissions.
Scaddenp@11 and Tom Curtis@12: Thanks for your very helpful, informative replies. Now I know much more than I had ever imagined I would know about CO2 emissions per capita, and I've found every additional detail to be fascinating.