


 Arguments


Google Earth: how much has global warming raised temperatures near you?
Posted on 4 February 2014 by dana1981
If you've ever wondered how much global warming has raised local temperatures in your area or elsewhere on the globe, the University of East Anglia Climatic Research Unit (UEA CRU) has just released a new interactive Google Earth layer that will let you answer this question with ease. UEA CRU is one of the scientific organizations that compile temperature data from around the world. Their temperature dataset over land is called CRUTEM4, and is one of the most widely used records of the climate system.
The new Google Earth format allows users to scroll around the world, zoom in on 6,000 weather stations, and view monthly, seasonal and annual temperature data more easily than ever before. Users can drill down to see some 20,000 graphs – some of which show temperature records dating back to 1850.
The move is part of an ongoing effort to make data about past climate and climate change as accessible and transparent as possible. Dr. Tim Osborn from UEA CRU said,
"The beauty of using Google Earth is that you can instantly see where the weather stations are, zoom in on specific countries, and see station datasets much more clearly.
The data itself comes from the latest CRUTEM4 figures, which have been freely available on our website and via the Met Office. But we wanted to make this key temperature dataset as interactive and user-friendly as possible."
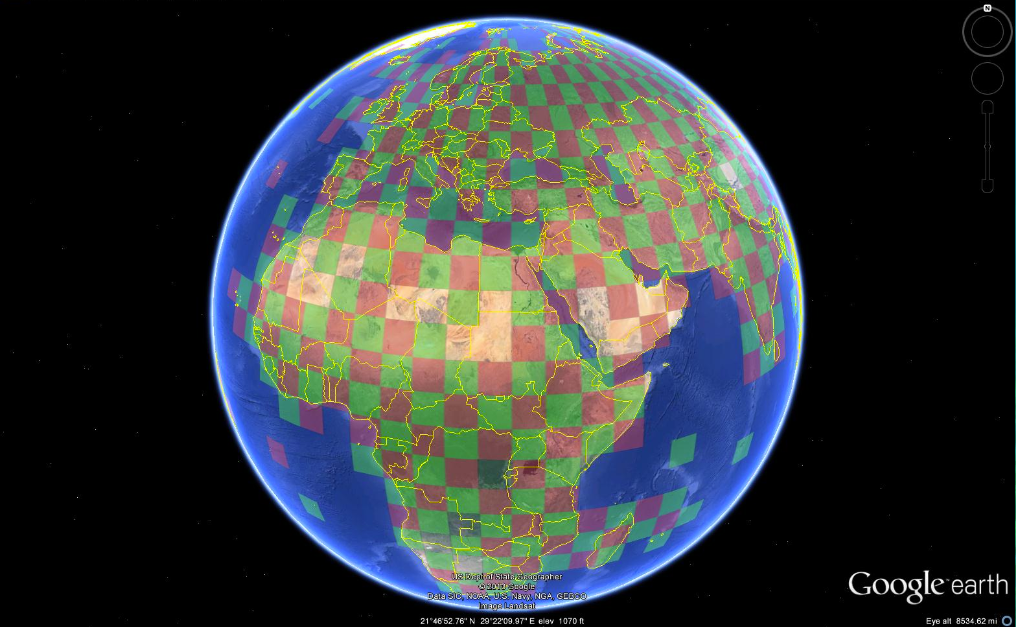
The Google Earth interface shows how the globe has been split into 5° latitude and longitude grid boxes. The boxes are about 550 kilometers wide along the Equator, narrowing towards the North and South poles. The red and green checkerboard covers most of the Earth and indicates areas of land where station data are available. Clicking on a grid box reveals the area's annual temperatures, as well as links to more detailed downloadable station data.
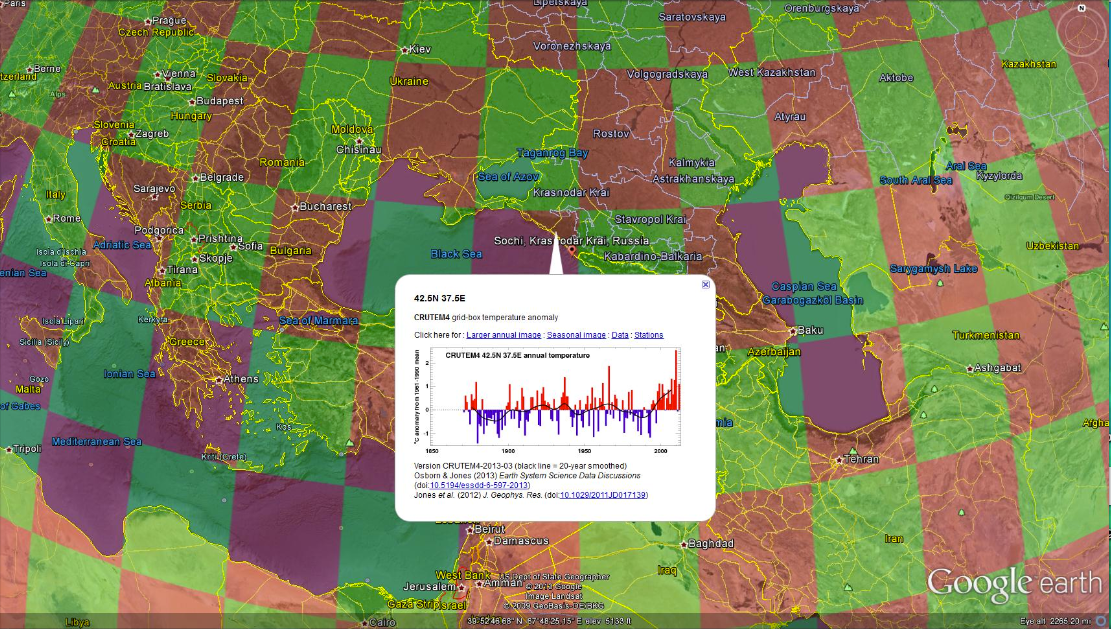
Curious about how much global warming has caused temperatures around the winter Olympics venues near Sochi, Russia to rise? Just click on the grid in Google Earth and a graph pops up showing flat temperatures from 1900 to 1990 followed by a nearly 1°C rise over the past 25 years.
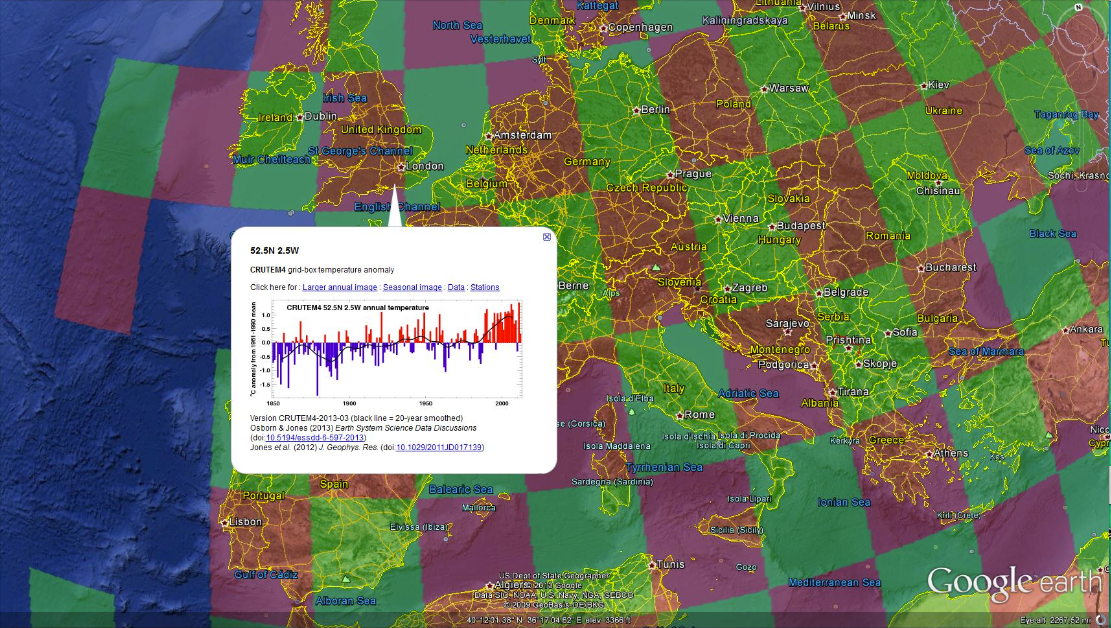
Wondering how much the area around London has warmed in recent decades? The answer again is just a click away, and shows a similar rate of warming to that near Sochi.
This new initiative is described in a new research paper published in the journal Earth System Science Data. Scientists at UEA hope that making the temperature data easily accessible to the public will add another level of quality control. Dr. Osborn said,


It looks like the "Click here to read the rest" link is broken.
Thanks heb0, fixed.
My apologies for the repeated comment. It was a malfunction of my computer
The much duplicated post read:
I am disgusted by the data quality in my city, the capital of Peru:
Note to moderator: it is extremely difficult to include images, because they go anywhere in the comment, now one is superposed to another and cannot be edited.Please help! (there should be two graphs)
I unfortunately deleted one too many copies.
Please, could you tell me how I can edit the images once I inserted them, and how I can stack them below the text?
From Peru:
BEST have lots of Peruvian stations, including some with long records, although many of them require homogenisation. Start from here and zoom out to look for for bold markers with stars in (or clusters to zoom in on).
As expected the southern stations show much bigger trends than the tropical ones.
Love the -11 comment count today! (Here it's more like -15.)
Kevin C:
The data from your link seems better (at least the graphs). Thank you!
It seems the only still active station in my city is the Jorge Chavez Airport in Callao, near Lima. The others are inactive from decades ago.
This is not good, considering that we will be the host country of the next international conference on Climate Change, the COP 20 Lima conference:
http://climate-l.iisd.org/events/unfccc-cop-20/
(the option for inserting links and images do not work well, they cannot be edited and cannot be placed in the desired place. I don't know if the problem is in my laptop or in the website. Any idea? )
BEST writes about the raw data:
“The Berkeley Earth Surface Temperature Study has created a preliminary merged data set by combining 1.6 billion temperature reports from 16 preexisting data archives….. After eliminating duplicate records, the current archive contains over 39,000 unique stations”
The BEST double counting problem originates from reading 16 different archives with different metadata and data.
As I understand, BEST is not writing directly that there is a flaw in respect of double counting. One could read this as a warming flag.
For more details about the double counting of Danish weather station please look here:
http://www.climate-debate.com/forum/berkley-earth-temperature-analysis-possible-flaws--d11-e291.php
and here about BEST:
http://berkeleyearth.org/about-data-set
Klaus Flemlose @8, I have read some of your evidence and I am not convinced that BEST have in fact double counted. There is enough difference between similarly located stations, specifically with respect to latitude, longitude and elevation data, that they may represent differnt but closely located stations (of which there is an extensive history in climatology). Nor am I convinced that you are wrong. I do think, based on the data to hand, BEST should look very closely at the stations that you have identified to ensure that they are not double counting stations. Likewise, however, you should qualify your claims unless you get some more extensive data.
As a further, and very tentative point, from what I know of the BEST algorithm, double counting a few stations in a region with very many stations will not appreciably effect their temperature record. I would, however, like to see that intuition confirmed or denierd by somebody like Kevin C, who has a real grasp of the intricacies involved.
Hi Tom Curtis
Here is the Google Map picture of the double counted Vestervig weather station. There is only one Vestervig weather station.
Here is another example of double counting.
It is difficult to argue that there are two different stations placed in the Baltics Sea.
I have visited the place several times and there is no weather stations out there in the Baltic Sea. The weather station sits close to the lighthouse.
This describes the problem with differences betweenthe metadata in the 16 archieves BEST is using.
Are these data sets altered to take into consideration urban heat?
Of course. See here for discussion and papers.
If i could have some more clarity on the topic, are each of uthese data sets raw or have they been corrected for urban heat effect? I want to use this data but want to know if it's the raw data or not. I know that when they do global estimates they take it into account.
Michael, the data you need will depend very much on what your purpose is. These datasets are for assessing climate change. To be useful for that purpose, you have to have data that is comparable with past records and comparable with other stations. To do this, you have to make adjustments to account for change of instruments, screens, site location, time of observation, change in environment (urban heat effect), etc etc. The procedures and papers relating to these adjustments is very well documented at each data sets source. You might like to at USHCN or GISS for details. The data sets usually have the unadjusted data as well so you can compare.
Of course the BEST project assumed they had done it all wrong and with fossil fuel money set out to do different. Funnily enough they got same answer. They also provide their data and methods - see here. There are other useful links on the page I linked to above. Tamino and Realclimate both have links to the major data sources on their home page. Be sure to read the associated documentation to see whether it is fit for your purpose.
@scaddenp, I have to admit there is a lot to consider when looking at temperature records. Yes I want to find specific temperature graphs, in key areas, but I also just wanted a quick answer to these google earth temperature records. I have not looked into it and have finally got my laptop out of storage to actually use google earth, but I wanted to know if the graphs are reduced to show no warming from urban heat? I wonder because when considering your local regions climate, I don't think urban heat should be taken out, or at least have an option to see the difference.
[DB] Global bold usage removed.