


 Arguments


Ice picks: Five pieces of ice news revealing earth’s ice cover is in serious decline
Posted on 10 June 2014 by Guest Author
This is a re-post from Carbon Brief by Roz Pidcock
Melting ice has filled the newspapers over the past couple of weeks, with a deluge of new research into how the planet's ice cover is being altered by climate change making the headlines.
Coming just a few days after research showing West Antarctic glaciers are in irreversible collapse, today's news that Antarctic ice melt has doubled in a decade was widely covered.
We've taken a look at several new papers that highlight the speed at which earth's vast ice sheets, glaciers and ice caps are diminishing. Put them all together, and it makes for a stark picture.
1. Antarctic ice melt is twice as fast as ten years ago
'Antarctic ice losses have DOUBLED in less than a decade with 159 billion tonnes of ice melting each year', reads today's Daily Mail headline. The Guardian opts for, 'Doubling of Antarctic ice loss revealed by European satellite'. The Times says 'Antarctic melt rate worries scientists'.
All three headlines stem from a paper published yesterday in Geophysical Research Letters, which finds the volume of ice melting into the ocean from Antarctica is twice as large the average between 1992 and 2011, now raising global sea levels by 0.45 millimetres a year.
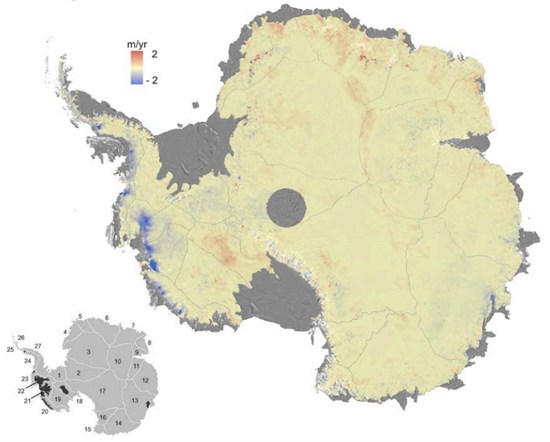
Change in height of ice, as measured by CryoSat-2. Blue shows areas losing ice, red show areas gaining ice in the last three years. The biggest ice loss is in the Amundsen Sea sector (numbers 21 and 22 in inset image. Source: McMillan et al., ( 2014)
The University of Leeds scientists study uses three years of data from the European Space Agency's CryoSat-2 satellite, launched in 2010. The satellite now sees five times as much area as before, totalling 96 per cent of the total Antarctic continent.
David Vaughan from the British Antarctic Survey told The Guardian why this is so important:
"Through some very clever technical improvements, [the scientists] have produced the best maps of Antarctic ice-loss we have ever had. Prediction of the rate of future global sea-level rise must be begin with a thorough understanding of current changes in the ice sheets - this study puts us exactly where we need to be."
Across Antarctica, the average height of the ice is dropping by 1.9 centimetres per year, the data shows. East Antarctica is staying roughly the same but West Antarctica is seeing big losses, where ice melt is 31 per cent faster now than between 2005 and 2011. Ice loss from glaciers along the Amundsen coast has tripled over the past two decades, the paper explains.
2. West Antarctic glaciers are collapsing, and it's "unstoppable"
Eye-catching words like "collapse", "irreversible", "unstoppable" and "catastrophic" peppered media coverage last week of two papers charting the demise of West Antarctic glaciers.
The first paper in Science looked at how changes in wind and ocean circulations are bringing warm water in contact with the underside of the Thwaites glacier - one of the biggest in West Antarctica - melting it from the bottom up. Similar things are happening with other glaciers across West Antarctica, explained the second paper in Geophysical Research Letters.
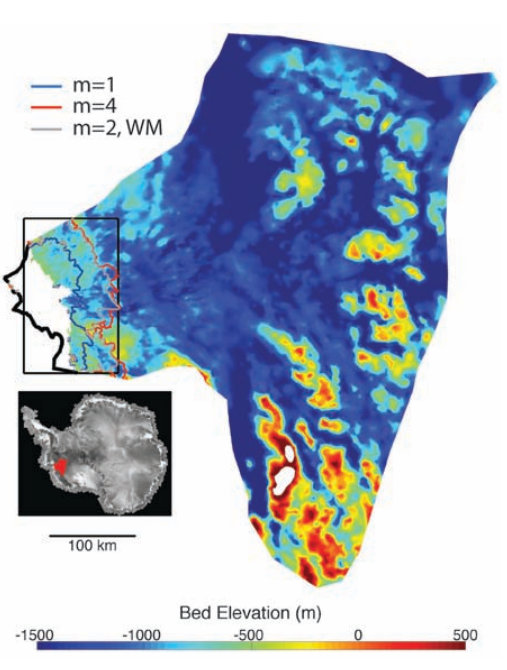
Radar image showing the ice-shelf edge of the Thwaites glacier in West Antarctica (thick black line) and the position of the "grounding line" - where ice meets ocean and goes afloat - under a high warming scenario (red line). Source: Joughin et al,. (2014)
Not only are the glaciers shrinking, but there's nothing to stop them melting completely. That's why scientists are talking about the glaciers' collapse as "irreversible" and "unstoppable".
And without the huge glaciers to prop up the interior of the ice sheet, much larger areas of West Antarctic ice will start slipping into the ocean. This would ultimately raise sea levels by three to four metres, though that would take several centuries, say the scientists.
Here are some key questions on both bits of research answered by experts.
3. The Greenland ice sheet could melt faster than scientists first thought
The Greenland ice sheet may be more vulnerable to climate change than previously thought, scientists reported in a Nature Geoscience paper on Sunday.
The team of US scientists discovered deep channels extending horizontally below the surface of the Greenland sheet, which mean large parts of the glaciers lie on land that's below sea level.
Just like in West Antarctic glaciers, warm water coming into contact with the edge of the glacier forms vast pools under the ice sheet, melting it from the bottom up, the paper explains.
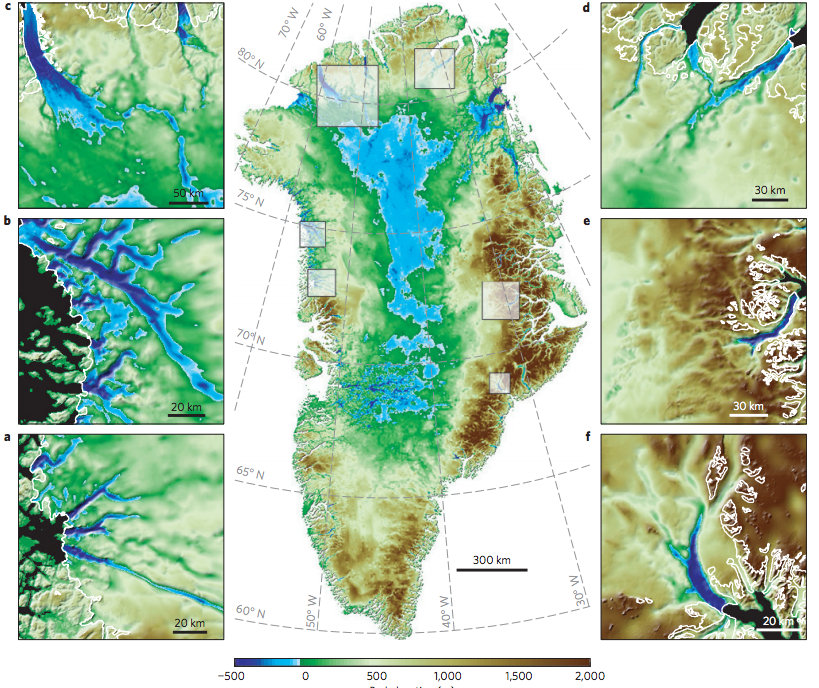
Map of Greenland elevation: Ice covered areas that sit below sea level are marked in blue. Smaller images show individual glaciers and submarine trenches. Source: Morlighem et al. ( 2014).
4. Other ice caps and glaciers in the northern hemisphere are melting faster too
As well as the Greenland and Antarctic ice sheets, glaciers and ice caps on land are also melting under the pressure of rising temperatures and contributing to sea level rise.
A new paper published today in the Journal of Climate looks at ice-covered areas greater or equal to 0.5 square kilometres in the Northern Hemisphere, excluding the Greenland Ice Sheet.
The researchers built a model of glacier and ice cap responses to past temperature and snowfall changes, testing it against nearly 1500 measurements from 78 locations worldwide.
The scientists estimated the total contribution to sea-level rise from ice caps and glaciers was 0.51 millimetres per year between 1979-2009. But it's speeding up - looking just at the recent decade, 1999-2009, the contribution is 40 per cent higher, at around 0.71 millimetres per year.
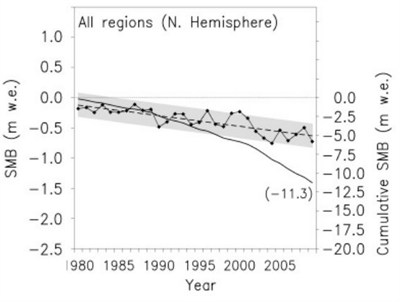
Surface mass balance of ice caps and glaciers in the northern hemisphere - excluding the Greenland Ice Sheet - showing a loss (dashed line) between 1970 and 2009. Annual values are marked by black circles. The solid black line is the cumulative ice loss over the period. Source: Mernild et al., ( 2014)
5. Soot from forest fires contributed to unusually large Greenland surface melt in 2012
Finally, a new study published today explores the reasons for why an unusually large amount of the surface of the Greenland ice sheet melted in 2012. This exceptional summer saw more than 97 percent melt away, far more than the next biggest event almost a century before in 1889.
The team of US scientists examined the layers of ice and snow in six ice cores, concluding that a combination of exceptionally high temperatures and soot from northern hemisphere forest fires, known as black carbon, drove unusually extensive surface melt in both cases.
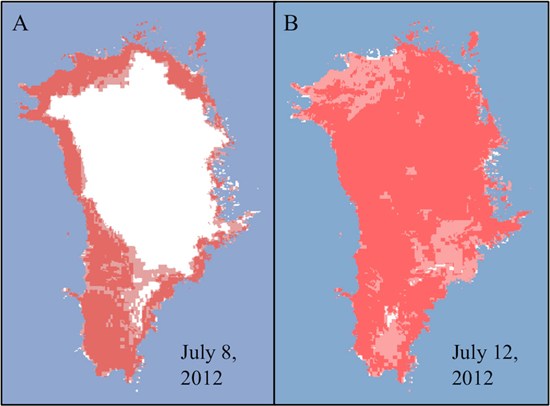
Greenland surface melt on two separate days in July 2012, the latter after high temperatures and soot from forest fires triggered widespread melting. Image courtesy of Dorothy Hall, NASA/GSFC. Source: Keegan et al., ( 2014)
Surface melting doesn't contribute to sea level rise because the water percolates back into the snow and refreezes. But it does reduce the reflectivity of the ice, known as albedo, with consequences for how much sunlight the Arctic region absorbs, and how much ice stays frozen.
Together, with soot which also decreases reflectivity, the ice albedo was pushed below a certain threshold in 1889 and 2012, making it vulnerable to rapid ice loss, say the authors. Lead author Kaitlin Keegan explains such big surface melting events won't be out of place by 2100:
"With both the frequency of forest fires and warmer temperatures predicted to increase with climate change, widespread melt events are likely to happen much more frequently in the future."


Any chance you could also comment on this recent paper?: Dustin M. Schroeder, Donald D. Blankenship, Duncan A. Young, and Enrica Quartini, (2014), "Evidence for elevated and spatially variable geothermal flux beneath the West Antarctic Ice Sheet", PNAS, doi: 10.1073/pnas.1405184111
http://www.pnas.org/content/early/2014/06/04/1405184111.abstract
I'm already seeing denialists jumping all over it, claiming it shows that GW is not responsible for any of the melt in Antarctica.
Rather obviously, the research says little about the trend in sub-glacial geothermal flux. Perhaps the trend has been negative over the last five hundred years. Perhaps positive. Perhaps the diminishing ice is allowing increased geothermal activity. The paper is really about a new method of determining sub-glacial geothermal flux.
So..."rather obvioustly"...nothing is obvious?
I mean given what the report says it should be obvious that a time series on sub-glacial geothermal activity doesn't exist. This is a potential start to such measurement, and it's an important indicator that such activity is significant, but no one associated with this study has anywhere claimed that flux under WAIS is increasing or decreasing on the scale of climate, so no claims of "this instead of that" can be made.
If the WAIS is rapidly deteriorating, and the cause is increasing geothermal flux, what an remarkable event this is. When was the last time any major Antarctic glacier rapidly deteriorated as a result of such flux? Not in the last 1.5 million years, I'd wager.
That's not to dismiss the effect, of course. Flux may be constant, but it still plays a critical role in helping along the decline of the WAIS. This is quite bad news.
Hmm. Those fluxes are quite high and they claim validation against ice drilling. I would expect volcanic fluxes to vary somewhat in time as well but to be highly localised. However, I dont think you could extend that to be the cause of rapid calving and ice-shelf loss.
@scaddenp #5:
If geothermal flux was increasing it could contribute to basal melt, which would in turn lubricate and accelerate flow. So you could make an argument that increases in geothermal flux could trigger increases in caving rate.
I agree it lubricate flow but moving back the grounding line? Alternative hypothesis - the observed warmer ocean is eroding the shelves and glacier ends. What seems most likely? Also consider that fluxes this high are very localized.
I did a quick search for any evidence of geothermal flux temporal change, to no avail. What is known is that, of course, geothermal flux increases a lot when a magma bubble goes closer to the surface and triggers dyke creation - it comes with seismic long period events and increased hydrothermal activity. And using geothermal heat reservoir to produce heat or electricity "depletes" them, creating a "cold" bubble that can be replenished over time (a loooong time)
So, changes in geothermal flux are *possible*. Even on a 10 year timescale.
BUT. I may be wrong, but I do not see any natural mechanism other than a volcanic system reactivating under the glacier ; such a system should be detectable by an increase of LP events recorded by seismic stations. Otherwise geothermal flux should be quite stable, and therefore can not explain the *increase* of calving speed.
Nor can it explain the glacier front retreat. My 2 cents.
Context here might help. 200mW/m2 is 4x average flux, but flux through an active volcanic area (eg the Taupo Volcanic Zone) is around 700. Thwaites is high in places but not extreme.
This calculation was posted at RealClimate by Meow:
"Alright, let’s do some basic physics. Let’s assume, for the sake of argument, geothermal flux of 200 mW/m^2 over the entire Thwaites catchment, and also that all of that heat goes into melting the overlying ice (as opposed to, say, heating it to the melting point). The Thwaites catchment has an area of ~189,000 km^2. Water ice has a heat of fusion of 333.55 kJ/kg. A 200 mW (=0.2 J/s) flux is 6.3 MJ/yr (0.2*3600*24*365). That flux will, thus, melt 18.9 kg of ice/yr. Since the flux is distributed over a m^2, the melt rate will be 18.9 kg/m^2/yr, or 3.6 Gt/yr for the entire catchment.
The actual melt rate for the Thwaites, exclusive of calving, is ~70 Gt/yr (Depoorter et al, doi:10.1038/nature12567, http://www.staff.science.uu.nl/~lenae101/pubs/Depoorter2013.pdf , at Fig. 1)."
So, even assuming a geothermal flux almost 2x that in Schroeder, and that all of it melts ice, geothermal flux contributes, at most, 3.6/70=5.1% of Thwaites’s meltwater, and probably much less"
There are some other informed comments about this paper. It appears that the estimated heat flux is 2-4 times higher than average in this area. I remember having seen a calculation of the effects of a volcanic erruption in Antarctia several years ago (sorry no cite). It also melted a km3 or 2 of ice, no big deal in the long run. Keep in mind how big the basin is and how thick the ice is.
I imagine the paid opinion-shapers are picking up on the word "elevated" and turning it from a spatial reference into a temporal reference. I don't have the stomach right now to go look.
Saw the Watt's headline. Skeptical about the vast body of scientific evidence and not in the slightest skeptical about a misreading of a paper. Or just ordinary clutching of any "its not us" straw.
I believe the main significance of the geothermal heat paper is that there will be a bit more water under the glaciers in the warmer areas. That could act to reduce friction and thus increase flow. The last sentence of the papers says just that:
"Our results further suggest that the subglacial water system of Thwaites Glacier may be responding to heterogeneous and temporally variable basal melting driven by the evolution of rift-associated volcanism and support the hypothesis that both heterogeneous geothermal flux and local magmatic processes could be critical factors in determining the future behavior of the WAIS."
If Greenland is topographically like a bowl, wouldn't flow from melt beneath the ice actually send water inland and then in December-Febuary it would all solidify. Seems to work against it all getting into the sea. Any slipping would get welded in place. Only the outer fringes would not fall under this characterization.
I read the comments about the 200 GT of annual melt from Greenland (10 km3 just one piece at Twaites), when 2012 is compared to 2011. When I searched for the 2013 net melt over 2012, I found clues that there was no net melt. It seems that typically there isn't any significant net loss per year with the one exception of 2012. More research from decades ago revealed that 125 cubic miles calves from Greenland annually, which equals the replensih rate from snow, which falls every month there. 10,000 to 15,000 calves of ice break off the coastal glaciers of Greenland annually. The alarm of one being (10 GT) 1.9% of the 125 cubic miles of annual flow seems pretty minor. Greenland, An area from Denver to NYC that reaches 750 miles in width and for which the normal ice pack temp hits 10 F in July as an annual max would get plenty of snow and upon which any soot would be soon covered in snow.
To find some perspective on the great ice loss of 2012, I took a piece of graph paper that was a grid of 35 by 42 squares representing the 2,850,000 km3 of ice on Greenland, the 47 cubic mile loss of 2012 was only 0.103 of one of the 1470 squares of the page. Then, If I were to attribute that loss to too much CO2, and then consider that the US is responsible for 14.14% of Global human produced CO2, then the US could possibly be responsible for (.103) *(.1414)=.0145 of a square on the page (the melt). And if we could grow our US population by 4% over the next year and still cut CO2 creation by 10%
then we could shrink our contribution to that loss of ice by (.0936)*(.0145)=.00136 of one square the next time it might happen. That's where I begin thinking 'news' of a great Greenland meltdown at a recently doubling rate is intended for low information people.
[PS] Please cite your sources - especially for no net melt or I'll delete for sloganeering. You do realise that the published losses come from mass measurement (GRACE) or altimetry change not fiddling with graph paper? You might get better insight to greenland topography and its implications if you read the Morhighem paper cited in the article.
You might also want to look at Co2 limits will harm the economy
jetfuel@14,
You begin by analysing the Greenland icesheet melt numbers in your first paragraph.
Then you try to attribute the percentage of GIS melt to US CO2 emissions in second paragraph.
Finally, you conclude:
How does such conclusion follow from your post? IMO, your conclusion is irrelevant to the preceding arguments, i.e. it is illogical hand waving/trolling.
Firstly, while considering melting of GIS, you should consider total climate forcings, not just forcings from US CO2 emissons.
Secondly, while considering the melt rate variability (apparent doubling in X years), you should concentrate on just that. Your assertion that an annual melt takes "only 0.103 of one of the 1470 squares" is irrelevant ands patologically illogical. We know that it will take many centuries at the current rate to melt the entire GIS.
If considering the "doubling of melt rate" you should lokk e.g. at this picture:
and figure out how the slope of the green line changes. We can clearly see that it accelerated lately.
jetfuel wrote "If Greenland is topographically like a bowl, wouldn't flow from melt beneath the ice actually send water inland and then in December-Febuary it would all solidify."
not necessarily. While Greenland is topographically like a bowl, the rim is not of equal height around the edge, which means that rivers could form, eroded in the gound under the ice, that transport the meltwater to the sea. These seem quite evident in the figure above, e.g. on the West coast at about 68 North. The fact that any "inland sea" that forms under the ice would be under several kilometers of ice sheet pressing down on it, suggests it will be unlikely to have a very great volume, so it is not a given that large amounts of meltwater can pool there.
The fact that independent measurements show that there is ice loss in Greenland suggests there is a flaw in your theory that suggests there is little or none.
One can actually see quite well from the topographical map that Greenland is not a bowl. It's more like a broken dish, filled well over rim level with ice cream. A few of the cracks in the bowl run nearly to the base of the dish. A lake would undoubtedly form in the base of the dish, especially with rebound lifting the land, but most of the water in the current ice mass would be lost to the oceans during the melt period. The mass of the ice cream would squeeze the lake water out the cracks.