


 Arguments


Mercury Rising: 2014 Likely to Surpass 2010 as Warmest Year on Record
Posted on 27 November 2014 by Rob Painting
The monthly global analysis for October has been released at NOAA's National Climatic Data Center (NCDC) and it reveals that global surface temperature for October 2014 is the warmest October in 135 years of record-keeping. This follows on from the 2nd warmest April, and the warmest May, June, August, and September, ever recorded. In fact the first 10 months of 2014, January to October, are the warmest such period ever recorded, and 2014 is very likely to end up as the warmest year - taking over the title from the previous record year in 2010. Other surface temperature data sets, such as NASA GISTEMP and the Japan Meteorological Agency, also have 2014 on pace to break the annual record.
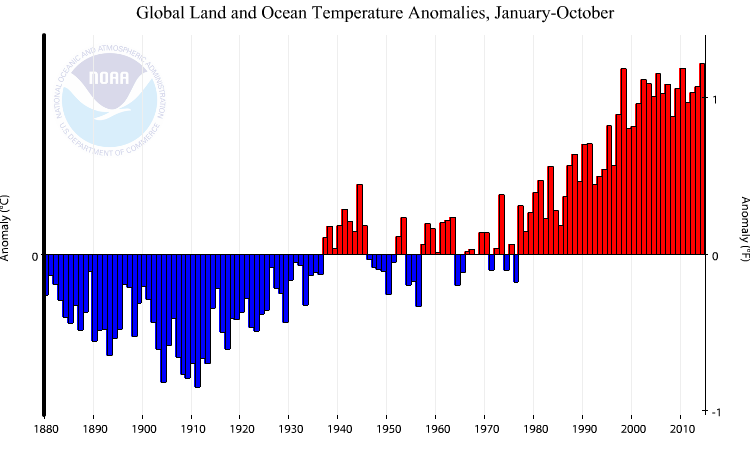
Figure 1 - Global surface temperature anomalies for January-October from 1880-2014. As indicated, 2014 is now the warmest January-October period on record - beating out 1998 and 2010 (tied) by 0.02°C. Image from NOAA NCDC.
With two complete months of data yet to come, it may appear premature in declaring 2014 a likely record-breaker, but 2014 is different to the evolution in surface temperature during 2010 - the previous record holder. Record warm years are typically associated with the development of El Niño events, whereas in 2014 El Niño is yet to even put in an appearance.
El Niño is a periodic, and naturally-occurring, phenomenon in the Pacific Ocean, a time when anomalous heat is discharged from the tropical ocean in response to a temporary relaxation of the trade winds. El Niño typically builds up mid-year, peaks December-January, and then winds down the following year. The 2010 record occurred in the 2nd calender year of an El Niño event and surface temperatures fell throughout that year after April-May. In comparison, 2014 has seen warming from March onwards. 2014 and 2010 are on two contrasting trajectories; a mostly cooling trend in 2010, and a general warming trend in 2014.
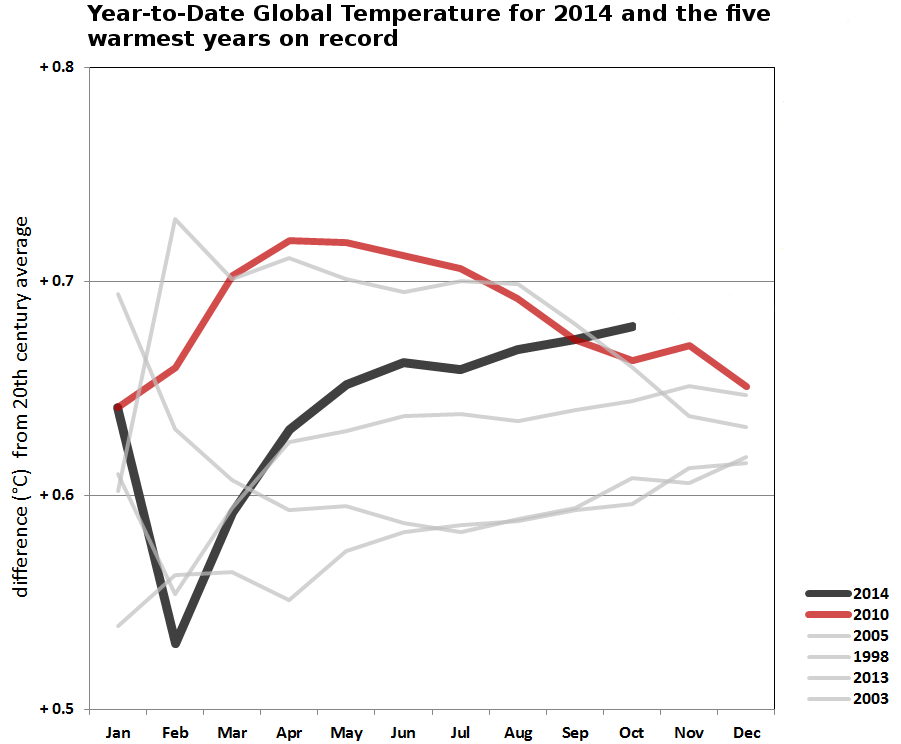
Figure 2 - Comparison of the year-to-date 2014 surface temperature anomaly (or horse race if you like) to the current five warmest years on record. 2010, the previous record warm year, is the key area of interest here - 2014 now has its nose out in front. Image adapted from NOAA NCDC.
So the main reason why 2014 is likely to break the record is that El Niño may only just be forming, and surface temperatures are therefore expected to stay high. Even if El Niño does not take hold, a sizeable Kelvin wave is heading east across the subsurface Pacific Ocean. When this blob of warmer-than-normal water reaches the surface ocean in the eastern Pacific it's likely to keep surface temperatures elevated over a large area.
Figure 3 - Pacific Ocean equatorial warm water volume anomalies for November 2010 (top panel) and November 2014 (bottom panel). Unlike 2010, when intense trade winds kept heat buried in the western tropical Pacific subsurface ocean, November/December 2014 looks assured of a warming boost as a pool of warm water (Kelvin wave) heads east toward the American continent and surfaces. Note that these are anomalies (deviations from the norm), not absolute temperatures, so the warmest water is still at the surface. Image adapted from NOAA's TAO Project Office.
Ongoing emissions of planet-warming greenhouse gases, such as carbon dioxide, ensure that global warming will continue for decades into the future, and thus 2014's (likely) reign as the warmest year on record is going to be short-lived - as was 2010's reign. The only outstanding issue is the margin by which 2014 surpasses 2010. For that we will have to wait and see.


Looking at the NOAA figure, it's hard to understand where all the goofy talk about "the pause" is coming from. There is no pause, instead, it is unabated warming continuing despite a Nina dominated or neutral ENSO for many years and despite a sun quiter than it has been for 40 years. Must be those Leprechauns...
True Phillipe, but even with the use of the ol' eyecrometer one can see that the rate of surface temperature rise has slowed since 2000. The record-breaking monthly global sea surface temperatures (upcoming post) this year hint that we may be entering decades of accelerated surface warming (also upcoming post).
Looking at Figure 2, I want to understand why most record warm years have the slope of their "race" declining towards end of year. Would it be because last few months mean NH is in winter season, with more continents, where the temp extremes tend to go low, e.g. recent cold spell in NY - result of melting arctic ice and jet stream perturbations?
Chriskoz @#3: The graph is of temperatures "year to date", so the January value is the average of January only, the February value is January+February and so on. As you average more and more months, the variation becomes smaller.
Christoz, I am not a scientist (first post here) but I think what you are seeing is previous record years started the year as El Nino events and the El Nino conditions then tailed off over the later part of the year. It does make a contrast with this year that is still technically neutral ENSO, but with a lot of heat building in SSTs in the Pacific ... which may mean 2015 will be hotter still ...
Chriskoz, as Reason 4 has correctly surmised, it generally boils down to whether the record occurs in the 1st calender year of an El Nino event or the 2nd. Although El Nino hasn't yet formed, this year has been close to the threshold for a while.
As for the polar vortex/jetstream, that's an area of still fierce scientific debate. That the jetsream has undergone a long-term strengthening, and climate models simulate this under greenhouse gas-driven warming, puts the issue into perspective - a discussion for another day unless you want to find an appropriate thread to continue this.
Make a note to update the "Escalator" graph as soon as you can in 2015.
There is no need to 'wait two more months'. Any 12 month period is a 'year'.
In the NASA GISTemp data set here the average of the 12 months ending in November is 0.05 C warmer than the warmest set of 12 months that occured during the very strong 1997/98 El Nino event, the 12 months ending in Aug and Sept of 1998.
And reviewing the NOAA ONI data set here those peak 12 month average temperatures in 1998 occured 5 months after the ONI had dropped below El Nino levels. Also, the monthly average in the GISTemp data increases dramatically in Sep 1997 even though the ONI is clearly El Nino by April-May-June 1997.
Reviewing the Government of Australia SOI data here those peak 12 month average temperatures in 1998 occured 4 months after the SOI had rise above El Nino supporting levels of -8.0. Also, the monthly average in the GISTemp data increases dramatically in Sep 1997 even though the SOI is clearly El Nino supporting (below -8.0), by March 1997.
It is also easy to see that the 2010 global average temperatures were bumped by an ENSO event (combination of SOI and ONI) that was quite weak compared to the 1997/98 event but still produced global averages higher than the 1997/98 event. And the 12 months ending in October 2014 are only 0.02 below the highest 12 month average in 2010.
This has been presented in many ways by many people. Nothing needs to be 'waited for' to 'show people who are genuinely interested in better understanding waht is going on' that global average temperatures continue to rise with the most prevelant cause being the added atmospheric CO2 from human actvity, with the most significant contribution being from the burning of buried non-renewable hydrocarbons.
The real challenge is figuring out how to get leaders to choose to act responsibly and considerately rather than hoping to promote popularity for inconsiderate irresponsible profitable and pleasurable activity.
Adding further to #8:
NOAA allows you to see the 12 month average anomalies through any month easily at http://www.ncdc.noaa.gov/cag/time-series/global . Just change the "Timescale" at the top to "12-month" and it shows we are currently (October) at the highest 12 month ave with +.68 (vs .65 for 1998 and 2010).
And changing "Timescale" to "Previous 12 months" shows that, despite only covering through Oct, we have had .70+ seven times in 2014! In no other year has the .70 mark been reached more than four times.
Jose_X,
Unfortunately the NOAA site presents data for the same month each year.What you see with the timescale at '12-month' and the month as 'October' is the average of 12 months ending in October for each year. There is no option that shows the month-by-month values of the time series. You have to review the data for each month to find out what all of the 12-month averages were.
Here are the month-ends with 12-Month values that are closer to the 12-month ending in October 2014 value of 0.68 C:
Note that the 12-months ending in October 2014 is still the warmest so far in the NOAA data set, and that August and September 2014 are 40% of the small group of 12-month periods that are just 0.01 degree cooler.
Also note that in the NOAA data set no year before the 1997/98 ENSO El Nino event had a 12-month average in the 0.66 C and above range. In fact the warmest 12-month periods before 1997 were 0.45 C for the 12-months ending in August, September, October, November and December 1995. And 1995 was another weak ENSO event like 2010, yet its temperatures were warmer than the stronger ENSO events before it.
One Planet Only Forever @10.
The NOAA temperature Time Series page you discuss is a bit odd in not provide the obvious option of graphing the full set of monthly anomalies. However, the data displayed below the graph with the option "Previous 12 Months" are the monthly anomalies for the full record.
MA Rodger,
Thank you. I was aware of the way to see the full listing of the monthly anomalies on the NOAA site, however, what Jose_X and I were trying to show was the value of the average of 12-months ending on each month.
The NOAA site allows the average of a wide variety of time periods, from the standard 1-month up to 60-months, to be obtained for any chosen end-month for the set of chosen years, but only for the same end-month in each year.
The NOAA site appears to be set up to allow quick comparisons of a 'calendar month' to the same month in previous years. That quickly allows the evaluation and reporting of how warm a month is compared to the same month in previous years. That is probably more accurate than just comparing all of the months since each month of the calendar year may have a different normal global average value. However, the average of any multiple of 12-months makes the uniqueness of a month no longer relevant since each average contains all months and the same number of each month.
The NOAA site is not set up to quickly evaluate the averages of multiples of 12-months. You have to review the results for each of the 12 month choices. My earlier point was about the lack of need to discuss how warm a 'year is so far'. A more relevant evaluation is 'how warm the past 12-month period has been, which is still a year, just not the more recognized calendar year'.
A similar approach would apply to 'decade averages'. A new decade average can be created from each new month added to the data set. There is no need to wait for the end of a decade to evaluate how decade averages are changing.
Of course, with the rather random significant variations about the norm that occur in the global average surface temperature the better average to track to minimized the aberrant fluctuations would be 30-years or longer.
The NOAA monthly anomalies can be copied to a spreadsheet to evaluate these longer averages. However, it would be helpful if the NOAA site was set up to allow these types of evaluations to be presented.
A related point is the extent of Arctic and Anatarctic sea ice.
The NSIDC sea ice extent tracking here shows that, although the Antarctic maximum sea ice in 2014 was a record level of extent significantly larger than any previous year on September 22, it dropped rapidly. By early October the 2014 Antarctic extents had dropped to match the 2013 extents after being 0.5 million square km larger than the previous recoird year 2013. And since the end of October the 2014 extents have been consistently lower than 2013, into the range of standard deviation for Antarctic sea ice extent.
Speaking of temperature. Is the SS trend applet has been updated recentely?
Yvan Dutil,
The SkS Temperature Trend Calculator page does not have the 2014 data being added monthly. The Calculator was created in 2012 and has the 2013 data in it, so it appears that it is planned to be updated after the full 2014 sets of data are available.
I have juste checked. It is now updated to october!
No growth detected at 2 sigma to since 1996 still valid. However, it is detected at two sigmas since 1995 ;)
Actually, if you extend the autocorrelation period to 2014, many dataset are significant even from 1996. With HADCRUT4 hybrid v2, I manage do to it starting in 1999.5!
My take on this is that we are currently held captive culturally in the west to the "sporting" sub set with their minds held captive by "Limited News" and their sports focus. They are the big undecided. They dont "back" losers or nerds.
I see it as a challege to get in their heads to find a way to communicate the science (the real deal) so we can reduce the political strength of the denier lobby.
Others have talked about "the race" for the warmest year and I think a race is what we have. To have the views of science take policial power and still be left with a chance of keeping an advanced culture moving into the future. Alternative has been well shown by "Mad Max". A hot dry angry world in decay. A Jock distopia.
So I suspect the race analogy is a worthy mind set to reach/bring along parts of the population more interested in the race than the topic.
Yvan Dutil, the trends from 1995.0 to 2007.93 are:
GISS 0.198+/-0.18 C/Decade
NOAA 0.17 +/- 0.17 C/Decade
HadCRUT4 0.198 +/- 0.181 C/Decade
BEST 0.219 +/- 0.173 C/Decade
Cowtan & Way Krig 0.237 +/- 0.185 C/Decade
Cowtan & Way Hybrid 0.238 +/- 0.197 C/Decade
That is, all surface temperature records show a statistically significant warming from 1995 to the end of 2007. That clearly shows the purported "pause" in global temperature increase is in fact just a decline in average temperatures over the past six years. Further, in that six year period a new record for annual global mean surface temperatures was set in 2010, with apparently a new record about to be set. That shows starkly that the "pause" really just comes down to the effect of two strong La Nina events, one of which included the strongest La Nina configuration in 137 years of record:
It remains a tribute to the skills of deniers at persuasive definition that many people continue to believe there has actually been a cessation of global warming.
RE: My Comment @15,
My mistake. I forgot to enter 2015 as the end year to get the 2014 data.
Tom Curtis @ 19,
I have also noticed a degree of success by delayers (a term I prefer because the smart ones know they can't sustain the delusions they try to prolong), in making-up their definition of the 'hiatus' reference in the IPCC report. The hiatus was clearly intended to indicate a temporary slowing of the rate of increase, not that it had ended. The word-spin-masters created the easy to accept claim that hiatus meant 'no more warming has occurred and the scientists said so themselves, so the science is wrong and can continue to be ignored'. The main audience of the delayers is people who are not really interested in checking things out for themselves. Many people look for what they prefer to hear and are willing to accept whatever sounds believable and agreeable to them (exactly like sports fans who ignore the bad facts about their favorite team and accept the unsubstantiated criticisms of the teams they do not like). That is a tough group to motivate to better understand what is going on, because that better understanding is likely contrary to their preferences and interests.
The UAH November satellite data is out. It shows a 0.33C anomaly from the 1981-2010 period. If that translates to other temperature records, then November will be one of the warmest on record, and pretty much nail down a calendar record.
jimlj @ 22,
Please define "calendar record". If you mean a record for global mean temperature anomaly in calendar year 2014, I don't see how you get that from the UAH data.
I did a quick average of the UAH monthly global anomalies over two complete calendar years. 2010 comes in at +0.40C, 1998 comes in closer to +0.42C while the 2014 averaged anomaly comes in at +0.272C through end of November. By that calculation, in order for the calendar year anomaly for 2014 to equal that for 2010, the December, 2014 anomaly would have to come in at +1.78C, in other words it would have to be the warmest month since December, 1978 (the start of the UAH table) by a factor of about 2.7.
I don't think it'll be a calendar record for UAH or RSS. Very hard for a non El-Nino year to set records in the lower tropospheric temperature series.
One Planet Only Forever, I'll try to be clearer by listing all of the key data that shows that the prior 12 months is currently the highest 12 month average.
12-Month, January, look for the highest value. It's .63C (134th)
12-Month, February, look for the highest value. It's .64C (134th)
12-Month, March, look for the highest value. It's .64C (134th)
12-Month, April, look for the highest value. It's .66C (134th)
12-Month, May, look for the highest value. It's .66C (134th)
12-Month, June, look for the highest value. It's .66C (134th)
12-Month, July, look for the highest value. It's .67C (134th)
12-Month, August, look for the highest value. It's .67C (134th)
12-Month, September, look for the highest value. It's .67C (134th)
12-Month, October, look for the highest value. It's .68C (134th) *** highest ever.
12-Month, November, look for the highest value. It's .66C (133th)
12-Month, December, look for the highest value. It's .65C (134th)
Note, December starts the cycle that is why it is at 134 and not 133. When December 2014 rolls around, it will be the first 135 for the prior 12 month period (ie, that will be the first time there will have been 135 Jan, Feb, ... and Dec).