


 Arguments


2014 SkS Weekly Digest #51
Posted on 21 December 2014 by John Hartz
SkS Highlights
John Abraham's 2014 will be the hottest year on record garnered the most comments of the articles posted on SkS during the past week. John Cook's My AGU talk on tackling climate myths in a free online course generated the second highest number of comments.
Cook's post is based on his presentation at the 2014 American Geophysical Union Fall Meeting in San Francisco, titled Applying Agnotology Based Learning in a MOOC to Counter Climate Misconceptions. Cook explained the approach taken in SkS's upcoming MOOC (Massive Open Online Course), Making Sense of Climate Science Denial.
El Niño Watch
An El Niño winter is coming, which should be good news for drought stricken parts of the nation (U.S).
What Will an El Nino Winter Offer? by Sara Schafer, AgWeb/Farm Journal Media, Dec 20, 2014
Toon of the Week
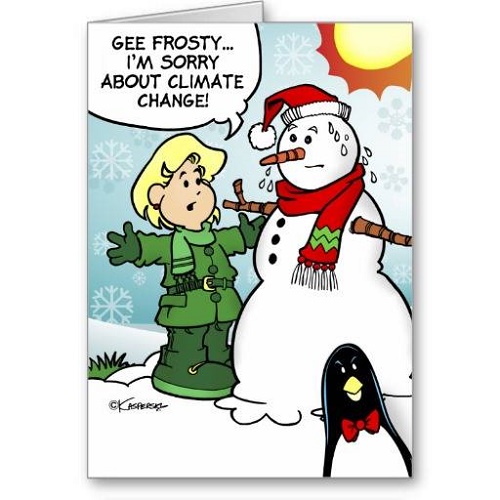
h/t to I Heart Climate Scientists
Quotes of the Week
Green groups and citizens from vulnerable, developing nations bemoaned the lack of commitment and urgency.
“The text went from weak to weaker to weakest, and it’s very weak indeed,” said Samantha Smith, WWF’s chief of climate policy.
“Make no mistake: Lima delivered a pathetically weak outcome, because developed countries like the U.S. are failing to meet their obligations,” said Brandon Wu, a senior policy analyst at ActionAid USA. “A tiny bit of progress does not make up for decades of inaction on both emissions cuts and providing finance for poor countries.”
Others complained that the U.N. process lags woefully behind public momentum for ambitious climate policy. “There is still a vast and growing gulf between the approach of some climate negotiators and the public demand for action,” said Winnie Byanyima, executive director of Oxfam International.
Weak deal at Lima climate talks disappoints climate hawks by Ben Jervy, Grist, Dec 15, 2014
SkS Spotlights
Coming Soon on SkS
- Record-Breaking Sea Surface Temperatures in 2014: Has the Climate Shifted? (Rob Painting)
- Scientists connect the dots from identifying to preventing dangerous climate risks (Dana)
- 2014 SkS News Roundup #51A (John Hartz)
- New Research on Tree Rings as Indicators of Past Climate (Rob Honeycutt & Greg Laden)
- 2014 SkS News Bulletin #7: LIMA COP20 / CMP10 by John Hartz
- Andy Skuce's AGU 2014 Poster: The direct fossil fuel contribution to sea level rise (Andy Skuce)
- High renewables ambition, but fossil fuels still dominate: UK and Germany electricity systems compared (Robin Webster
- 2014 SkS News Roundup #51B (John Hartz)
- 2014 SkS Weekly Digest #52 (John Hartz)
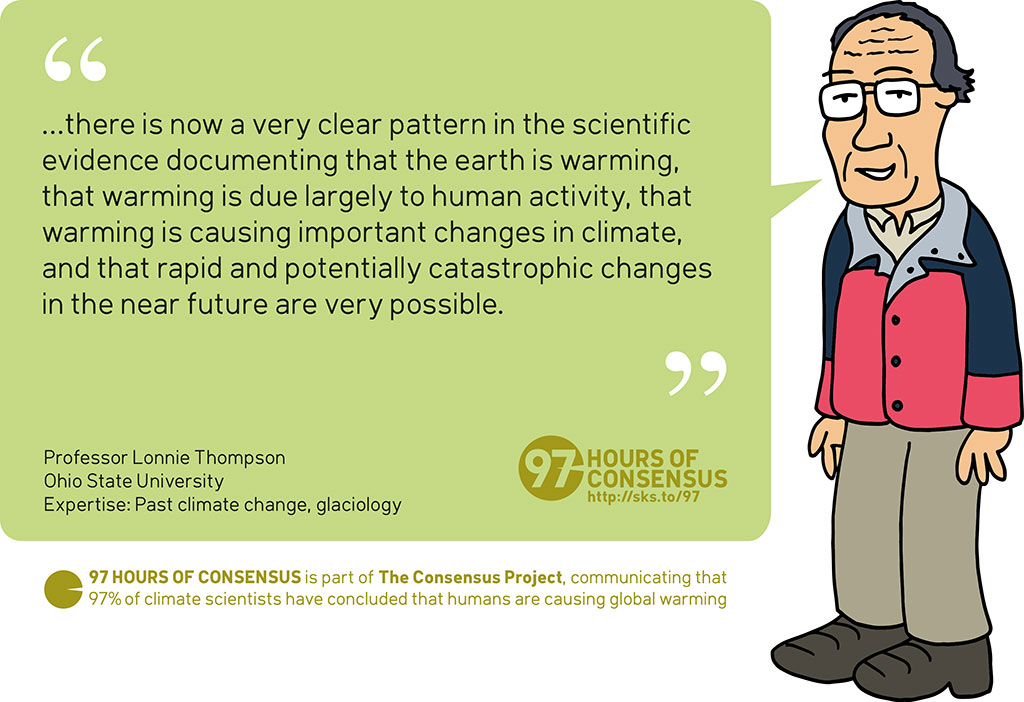
Poster of the Week

SkS Week in Review
- My AGU talk on tackling climate myths in a free online course by John Cook
- 2014 SkS Weekly News Roundup #51B by John Hartz
- Rising air and sea temperatures continue to trigger changes in the Arctic by NOAA
- What happens if we overshoot the two degree target for limiting global warming? by Roz Pidcock
- 2014 SkS Weekly News Roundup #51A by John Hartz
- 2014 will be the hottest year on record by John Abraham
- Two degrees: Will we avoid dangerous climate change? by Simon Evans
- 2014 SkS News Bulletin #6: LIMA COP20 / CMP10 by John Hartz
- Two degrees: The history of climate change’s ‘speed limit’ by Mat Hope & Rosamund Pearce
- 2014 SkS Weekly Digest #50 by John Hartz


New monthly record highs for global average surface temperatures may be set in early 2015. The preliminary daily values for December 23 and 24 of the SOI (here) are at very strong El Nino supporting levels (-38).
We will still need to wait and see what will actually develop but there is evidence that the ENSO will be clearly on the El Nino side rather than the neutral condition that existed at the start of 2014.
So the ones hoping to deny the validity of the climate science, because they dislike the socioeconomic changes it clearly indicates are required, are likely to be in for another year of irrefutable facts accumulating contrary to their interests, especially with the global movement towards curtailing the benefiting from burning of buried hydrocarbons that will be formally strengthened near the end of 2015.
Thanks for that discussion and the link, OPOF. Even more significant than the daily numbers is the fact that the 30-day average is now below -8.
www.bom.gov.au/climate/glossary/soi.shtml
wili,
The recent monthly SOI values (here) that the SOI bar-graph is based on show the 30 day average being below -8 for October and November. However, the 90 day average in the table of preliminary SOI daily values has not yet reached -8.
This most recent spurt of strong negative SOI has already subsided to near zero daily values but it was a very strong negative SOI and was sustained for 2 days.
The related surface temperature of the Nino 3.4 region of the Pacific Ocean is also definitely into the El Nino range (more than 0.5 C above the baseline 30 year average). The NOAA presentation of monthy values here shows that the most recent 3 month average (SON) of the Nino 3.4 region was 0.5 C. And the value for the month of November and the current weekly value for the Nino 3.4 here are 0.9 C, so the OND value will be warmer than 0.5. That is still only the second 3 month average at 0.5 C or warmer. Five consecutive 3-month averages at or above 0.5 C would be highlighted in the NOAA ONI as a noteable El Nino (indicated by the set of values being Red).
It will be interesting to see how the pairing of the stronger El Nino supporting SOI and Nino 3.4 values affect the global averages surface temperatures in the early part of 2015 compared to the start of 2014.
Thanks again, OPOF. "This most recent spurt of strong negative SOI has already subsided to near zero daily values" I just saw that, too. Pretty amazing to me that it can change that rapidly day to day. I hadn't paid that much attention to this index before. Good reason to keep most of the focus on those longer-term averages.
Looking at the graph for 3.4 values, I'm struck by the apparent pattern of ever rising waves--from barely touching +.5 a few months ago, to now staying above it for almost three months (or as you say 2 three-month periods), to projections for next summer of values well above .5. It makes me wonder if we are due for a series of ever worsening El Ninos in immediate upcoming months and years.