


 Arguments


2015 Arctic melting season won't break records, but could wipe the 'recovery'
Posted on 29 July 2015 by Neven
After the record smashing 2012 melting season had ended, Arctic sea ice watchers awaited the following melting season with a mix of anticipation and apprehension. Anticipation, because the annual ebb and flow of Arctic sea ice is one of the most spectacular natural events on the planet, accentuated by the dramatic loss of the past 30 years. Apprehension, because further losses would bring the Arctic yet one step closer to virtually ice-free conditions, an iconic image entailing many unpredictable consequences.
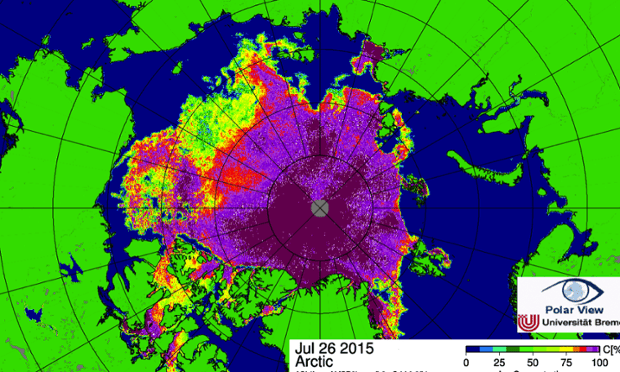
Arctic sea ice concentration on July 26, 2015. Source: University of Bremen.
But just as the previous record low reached in 2007 was followed by a short-lived rebound, the 2013 melting season proved to be sufficiently cold and cloudy to make up for the large amount of thin first year ice in the Arctic. When the following 2014 melting season was relatively cold again, with little wind to compact the ice and transport it to lower latitudes, extent and area numbers yet again ended up well above 2012 levels. Consequently, this year’s melting seasonstarted out with more volume and more multi-year ice.
The ice age distribution map below shows how much more multi-year ice there was at the start of this melting season, compared to 2012:
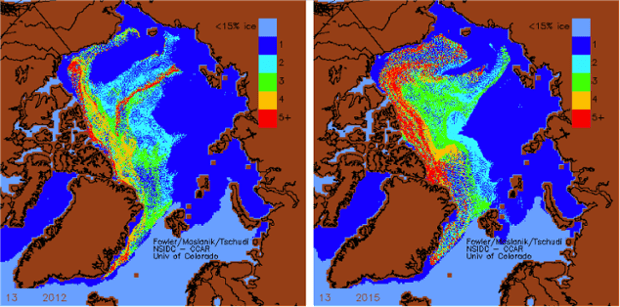
Arctic sea ice age distribution map in spring 2012 vs 2015. Source: University of Colorado.
The first two months of the melting season, May and June, are thought to play a crucial role in how much ice is left in September. The idea is simple: melt ponds that first show up during May and develop further during June, precondition the ice for the rest of the melting season by lowering the pack’s albedo and thus soaking up more solar radiation.
This in turn increases so-called melting momentum, which can sustain a high rate of decrease during the second half of the melting season, even if weather conditions aren’t perfect for melting, compaction and transport. Conversely, if melting momentum is low, chances of new September records are minimal, unless weather conditions during July and August favour huge losses.
Scientists are trying to quantify this influence; not an easy task given the many phases between water and ice and a lack of uniformity across the ice pack. Some researchers try to decipher satellite observations (see Rösel et al 2011), others use models to simulate melt pond cover based on atmospheric data (seeSchröder et al 2014).
This year the melting season started out relatively cold during May and it took quite a while for melt ponds to start forming on the ice pack surface. At the end ofJune, slightly more preconditioning seemed to have taken place compared to 2013 and 2014, because overall temperatures were somewhat higher than in the two prior years. But the amount of melt ponds simply didn’t come close to that of big melting years like 2007 and 2012. Any expectation of 2015 ending up close to record territory despite having more multi-year ice and volume, was effectively put on ice.
However...
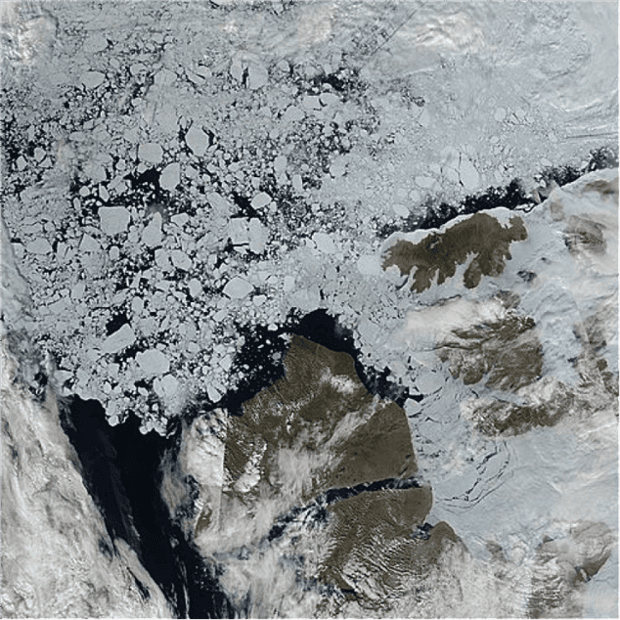
LANCE-MODIS satellite image from July 19th, 2015, showing multi-year ice floes interspersed with large areas of open water and rapid break-up of fast ice in the Northwest Passage. Source: NASA.
As said, despite the importance of preconditioning for the second half of the melting season, exceptional weather conditions can still turn the tables by building up melting momentum. And that’s exactly what the Arctic has seen in the past few weeks.
Sunny weather and anomalously warm temperatures have dominated large parts of the Arctic, most importantly those areas where a lot of the thicker multi-year ice has been moved to during winter. The impact is slowly, but surely showing up on sea ice concentration maps, graphs and satellite image.
There is still virtually no chance of 2015 beating the 2012 record, but something more important for the longer term could be happening. If this weather keeps up – and according to the current forecasts, it will for at least another week – that thicker multi-year ice could receive such a beating that the slight rebound from record low levels is essentially wiped out by the time winter sets in again.


The SkS magnifying glass on the University of Bremen concentration map suggests that there will be an "ice free" passage along the Northern Sea Route by now. Here's a video derived from the higher resolution AMSR2 imagery from the University of Hamburg that suggests that is indeed now the case:
https://youtu.be/i4Z_pGre3oA
One does have to also consider the amount of wood being turned into soot up there though. Might see a strong second half.
I don't like the idea of sine waves forming around the lower 2 standard deviations from the norm... but if multi-year ice is coming back I have to accept the fact.
..are there any time-series graphs on multi-year ice?
bozzza @4.
Do bear in mind that the 100% of Winter SIE being divvied up in this graphic has been shrinking through the decades. 2015 was 10% below the average at the start of the time period in this graphic.
Bozza, here are the 100% values by year for MA Rodger's graph @5:
So, 100% in 1983 equals 16.11 million km^2 (15.5 * 1.0395), while in 2015, 100% equals 14.37 million km^2 (15.5 * 0.927)
I'm actually surprised by the "won't break records" call. Neven's probably right that we won't see a new record low this year, but that doesn't seem anything like a sure thing to me.
Cryosphere Today is showing ice area only around 0.26 million sq km higher than for this point in 2012... and if anything, ice thickness maps seem to indicate that volume loss may have been even more pronounced. Indeed, the only remaining large mass of thick ice on the NRL map seems potentially vulnerable to getting wiped out.
CBDunkerson @7, here are the ARCUS sea ice extent predictions as of July:
Only two lie below the 2012 record, while one matches that record. Of those three, one (from Wadhams) is frankly absurd. I suspect that the 5 million km^2 median prediction may be a bit conservative, but I would be surprised at values below 4 million km^2. I think it would require near perfect melt conditions plus high winds for at least the next month to match the 2012 record, something I don't think at all probable. If I were to make a prediction, I would split the difference between Gavin Cawley's statistical prediction and Wu and Grumbine's model based prediction, and call it at 4.65 km^2
Tom, to clarify... I'm primarily looking at the ice volume record. Both extent and volume hit minimums in 2012, but in some years those have not been linked. Thus, while I agree that it is very unlikely the extent record will be broken this year, I am less certain about the volume record. If NRL is accurate then about half the multi-year ice has already been wiped out and the remaining half seems fairly exposed. That could lead to a steep drop in volume even while extent stays relatively 'high' due to widely spread chunks of thin broken up ice. It'll be easier to see how likely a volume minimum is once the PIOMAS results for July come out.
CBDunkerson @9.
As you say, the July figures will show all but the June figures are also quite telling. July usually gives the lowest PIOMAS anomaly (and July 2015 is but a few days wait away), but the big drops in the anomaly occur during May-June. This year that drop was a meaty 1,200 cu km but July 2015 remains 2,500 cu km behind July 2012 which just too much to catch up. So on that score, I cannot see 2015 Arctic SIV overtaking 2012. As of July 2015, PIOMAS SIV remains the 6th lowest on record but I would expect it to drop below 2014 into 5th spot by September.
Looking at the Cryosphere Today picture has me quite worried. Record or not, who cares? We still have over a month of melting and the truly solid cover (80% or more) has shrunk to a 3 amoeba shaped web that looks less resilient than the solid island that could be seen at the same time in 2012. I find especially worrisome that there is now so much 70% and below cover bewtween the Northern Canadian coasts and Greenland coasts and the more solid coverage farther North. The solid ice island is loosing its anchors.