


 Arguments


Tracking the 2°C Limit - April 2016
Posted on 24 May 2016 by Rob Honeycutt
April is starting to come down off the shockingly high anomalies of the first couple of months of this year. GISS is clocking in a still strong warm anomaly of 1.11°C. This is by far the hottest April in the record, beating the previous April record in 2010 by a full 0.24°C. (Full size graph.)
The Ocean Nino Index is continuing to fall and model expectations are forecasting La Niña later in the year. The satellite data in both the RSS and UAH data fell slightly from last month but I'd expect next month to pop back up just a touch, if past data is any indication. (Full size graph.)
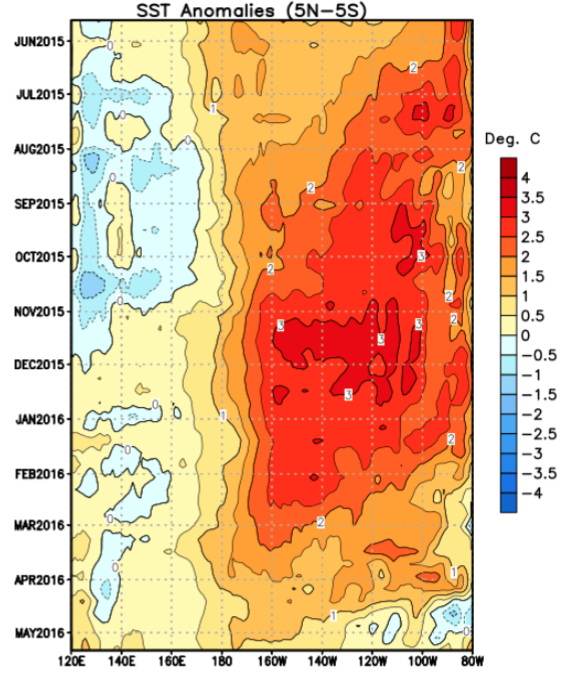
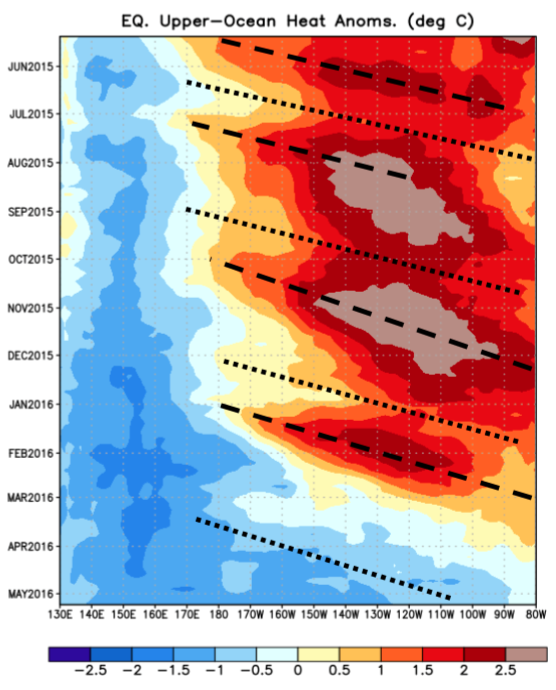
We also have a very nice snapshot of what the 2015/16 El Nino looked like as it progressed over the past year in the following sea surface temperature anomaly and equatorial ocean-heat anomaly graphs.
Researchers are already confidently projecting that 2016 will beat 2015 as the warmest year on record. We're still a few more months before models show us dropping into La Niña territory. If 1997/98 is any indication of how the following months will play out, it's not going to significantly impact 2016 temps.


On the main graph I rather miss those little marks on the horizontal axis that indicate the precise position of the relevant parameter — in this case years. There's a name for them, but I'm damned if I can remember it.