


 Arguments


Global warming continues; 2016 will be the hottest year ever recorded
Posted on 21 October 2016 by John Abraham
We know the world is warming – no factor can explain it aside from human emissions of greenhouse gases. Despite this, people who deny the basic facts of climate change have tried to argue that the Earth is either not warming or is only slowly heating. Well that just isn’t true anymore. The last three years are the nail in the coffin of the deniers of climate change. We have enough data this year to call 2016 as the hottest year ever record – and we have three more months left to go.
So, just how hot is 2016? Well my early predictions are shown in the graph below. I have taken temperature data from NASA and superimposed my predictions for 2016 – it isn’t even close. And by the way, it doesn’t matter whose data you use (NASA, NOAA, JMA, Hadley Centre) the results are the same. 2016 is going to blow 2015 out of the water.
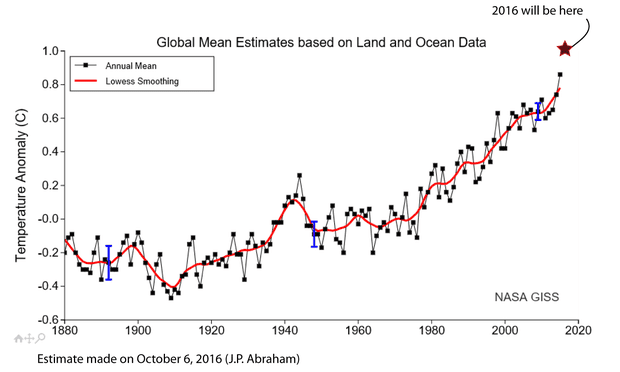
A few things to note. First, these temperatures are surface temperatures that are taken across the globe. But, you can measure temperatures elsewhere and see the same result. Most importantly, measurements in the oceans, where 93% of the extra heat is stored are the best proof of global warming. I recently coauthored an open-access paper on this very topic which interested readers can get here.
You can measure sea level rise as the heated water expands, you can measure ice loss across the globe, you can measure temperatures in the lower part of the atmosphere. It doesn’t matter where; the story is the same.
What is the big deal? Well first of all, 2016 blows away 2015 which was previously the hottest year ever and that had beaten 2014 as the hottest year ever – call this a three-peat. Three records in a row and the last two are by large margins. Does this mean global warming all of a sudden has gotten worse?
No, surface temperatures fluctuate a lot – you can see that in the figure. Temperatures will go up or down from year to year without apparent reason. This is why we are interested in the long term trends. This is also why we are interested in looking at other measures of warming (especially in the oceans). All of our measurements agree with each other – we know the Earth was warming long before this set of records began falling in 2014.
One thing these temperatures can do is enable us to compare computer models with measurements. We’ve seen that models have done an excellent job of correctly predicting the rate of heating of the Earth. My own research shows that in the oceans, the models are slightly under-predicting the rate of heating.
To compare models and measurements at the Earth’s surface, I’ve borrowed a figure from Dr. Gavin Schmidt of Nasa and I’ve overlaid the 2016 surface temperatures. A star shows where 2016 will be. The star should be compared to the three heavy dashed lines in the figure. The upper and lower dashed lines show the uncertainty in the models and the middle dashed line shows the average.


I’m at a loss for words. The graph kind of says it all. It’s just astonishing and concerning.
I take your point that a reasonable estimate of 2016 puts things close to the middle of model estimates.
In a way next years temperatures will be more revealing. A shallow la nina would suggest temperatures have jumped to a completely new level.
Shows that surface temperature data is a remarkably good proxy for global warming, in spite of the many factors that act to contaminate the data. Weather stations were never designed to measure long term climate changes of course. Not mentioned but interesting to note is that 2016 is also on course to break the 1998 UAH / RSS satellite records for the LT.
2016 is definitely above the model mean but it's also true that 2015 was below the model mean by a larger amount, so in spite of the records the surface trend remains at the lower end of projections.
Prepare for a new argument on the SkS list: Global warming stopped in 2016.
It never stops stopping...
On that point, it's worth asking the question, is the anthropogenic forcing now greater than the sum of all cyclical natural forcings over a 10 year interval?
In other words, are we now beyond the point of being able to experience a 10 year pause in the surface temperature datasets?
Art @ 4, the surface still warmed over the last 10 or 15 years, just slowly, so the anthropogenic component was still greater than the other components.
However I think you are basically right, that as the greenhouse effect intensifies it increasingly overwhelms sunspot and ocean cycles.
The last decade had a combination of natural cooling events including sunspot cycles, high aerosols, and a cooling ocean cycle related to the PDO being in a cool phase. This is quite a combination of strong natural cooling events, at one time period, but the most it could do was slow the warming from greenhouse gases, not reverse this. Such a combination of cooling vents may be quite rare.
Art, it very much depends on what you call a natural "forcing". Real natural forcing are changes in solar input, orbitally-forced albedo changes and volcanic aerosols. Anthropogenic forcing certainly overwhelm the first two but a big volcanic eruption near the tropics will still certainly cause short-term cooling. However, when you talk about "natural cycles", I suspect you mean things that are not really forcings but the internal variability as heat is redistributed around a wet planet (eg ENSO). The short-term effects of these on surface temperature (positive and negative) from these easily overwhelm the effect of all climatic forcings - but only on decadal scales.
For looking at climate, you either concentrate on long term trends (which is how climate is defined), or look to indicators that are only slightly affected by ocean-atmosphere heat exchange (eg Ocean heat content, sea level, global glacial volume).
Or another way of looking it, if you looked at individual runs from climate models, (eg look at this figure
can you find lines with little or no warming for 10 years? Not easy to assess on the diagram but I would guess, yes, you could.
scaddenp @7, between c2013 and 2022 there is a dark blue projection lying well above the others (it intersects another about midway, so it may be the continuation is from the other intersecting projection). Regardless, from 2020 it starts a distinctly negative trend, unlike anything we have seen over the supposed "hiatus". It is a little unclear after 2025, but no dark blue line rises above the 2020 level of that projection until after 2030. I would say that is one visually discriminable example. It is, however, a projection of RCP 2.6 forcings.
scaddenp @ 6, agree, that was slightly ambiguous due to over simplification. I did indeed mean multidecadal variability, which includes ocean heat exchange + short term forcings, but excluding volcanism, and assuming current emissions growth.
It appears hghly unlikely, though possible, that the 2020's will be cooler than the present decade, given that every decade since the 1970's has been progressively warmer than the previous.
Art Vandelay @4, Scaddenp @7, I did a little analysis and found that, for RCP 8.5 the last year in which one of the 39 ensemble members:
a) Was negative over the preceding 10 years was 2034;
b) Was near zero (defined as having a trend in degrees C/decade of less than 0.1) was 1938; and
c) That the last year in which 5% of ensemble members had a near zero trend over the preceding decade was 2035.
Further, in 2016, 1.3% of trends over the preceding 10 years were negative; while 3.8% were near negative. These percentages fluctuate wildly from year to year. For example, 13.2% are near negative in 2019. The means for the 10 terminal years from 2005-2015 are 5.4% and 20% respectively.
With respect to Art Vandelay's supposition @9 that "It appears hghly unlikely, though possible, that the 2020's will be cooler than the present decade"; that would be correct. Although there are negative decadal trends at that period in the ensemble, in looking at decadal averages we are samply just 10% of the running 10 year trends, which themselves have a low probability of being negative.
Tom Curtis @10
In your item (b) don't you mean 2038, not 1938?
Digby Scorgie @11, yes - and thanks for the catch.