


 Arguments


2021 SkS Weekly Climate Change & Global Warming Digest #1
Posted on 3 January 2021 by John Hartz
Story of the Week... Toon of the Week... SkS in the News... Coming Soon on SkS... Poster of the Week... SkS Week in Review...
Story of the Week...
Many Scientists Now Say Global Warming Could Stop Relatively Quickly After Emissions Go to Zero
That’s one of several recent conclusions about climate change that came more sharply into focus in 2020.
[Editor's note: The following is a repost of the final section of Berwyn's article]
Making it Stop
Some scientists punctuate their alarming warmings with hopeful messages because they know that the worst possible outcome is avoidable.
Recent research shows that stopping greenhouse gas emissions will break the vicious cycle of warming temperatures, melting ice, wildfires and rising sea levels faster than expected just a few years ago.
There is less warming in the pipeline than we thought, said Imperial College (London) climate scientist Joeri Rogelj, a lead author of the next major climate assessment from the Intergovernmental Panel on Climate Change.
“It is our best understanding that, if we bring down CO2 to net zero, the warming will level off. The climate will stabilize within a decade or two,” he said. “There will be very little to no additional warming. Our best estimate is zero.”
The widespread idea that decades, or even centuries, of additional warming are already baked into the system, as suggested by previous IPCC reports, were based on an “unfortunate misunderstanding of experiments done with climate models that never assumed zero emissions.”
Those models assumed that concentrations of greenhouse gases in the atmosphere would remain constant, that it would take centuries before they decline, said Penn State climate scientist Michael Mann, who discussed the shifting consensus last October during a segment of 60 Minutes on CBS.
The idea that global warming could stop relatively quickly after emissions go to zero was described as a “game-changing new scientific understanding” by Covering Climate Now, a collaboration of news organizations covering climate.
“This really is true,” he said. “It’s a dramatic change in the paradigm that has been lost on many who cover this issue, perhaps because it hasn’t been well explained by the scientific community. It’s an important development that is still under appreciated.” "It’s definitely the scientific consensus now that warming stabilizes quickly, within 10 years, of emissions going to zero,” he said.
Many Scientists Now Say Global Warming Could Stop Relatively Quickly After Emissions Go to Zero by Bob Berwyn, Science, InsideClimate News, Jan 3, 2020
Toon of the Week...
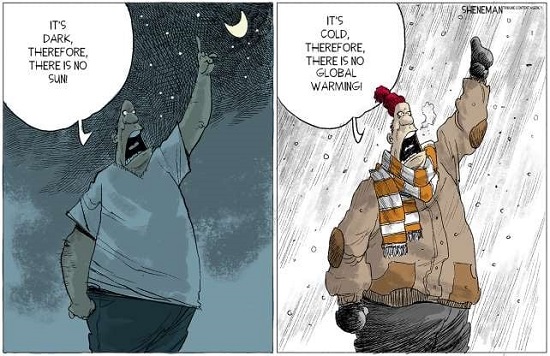
Hat tip to the Stop Climate Science Denial Facebook page.
SkS in the News...
John Cook is quoted extensively in this article:
- Covid-19 and Climate Change Will Remain Inextricably Linked, Thanks to the Parallels (and the Denial) by Ilana Cohen, InsideClimate News, Jan 1, 2021
[Editor's note: We have asked InsideClimate News for permission to repost the above article in its entirety on this website.]
Coming Soon on SkS...
- Climate Change: The Science and Global Impact - a MOOC presented by Michael Mann (Baerbel)
- Is Climate Action... Winning..? (Climate Adam)
- SkS New Research for Week #1, 2021 (Doug Bostrom)
- Covid-19 and Climate Change Will Remain Inextricably Linked, Thanks to the Parallels (and the Denial) (Ilana Cohen)
- How human activity threatens the world’s carbon-rich peatlands (Prof. Angela Gallego-Sala & Dr. Julie Loisel)
- 2021 SkS Weekly Climate Change & Global Warming News Roundup #2 (John Hartz)
- 2021 SkS Weekly Climate Change & Global Warming Digest #2 (John Hartz)
Poster of the Week...
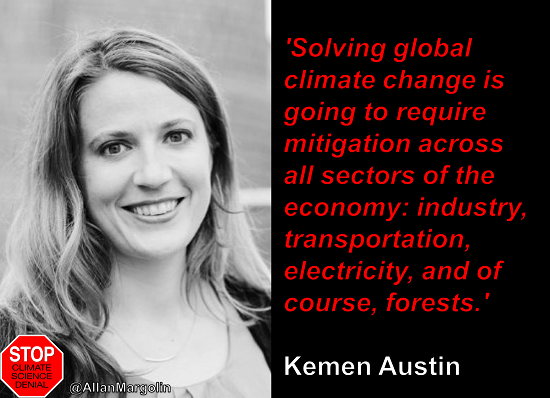
Dr Kemen Austin is employed by RTI International, an independent, nonprofit research institute dedicated to improving the human condition.
Dr. Austin is a senior policy analyst with more than a decade of experience translating scientific innovations into practical guidance for sustainably managing land resources, balancing trade-offs among multiple ecosystem services, and catalyzing low-emissions development. She has extensive experience in evaluating forest conservation and climate change mitigation programs using geospatial analysis, remote sensing, and economic and statistical models.
Dr. Autin's recent research has assessed global trends in industrial-scale agriculture, private sector sustainability commitments, regional biofuel standards, and national land use regulations. She has led successful interdisciplinary and international research partnerships with academic, civil society, and government researchers. She lived in Southeast Asia for four years and has worked on collaborative projects based in East Africa, the Congo Basin, and the Amazon Basin. Her research informs decision-making by international donors, national government agencies, and the private sector.
SkS Week in Review...
- Sun: 2020 SkS Weekly Climate Change & Global Warming Digest #52 by John Hartz (SkS Original)
- Mon: Coping with fire-scorched land more prone to mudslides by Daisy Dunne (Yale Climate Connections Repost)
- Tue: 2020 in Review: an interesting year for Skeptical Science by BaerbelW, SkS Original)
- Wed: Skeptical Science New Research for Week #52, 2020 by Doug Bostrom (SkS Original)
- Fri: Analysis: Why the new Met Office temperature record shows faster warming since 1970s by Zeke Hausfather (Carbon Brief Repost)
- Sat: 2021 SkS Weekly Climate Change & Global Warming News Roundup #1 by John Hartz (SkS Original)


Even if CO2 is zero rise, the solar & wind power fields raise the temperature. How you are accounting this. This is nothing to do with greenhouse effect. It appears the main issue is profit driven power production competitions.
sjreddy
sjreddy,
This: "the solar & wind power fields raise the temperature" needs to be more specific, detailed, and substantiated. Explanation and peer-reviewed references are necessary.
Philipee
The renewable energy production systems like Photovoltaic (PV) Solar Power Plants & Wind power plants as they come under land use and land cover changes part of human induced local weather changes. Similar to urban-heat-island effect, larger solar power plant create “Photovoltaic Heat-Island Effect” but it is a constant factor unlike urban heat island effect that steadily rises with city expansion. Barron-Gafford, et al., (2016) presented a study that “Larger solar power plants increase local temperatures — We examined the PVHI empirically with experiments that spanned three biomes. We found temperatures over a PV plant were regularly 3–4 °C warmer than wildlands at night, which is in direct contrast to other studies based on models that suggested that PV systems should decrease ambient temperatures.” Wind energy systems showed an increase in night temperatures and decrease in day temperature but day time heat is transported to neighbouring areas and thus increase in temperature there.
Dr. S. Jeevananda Reddy @3
Is the warming effect of solar and wind farms significant? For example you would need to show calcs and evidence of how much it would effect average global temperatures. Its just that even if solar power is the only source of power globally, it covers less than 2% of global land area, so its hard to see it having much effect. You need to prove otherwise.
How does the heat generated by solar and wind power compare to coal fired plant and nuclear power? Again this would need some evidence and calcs.
nigelj
on the solar and wind — see the reference I quoted earlier.
About nuclear power — I am against this and fighting on this. In India Hydropower is the major component after coal and in USA it is nuclear power — equivalent to hydropower % in India with coal % similar.
Coal power — the dust compensate the heat at the power station. Also water is used to cool some of it.
CO2 levels in SH are nearly one-third of NH. Also prior to 1960 a smooth increasing CO2 curve is an hypothetical curve.
IPCC claim that CO2 can cause catastrophic global warming. Because CO2 is not capable of causing significant global warming by itself, their contention is that increased CO2 raises temperature slightly and that produces an increase in water vapour, which does have the capability of raising atmospheric temperature. However, it is not the case, and on the contrary water vapour/relative humidity controls the energy coming from the Sun that controls the temperature at the ground. Since 1960 with the steadily rising irrigated agriculture and development of water resources caused steady rise in water vapour in the atmosphere but it has short life – not cumulative like carbon dioxide. That means under cold-island effect the temperature must decrease. This was recorded in satellite data. But later this data series were withdrawn from the internet and introduced new data series that matches with adjusted ground data series. Also annual state-wise temperature data series where intensive agriculture practice exists, namely Punjab, Haryana & UP belt showed decreasing trend in annual average temperature. Also climate sensitivity factor that converts CO2 in to heat/temperature is heuristic so far. Also the trend in global average annual temperature is not global warming but it is a part of trend is global warming that to based on adjusted data series.
A recent report states that CO2 level of 1970 was the height in the last 800,000 years — which is false observation. In fact CO2 measurements started around 1960 — According to WMO Fact Sheet 4 of August 1989— 45 stations of which 3 from SH and no station in tropics.
According to Freja Vamborg, a senior scientist at C3S, it is unquestionably an alarming sign that May 2020 has been the warmest month on record globally. However, even more concerning is the facts that average temperatures of the last 12 months have become one of the hottest 12-month-periods ever recorded in our dataset. Of course, this does not as such represent a long-term climate trend, as monthly temperature deviations vary, and some regions showed below average conditions. May 2020 tied with May 2016 for average global land and ocean temperatures, while April 2020 was on par with April 2016 for the hottest temperatures since records began in 1880. The global average temperature for May 2020 was 15.7oC (60.3oF), according to two independent measurements by the European Copernicus Climate Change Service (C3S) and the US National Oceanic and Atmospheric Administration’s (NOAA) included in the State of the Climate: Global Climate Report for May 2020. -— Both studies found abnormalities over Siberia and the Arctic Ocean with temperatures about 10.0oC (18oF) above average for this time of the year. That means these part of irregular variation part of natural variability. This is nothing to do with the CO2 linked global warming.
[BL] You are making a lot of assertions without evidence or supporting citations. Making many different assertions in a single comment makes it difficult to engage in constructive discussion.
At Skeptical Science, you can find specific threads where individual claims can be discussed. Please us the Search box to find appropriate thread, or check out the Arguments section from the menu to find where common claims are debunked.
For starters, you can find responses to many of your claims on some of the following threads:
The role of water vapour as a greenhouse gas
The different lines of evidence that the planet is warming
It's not warming
It's natural
CO2 measurements are unreliable
Land use effects
It's something other than CO2
It's microsite influences
There is no correlation between CO2 and temperature
It's internal variability
It's waste heat
Dr Reddy:
Barron-Gafford, et al., (2016) find an increase in nocturnal temperatures in their solar field. Broadbent et al 2019 found:
"For nocturnal hours our results indicate no significant difference in the 1.5-m air temperature between the two sites. This result contrasts with Barron-Gafford et al. (2016), who found an average midnight PVHI of 3°–4°C throughout the year. However, the PV array observed by Barron-Gafford et al. (2016) is smaller and less continuous than the Red Rock array. Their PV air temperature measurement was contained within a continuous field of PV modules with a horizontal extent no larger than 2 ha (~230 m × 90 m). There are also structures and impervious surfaces within 30 m of the edge of the solar modules, suggesting their air temperature measurements may have been affected by advection from adjacent impervious areas." my emphasis
Broadbent et al suggest that the increase in temperature measured by Barron-Gafford et al might be due to the small size of the array they measured and its location near other buildings. They both apparently find a small increase in daytime temperatures near the solar array. Both studies suggest more research is necessary to determine excatly how solar fields affect temperature. Both studies were conducted in the Arizona dessert. Other environments likely will have different effects.
As Nigelj points out, only a small amount of the global surface is required to generate all required power for civilization. Even if the temperature increase was 2C for the entire day, which is more than what was measured, the global increase in average temperature would be negligible. Small local temperature increases around wind arrays are similarly not significant on a global scale.
Dr. S. Jeevananda Reddy @5
"on the solar and wind — see the reference I quoted earlier."
Thanks but I cannot find anything in this study on what precise effect solar and wind would have on increasing the global warming trend as a whole. For example what fraction of a degree of warming it would add over a typical time period, perhaps a decade, compared to CO2 emissions. I want to know if its significant and worth worrying about. I very much doubt that it is because these renewables only cover such a small area of land. I might have missed it, so please copy and paste that information with a paragraph reference. You are more familiar with the study than us so its reasonable to ask.
"About nuclear power — I am against this and fighting on this. In India Hydropower is the major component after coal and in USA it is nuclear power — equivalent to hydropower % in India with coal % similar."
Why? I see no significant problem with nuclear power in general terms, although Im equally in favour of wind and solar and they have the advantage that they are quicker to build than nuclear and less contentious with the public in many places.
"Coal power — the dust compensate the heat at the power station. Also water is used to cool some of it."
Its not clear that dust would fully compensate. Show us the maths in detail, together with supporting evidence and data and sources. And remember coal aerosols are largely filtered out.
The rest of what you say is just unsupported assertions
Negelj
Global Warming: It is an estimate of the annual average part of temperature trend. The trend of 1880 to 2010 is 0.6oC per century in which global warming component is 0.3oC – 1951 to 2100 is 0.45oC – according to linear trend. But in reality it is not so as the energy component is constant over which superposed sunspot cycle. However, the reliability depends up on the data used. For example number of stations in around 1850 were < 100 and by around 1980 [started satellite data collection started around this time] they were more than 6000 and with the availability of satellite data the number of stations drastically come down to around 2500. The satellite data covered both urban-heat-island effect and rural-cold-island effect and showed practically no trend – US raw data series also showed this. However, this data was removed from internet [Reddy, 2008 – Climate Change: Myths & Realities, available on line] and replaced with new adjusted data series that matches with ground data series. Here cold-island effect is not covered. With all this, what I want say is warmings associated with solar power plants is added to global warming. How much?? This needs collection of data for all the solar power stations. Met station covers a small area only but acts like UHI effect – I saw a report “surface temperatures in downtown Sacramento at 11 a.m. June 30, 1998 – this presents high variation from area to area based on land use [met station refers to that point only]. So, solar wind power plants effect covers similar to heatwaves and coldwaves. Here general Circulation Pattern plays main role.
Nuclear Power: Nuclear power production processes contribute to “global warming process” while hydropower production processes contribute to “global cooling process”; the nuclear power production processes don’t fit into “security, safety & economy” on the one hand and on the other “environment & social” concepts; unlike other power production processes, in nuclear power production process different stages of nuclear fuel cycles are counted as separate entities while assessing the cost of power per unit and only the power production component is accounted in the estimation of cost of power per unit; carbon dioxide is released in every component of nuclear fuel cycle except the actual fusion in the reactor. Fossil fuels are involved in the mining-transport-milling conversion-processing of ore-enrichment of the fuel, in the handling of the mill tailings-in the fuel can preparation-in the construction of plant and it decommissioning-demolition, in the handling of the spent waste-in its processing and vitrification and in digging the hole in rock for its deposition, etc. and in the manufacturing of necessary required equipment in all these stages and thus their transportation. In all these stages radiological and non-radiological pollution occurs – in the case of tail pond it runs in to hundreds of years. Around 60% of the power plant cost goes towards the equipment, most of which is to be imported. The spent fuel storage is a critical issue, yet no solution was found. Also the life of reactors is very short and the dismantling of such reactors is costly & risky, etc., etc.
Michael Sweet/ Negelj
In 70&80s I worked and published several articles relating to radiation [global solar and net and evaporation/evapotranspiration] – referred in my book of 1993 [based on articles published in international and national journals]. Coal fired power plants reduces ground level temperature by reducing incoming solar radiation. In the case of Solar Panels create urban heat island condition and thus increases the surrounding temperature. In both the cases these changes depends upon several local conditions including general circulation patterns. Ground condition plays major role on radiation at the surface that define the surface temperature [hill stations, inland stations & coastal stations] – albedo factor varies. Also varies with soil conditions – black soil, red soil. Sea Breeze/land breeze – relates to temperature gradient [soil quickly warm up and quickly release the heat and water slowly warm up and slowly release heat] and general circulation pattern existing in that area plays the major role in advection.
Response to Moderator
See some of my publications for information only:
Reddy, S.J., (1993): Agroclimatic/Agrometeorological Techniques: As applicable to Dry-land Agriculture in Developing Countries, www.scribd.com/Google Books, 205p; Book Review appeared in Agricultural and Forest Meteorology, 67 (1994):325-327.
Reddy, S.J., (2002): Dry-land Agriculture in India: An Agroclimatological and Agrometeorological Perspective, BS Publications, Hyderabad, 429.
Reddy, S.J., (2008): Climate Change: Myths & Realities, www.scribd.com/Google Books, 176.
Reddy, S.J., (2016): Climate Change and its Impacts: Ground Realities. BS Publications, Hyderabad, 276.
Reddy, S.J., (2019a): Agroclimatic/Agrometeorological Techniques: As applicable to Dry-land Agriculture in Developing Countries [2nd Edition]. Brillion Publishing, New Delhi, 372p.
2.1.2 Water vapour
Earth’s temperature is primarily driven by energy cycle; and then by the hydrological cycle. Global solar radiation reaching the Earth’s surface and net radiation/radiation balance at the Earth’s surface is generally estimated as a function of hours of bright Sunshine. Total cloud cover [average of low, medium & high clouds] has a direct relation to hours of bright Sunshine (Reddy, 1974). Cube root of precipitation showed a direct relation to total solar radiation and net radiation (Reddy, 1987). In all these latitude plays major role (Reddy & Rao, 1973; Reddy, 1987). Evaporation presents a relation with net and global solar radiation (Reddy & Rao, 1973) wherein relative humidity plays an important role that reduces with increasing relative humidity. If ‘X’ is global solar radiation received under100% relative humidity then with the dryness [with relative humidity coming down] it may reach a maximum of 2X; and under net radiation also with increasing relative humidity net radiation is reduced. That means water vapour in the atmosphere is the principal component that controls the incoming and outgoing radiation and thus temperature at the Earth’s surface. Thar Desert presents high temperature with negligible water vapour in the atmosphere as maximum energy reaches the earth’s surface. However, these impacts differ under inland (dryness), hill (declining temperature with height – lapse rate) & coastal (wetness) locations and sun’s movement (latitude and declination of the Sun — seasons) (Reddy & Rao, 1973). IPCC integrated these under “climate system” and the advective condition by general circulation pattern [GCP].
Cold-island effect [I coined this, see Reddy (2008)] is part of human induced climate change associated with changes in land use and land cover. Since 1960’s to meet the food needs of ever increasing population, started intensive agriculture – conversion of dryland to wetland; & creation of water resources; etc. In this process increased levels of evaporation and evapotranspiration contributed to raise in water vapour up to around 850 mb levels in the lower atmosphere. Unusual changes in water vapour beyond 850 mb level [for example at 700 mb level] become a cause for thunderstorm activity (Reddy & Rao, 1978). Wet bulb temperature (oC) at the surface of the Earth provides the square root of total water vapour (g/cm2) in the vertical column of the atmosphere; and also wet bulb temperature (oC) is a function of dry bulb temperature (oC), relative humidity (%) and square root of station level pressure (height) relative to standard value in mb [p/1060] (Reddy, 1976). Thus, unlike CO2, water vapour presents a short life with steadily increasing with land use and land cover changes. However, met network in this zones have been sparse and thus the cold island effect is not properly accounted under global average temperature computations. Though satellite data takes this in to account, this data series were withdrawn from the internet and introduced new adjusted data series that matches with adjusted ground data series. Annual state-wise temperature data series in India wherein intensive agriculture practices are existing, namely Punjab, Haryana & UP belt, showed decreasing trend in annual average temperature – cooling. Some of these are explained below:
Reddy (1983) presented a daily soil water balance model that computes daily evapotranspiration, known as ICSWAB Model. The daily soil water balance equation is generally written as:
▲Mn = Rn – AEn – ROn - Dn
In the above equation left to right represent the soil moisture change, rainfall or irrigation, actual evapotranspiration, surface runoff and deep drainage on a given day (n). The term Actual Evapotranspiration [AEn] is to be estimated as a function of f(E), f(S) & f(C), wherein they represent functions of evaporative demand on day n, soil & crop factors, respectively. As these three factors are mutually interactive, the multiplicative type of function is used.
AEn = f(En) x f(S) x f(C)
However, the crop factor does not act independently of the soil factor. Thus it is given as:
AEn = f(En) x f(S,C) and f(S,C) = K x bn
Where f(S,C) is the effective soil factor, K = soil water holding capacity [that varies with soil type] in mm and bn is the crop growth stage [that vary with crop & cropping pattern] factor that varies between 0.02 to 0.24 — fallow to full crop cover conditions (with leaf area index crossing 2.75). Evaporative demand is expressed by the terms evaporation and/or evapotranspiration. Evaporation (E) and evapotranspiration (PE) are related as:
PE = 0.85 x E [with mesh cover] or = 0.75 x E [without mesh cover].
However, the relationship holds good only under non-advective conditions [i.e., under wind speeds less than 2.5 m/sec]. Under advective conditions E is influenced more by advection compared to PE. In the case of PE, by definition, no soil evaporation takes place and thus PE relates to transpiration only – where the crop grows on conserved soil moisture with negligible soil evaporation. With the presence of soil evaporation, the potential evapotranspiration reaches as high as 1.2 x PE or E with mesh cover. McKenney & Rosenberg (1993) studied sensitivity of some potential evapotranspiration estimation methods to climate change. The widely used methods are Thornthwaite and Penman presented 750 mm and 1500 mm wherein Thornthwaite method is basically uses temperature and Penman uses several meteorological parameters (Reddy, 1995).
In this process the temperature is controlled by solar energy but moisture under different soil types [water holding capacity] it is modified. This modified temperature cause actual evapotranspiration and thus water vapour. This is a vicious circle. For example average annual temperature in red soils Anantapur it is 27.6oC; in deep black soils Kadapa it is 29.25oC & in medium soils Kurnool it is 28.05oC. That means, local temperature is controlled by soils.
Reddy (1976a&b) presented a method of estimating precipitable water in the entire column of the atmosphere at a given location using Wet Bulb Temperature. The equations are given as follows:
Tw = T x [0.45 + 0.006 x h x (p/1060)1/2]
W = c’ x Tw2
Where T & Tw are dry and wet bulb temperatures in oC; h is the relative humidity in %; p is the annual normal station level pressure in mb [1060 normal pressure in mb, a constant] ; W is the precipitable water vapour in gm/cm2 and c’ is the regression coefficient.
WMO (1966) presented methods to separate trend from natural rhythmic variations in rainfall and assessing the cycles if any. (Late) Dr. B. Parthasarathy from IITM/Pune used these techniques in Indian rainfall analysis. Reddy (2008) presented such analysis with global average annual temperature anomaly data series of 1880 to 2010 and found the natural cycle of 60-years varying between -0.3 to +0.3oC & trend of 0.6oC per century [Reddy, 2008]. This is based on adjusted data series but in USA raw data [Reddy, 2016] there is no trend. The hottest daily temperature data series of Sydney in Australia shows no trend [Reddy, 2019a]. Thus, the trend needs correction if the starting and ending point parts are in the same phase of the cycle – below and below or above and above the average parts. During 1880 to 2010 period two full 60-year cycles are covered and thus, no need to correct the trend as the trend passes through the mean points of the two cycles.
3.2.4 What is global warming part of the trend?
According to IPCC AR5, this trend of 0.6oC per century is not global warming but it consists of several factors:
a. More than half is [human induced] greenhouse effect part:
i. It consists of global warming component & aerosols component, etc. If we assume global warming component alone is 50% of the total trend, then it will be 0.3oC per Century under linear trend;
ii. Global warming starting year is 1951 & thus the global warming from 1951 to 2100 [150 years] is 0.45oC under linear trend;
iii. But in nature this can’t be linear as the energy is constant and thus CSF can’t be a constant but it should be decreasing non-linearly;
iv. Under non-linear condition by 2100 the global warming will be far less than 0.45oC and thus the trend will be far less than half;
b. Less than half the trend is ecological changes [land use and land cover change] part – mostly local & regional factors:
i. This consists of urban-heat-island effect and rural-cold-island effect;
1. Urban-heat-island effect – with the concentrated met network overestimates warming;
2. Rural-cold-island effect – with the sparse met network underestimates cooling;
2.2.1 Uncertainty on “Climate Sensitivity Factor”
The word “climate Crisis” is primarily linked to global warming. To know whether there is really global warming, if so how much, climate sensitivity factor plays the main role. Climate sensitivity is a measure [oC/(W/m2)] – how much warming we expect (both near-term and long-term) for a given increase in CO2? According to Mark, D. Zilinka (2020), “Equilibrium climate sensitivity, the global surface temperature response to the CO2 doubling, has been persistently uncertain”.
Recent modelling data suggests the climate is considerably more sensitive to carbon emissions than previously believed, and experts said the projections had the potential to be “incredibly alarming”, though they stressed further research would be needed to validate the new numbers. Johan Rockström, the director of the Potsdam Institute for Climate Impact Research, said. “Climate sensitivity is the holy grail of climate science. It is the prime indicator of climate risk.
The role of clouds is one of the most uncertain areas in climate science because they are hard to measure and, depending on altitude, droplet temperature and other factors can play either a warming or a cooling role. For decades, this has been the focus of fierce academic disputes. Catherine Senior, head of understanding climate change at the Met Office Hadley Centre, said more studies and more data are needed to fully understand the role of clouds and aerosols. With this vital disputes how anyone can say there is global warming without solving this issue; so I said “global warming hysteria factor is climate crisis”.
[BL]
Thank you for taking the time to share with us. Skeptical Science is a user forum wherein the science of climate change can be discussed from the standpoint of the science itself. Ideology and politics get checked at the keyboard.
Please take the time to review the Comments Policy and ensure future comments are in full compliance with it. Thanks for your understanding and compliance in this matter.
Although Digest articles are fairly open in terms of commenting, you must not treat them as open opportunities to post long, rambling diatribes.You have been given guidance regarding how to find appropriate threads.Please follow that advice.
Further posts on this thread will be considered "off topic" and will be subject to deletions in whole or in part.
DRSJReddy @8 ,
Some of your assertions are correct, some are dubious, and some are completely faulty. But this is not good enough in scientific discourse. You must expunge the faulty parts, in order to avoid being unscientific.
The moderator ( at #5 above ) has indicated the pathway forward for you. Please take your individual points, and discuss them at the appropriate individual threads. And please read through each of those thread's Original Post (in basic and advanced forms, where available) and please read through the subsidiary commentary posts. That may well correct some of the erroneous concepts you have formed. Quite an adventure for you, no doubt ~ but you will find it worthwhile.
Dr. S. Jeevananda Reddy @8,
Your list of "my publications for information only" contains a 2008 book entitled 'Climate change: myths and realities' which I thought to track down to better understand your position on AGW as your position appears worryingly difficult to establish from your comments within this thread.
Your book is partially available on-line and does containI some eye-opening passages. For instance:-
The book also has a most curious citation in Google Scholar entitled "Who is Dr. S. Jeevananda Reddy?" which well explains some of the "erroneous concepts you have formed" mentioned @9.
Thanks MA Rodger for doing that leg work, most enlighting. DSJR makes rather strange assertions about satellite temperature data, that suggest nefarious intent and are borderline conspiracy thinking. Not surprising coming from a WUWT contributor, it's their bread and butter.
We have discussed the satellite data and its shortcomings on numerous occasions and suffice to say that it is an element that adds to the overall picture but not nearly as satisfying as the real surface data found in GISTEMP or HadCRUT. The refinements and corrections to the satellite data were also discussed.
I find DSJR voluminous contribution to be a very peculiar mix designed to sound very technical (but how much is actually relevant?) yet with whoppers that don't square at all with true expertise. Curious...
Dr. S. Jeevananda Reddy @8, lets summarise your response to date. You talked @3 about solar and wind farms allegedly causing a warming effect. I asked you @4 for evidence of how much if any solar and wind farms would affect global temperature trend, you responded @5 by saying look at the article you posted, I couldnt find anything @7 and asked you to provide a copy and paste. You responded @8 but havent provided this information, so the information obviously just doesnt exist.
Instead you shift the goalposts to some very debatable rant about warming trends, and water vapour. So you havent proven anything much about solar and wind power, and I am going to conclude the effects of soalr and wind power on contribting to warming are neglegible as I suspected and which is obvious, until somene can actually provide somethiing more than empty waffle.
Thank's for you views on nuclear power, but the fact is it emits far less greenhouse gases than coal fired power so easily comes out way ahead of coal fired power just as renewables do. Have a nice day.
Just adding to my comment @12: Building solar, wind or nuclear plants creates an insignificant carbon footprint compared with savings from avoiding fossil fuels, a new study suggests.The research, published in Nature Energy, measures the full lifecycle greenhouse gas emissions of a range of sources of electricity out to 2050. It shows that the carbon footprint of solar, wind and nuclear power are many times lower than coal or gas with carbon capture and storage (CCS). This remains true after accounting for emissions during manufacture, construction and fuel supply.
phillippe
From the starting of my research carrier, I am not associated with any organization and institution as you said. You can see from my publications, all is my own work as an individual. After returning to India from my assignments with FAO & WMO, I brought out a book in 1993 based on my work up to that time [based on articles published in national and international journals and my Ph.D. Thesis, ANU, Canberra]. The book review was published in an international journal by Chairman of Agrometeorology Group in WMO at that time. [Also edited TROPMET symposium held in 1995 at space science centre — published in 1999 titled "Advanced Technologies in Meteorology --.] This is a reference book for Agrometeorology at post-graduate level. On the request of a publisher I revised it and it was published in 2019.
I participated in Dot Earth discussions in New York Times until it was closed. During these sessions one commentator asked me whether I know Prof. Jagdish Shula. I replied to her saying we both worked in Pune met services – I was in IMD and he was in IITM. Now, you raised that I am from Wuwt but I stopped participating in this. In fact the article published in watts up with that [wuwt] as guest article, I in fact presented it as invited talk at a national conference on 7th December 2013. Since long I am not participating in wuwt. I concentrated publishing four books and arounsd 20 articles on online journals – all on request. Also presenting invited/Keynote presentations at institutions in Hyderabad/India as I stopped travelling outside Hyderabad. Also actively participating on environmental issues in Hyderabad.
All you say is that you want me follow you leaving science path. Sorry I don't do that.
[BL] Accusing everyone else of not understanding how science is done is not a good start to your participation here.
negelj
So, the information obviously just does not exist — a false observation. This shows you decided something you don't accept others version and make cheap statements like "rant" . The whole talk on CO2 — you plot CO2 versus population from 1960 to date present a simple linear trend.
MA Rodger
— book is partially available — ???
— Who is Dr. S. -— it is not my blog
— erroneous -— according to you and not according to science
DSJR,
It seems English may not be your first language, and it makes your post somewhat difficult to sort through. It is not mine either but most of my secondary education took place in English so I have no difficulty in understanding, speaking, reading and writing.
Let's clarify a few things. I did not say anything about your afiliations, I have no real interest in it. However, you should acknowledge that this site routinely refers to peer-reviewed work published in high impact journals and that they do carry more weight. I note that, among the multiple citations in your most lengthy post, the majority are to yourself. You are arguing the quantification of attribution, and other things, without referring to the major works of the major contributors in the field who do publish in high impact journals, but by referring mostly to yourself. My skepticism is not unwarranted.
Secondly, I do not "want" you to do anything. I reserve the right to gauge the usefulness of your contribution.
Dr. S. Jeevananda Reddy @15
"So, the information obviously just does not exist — a false observation. This shows you decided something you don't accept others version and make cheap statements like "rant" ."
Oh the information exists does it? Please show me where, with a copy and paste and a link. You havent so far depite repeated requests. Whether it exists or not you are making certain claims, so the onus is on you to provide specific evidence, which you are totally unable to do.
And rant. Pfttt. I apply the term to my own writing sometimes. Its not derogatory. Rubbish would be impolite although arguably very accurate.
"The whole talk on CO2 — you plot CO2 versus population from 1960 to date present a simple linear trend."
Correlation doesn't prove causation. What are you a doctor of, out of curiosity? Astrology? I bet its another question you wont answer directly.
nigelj
Humans breath Air and use Oxygen and release CO2.
CO2 contribution to global warming, present equation that showed the relation — in fact what you all are talking is not global warming but it is trend that relates to all human induced contributions — see the definition of climate change by IPCC/UNFCCC/WMO. ----
[BL] You have been advised to find appropriate threads for comments. You must follow that advice, or deletions will be done.
Others have easily found the appropriate thread (e.g. nigelj, in comment 23, below).
https://skepticalscience.com/breathing-co2-carbon-dioxide.htm
phillippe
You used the word used by WUwt — in science whether English is first language or second is immeterial. My first two articles published in international journal in 1970. My 10 articles were published in international reputed peer reviewed journal in 1983/84.
Let me present three examples:
1. At TROPMET conference scientists analysed the satellite data and presented their results. The satellite data was provided by Ahmedabad institute – a scientist from Ahmedabad got up and said the data is not accurate. Then I asked him, if so why did you supply such data? or why you did not inform those scientists? There was no answer. Same was the case with satellite global average temperature data series. I presented this data on the global average surface temperature data series – around 1980 to 2000 in 2008 in my book. Later this data series disappeared from internet and appeared new data series saying that previous data series are not correct. Both satellite and surface data series by different groups present different values. Why?
2. When I was a scientist with ICRISAT, my group [two other scientist] tried to test A&M Texas Sorghum Growth model for India. They experimental data for Indian locations and few other countries and tested the model by adjusting radiation component. They presented the results at a meeting Chaired by DG of ICRISAT [a former soil professor from Hawaii] and Arkin from Texas who developed the model was also present. The result showed poor correlation for grain and biomass. Then the chairman/DG asked me you test the model by replacing the soil water balance model used in the model with my model [ICSWAB]. With this they presented the result on the next day. The correlation improved from around 0.30 to 0.85. But Arkin refused to change his model. Stopped the work. Then they brought in Monteith’s model from UK. This also failed. In fact the soil water balance model used in Arkin model works under conserved soil moisture which was the case where he developed but in India the model should account rainfall with crop and soil parameters. This is simple science and not English.
3. I submitted a paper to an international journal. They sent to two reviewers. One made few observations and accepted for publication. The other made good comments but said “the data can be fitted to linear curve”. Based on this observation, the regional editor rejected the paper for publication. Then I wrote to the Editor-in-Chief a 100 latter questioning the integrity of editorial committee members. This was sent to three regional editors [Australia, UK & USA], who concurred with my views. Then the Editor-in-Chief asked me to divide it in to three articles [articles related to editorial committee members of that journal]. They were published under discussion/comments on the articles I referred. After this, Editor-in-Chief asked me to resubmit the paper rejected. I did not do that but included in my 1993 book – as the reviewer used same statement which I used in the case of his article in Agronomy Journal/USA. IMD Journal is one of reputed journal — I published several articles during 70-80s, referred to date.
[BL]
Discussions of satellite data can go here:
https://skepticalscience.com/satellite-measurements-warming-troposphere.htm
Anecdotal stories and accusations of dishonesty are not science. If you wish to discuss models, there are several threads here. For example:
https://skepticalscience.com/climate-models.htm
Discussions about the peer review process can be placed on on of the following threads:
https://skepticalscience.com/Peer-review-process.htm
https://skepticalscience.com/pal-review.htm
Please note that posting comments here at SkS is a privilege, not a right. This privilege can be rescinded if the posting individual treats adherence to the Comments Policy as optional, rather than the mandatory condition of participating in this online forum.
Please take the time to review the policy and ensure future comments are in full compliance with it. Thanks for your understanding and compliance in this matter.
To be specific, you need to read the Comments policy in detail - especially the first two:
This is not a forum to give speeches.
DRSJReddy ,
Thank you for your extensive information about yourself.
Evidently you are a serious and important person.
But to use the modern English colloquialism : "Enough already!"
Speaking for readers here, I can say it would be much appreciated if you now began at the various topic threads [see post #5 moderation listing] and clearly addressed those aspects of mainstream climate science which you consider to be incorrect. Of course, specifying your supporting scientific evidence (as may exist in the peer-reviewed articles of reputable scientific journals).
[BL] Dr. Reddy will be monitored closely - as will this entire thread - so please everyone: leave the moderation to the moderators. In particular, if egregious violations of the comments policy are seen, wait before responding. The next stage of moderation will be deletions of all or part of comments, not just warnings.
Dr. S. Jeevananda Reddy @16,
♥ Indeed, your book Reddy, S.J., (2008) 'Climate Change: Myths & Realities' is mostly available to read on a Google Books preview up to page 87 but pages 88-193 "are not shown in this preview".
♥ And nobody would mistake the critique within the 'blog' by William Connolley as your work.
♥ As for your assertion that my use of the adjective "erroneous" is not backed up by science, that is yet more "erroneous" input from you.
I haven't read past your comment @6 but that yields conclusive findings for me.
Your suggestions that solar or wind power are contributing to global warming is plain silly. A wind farm mixes air, and actually extracts energy locally to be transported for use elewhere. Temperature increases are simply the result of mixing of air, not the generating of warming.
A solar farm will decrease albedo but the additional solar energy absorbed is comparable to the waste heat from a fossil-fuelled or nuclear powerplant. And this is without the CO2 from a fossil-fuelled powerpalnt which will add to AGW.
Any positive climate forcing raises global temperature and this in turn will be amplified by feedbacks, particularly through the resulting higher specific humidity.
Thus you write condescendingly @6: "increased CO2 raises temperature slightly and that produces an increase in water vapour, which does have the capability of raising atmospheric temperature" but with the added comment "However, it is not the case." So how is it that a climate forcing from increased CO2 (at 3.7wm^-2 per doubling) does not increase global temperature and thus initiate further warming from feedbacks? What scientific principle could you invoke to argue such a thing?
Dr. S. Jeevananda Reddy @16,
Ok sorry I misinterpreted your comment. But please note that breathing is carbon neutral. Refer below:
skepticalscience.com/breathing-co2-carbon-dioxide.htm
It should also be understood that while the growing human population potentially burns more fosssil fuels, etc, population growth is generally slowing down in most places, and even falling in absolute terms in some countries like Japan. We could perhaps make it slow down faster, but there are limits to what can be achieved with policies that would be generally acceptable to people. So our main focus has to be on things like a new energy grid. Hopefully any educated person can understand that, its simple enough.
DSJR,
"You used the word used by WUwt." What? Sorry, I have no idea of what this could possibly mean. Unlike others who make a point of monitoring the lunacy, I feel like any time spent on WUWT is wasted. It's not like I don't already know what's there, or that it ever gets better.
Your claim that language is not relevant to science is mistaken. Not only language is crucial for communication between members of science teams, but also for communicating science findings, whether that would be to a specialized audience or the general public. You are on this thread of your own accord, with a purpose. If you attempt to participate in an online discussion, you can't be cavalier about your ability to effectively convey your meaning. Get some help, take the time to polish your posts, eep it short ans simple.
I don't think, I need advise from poor quality/ethics people like you.
[BL] General complaint deleted.
Please note that posting comments here at SkS is a privilege, not a right. This privilege can and will be rescinded if the posting individual continues to treat adherence to the Comments Policy as optional, rather than the mandatory condition of participating in this online forum.
Moderating this site is a tiresome chore, particularly when commentators repeatedly submit offensive or off-topic posts. We really appreciate people's cooperation in abiding by the Comments Policy, which is largely responsible for the quality of this site.
Finally, please understand that moderation policies are not open for discussion. If you find yourself incapable of abiding by these common set of rules that everyone else observes, then a change of venues is in the offing.
Please take the time to review the policy and ensure future comments are in full compliance with it. Thanks for your understanding and compliance in this matter.
Philippe @24 ,
your comment blessant is noted, that you regard the monitoring of WUWT to be time wasted.
Sadly, as a frequent reader/sampler of WUWT blogsite, I must agree with you, considering that site's continual overflow of puerility, mendacity and intellectual insanity. A septic pit indeed. But slightly redeemed its sheer concentrated exhibition of all types of interesting psychopathology and logical fallacies and general irrationality.
Philippe @17 ,
you surprise me when you say English is not your mother tongue. ( I have often admired your turn of phrase in various earlier posts on SkS. ) But perhaps your very eloquence should have alerted me to that possibility.
I any case : Happy New Year to you and all readers. Though it seems 2021 is out of the starting gate and is set fair to outpace 2020 in the Horridness Stakes. Place your bets, Ladies and Gentlemen !
Typo : slightly redeemed by
Today (01-14-21) Politico (an online news organization) posted an article claiming that major banks and insurers want to start sending more money to address the climate crisis. Apparently they want a promenent seat at the table during the Biden administration.
While the proposals described in the Politico article do not go as far as many climate activists would like, it seems to me that it is a hopeful sign that financial institutions are talking about the climate crisis.
This carbon brief article claims that models used by the IPCC severely underestimate the damages currently caused by climate change. Apparently the IPCC models try to estimate general damages from climate change and assume extreme weather events cause little damage since they are rare. If fact, extreme weather events currently cause billions of dollars and a large part of that damage is attributable to climate change. For example hurricanes have long existed but Hurricane Harvey did more damage from increased rain due to climate change.
If insurers become concerned that they are losing money from climate change the pressure to take significant action will increase dramatically. Even 5 years ago financial institutions were mostly silent about climate change. Hopefully this will result in significant action being taken. I am interested in what other SkS readers think about this topic.
Money talks. Munich Re has been one of the organizations that shows up in the news more often than others, when it comes to the insurance risks of climate change.
I saw this article last week in a major Canadian newspaper. (Not sure if it is paywalled.)
https://www.theglobeandmail.com/world/article-natural-disasters-caused-210-billion-of-damage-in-2020-insurer-says/
Bob, to elaborate, I'll repost this here, where it is even more relelvant than on the wildfire thread:
NOAA has just put out an assessment of the costs of climate change related extreme events over the past few decades. The steady increase in the yearly number of events and the yearly costs is staggering. The acceleration is interesting: the 2010s saw 119 events, of which 50 occured inthe past 3 years. Although 2020 ranked 1st with 22 events (probably due to the hurricane season), that's an average of 11.9 events per year, almost double the rate of the 2000s (6.2 per year).
Meanwhile, the subsidies to fossil fuels are not exactly slowing down.
The economic argument is making less and less sense, and the adverse effects of climate change are no longer some diffuse problem diluted in a somewhat distant future. It's here, now, slapping us in the face once a month.
Thank you for the compliment, Eclectic, and no offense was intended. I know it is necessary to monitor the crazyness of the denialist crowd, I just don't ever find that I couldn't do something better with my time. I've been at this long enough to have fond memories of Steven Goddard and the carbonic snow in Antarctica :-)
Nowadays, Watts is a little more careful to weed out whoppers of such magnitude. But then, there was BEST, and the NOAA studies that completely invalidated the basic argument for the very existence of the site, and eventually Watts'own results that did exactly the same thing, all met with anger (toward BEST) and more denial.
The attitude of the WUWT peanut gallery when faced with reality taught me everything I needed to know about these clowns. Not to mention, of course, the "outing" of private addresses of scientists whose work they disliked, predating methods that have unfortunately become more common.
DSJR,
I will not comment on your quality or ethics, as I really have no interest in it. This is not about you, or me, but helping readers form understanding. I reiterate that the framing of your argument on satellite data suggests nefarious intent, although you provided no substantiation of such intent. Perhaps you don't see that and it's a language issue.
There is on this site abundant discussion of satellite data, including the repeated shortcomings of the UAH team, who had to have others show major mistakes on at least 2 occasions. There are also detailed posts on the height of the "slices" where the measurements are taken from which temperatures are derived. Go hack at it there. Perhaps this is about other satellite data than the ones we are most familiar with, then more references are needed, so we can check for ourselves. Usually, when corrections are done, papers about the why and how of the corrections are published.
As for the idea that solar and wind power plants have any measurable effect at a global scale on surface temperatures, I'll say that what you provided falls short by so much that, under the current state of knowledge, it puts that hypothesis in the "not even wrong" category. However, my opinion is always open to modifications in the face of new findings. If the idea attracts research and it turns it had merit, I will acknowledge that. However, as of now, I don't see that we are anywhere close to have the weight of evidence necessary.
Don't take it personally. Once again, this is not about you.
Philippe @31 ,
Greetings. And no offense taken by me. For anyone interested in the science of climate science, the WUWT blog is indeed an almost complete waste of time.
However, as a student of human nature, I must say that WUWT illustrates some of the human response to the challenges of AGW ~ and in that connection WUWT is a marvellous microcosm of mental pathologies. And being somewhat of a gentleman of leisure myself (sadly, far more a bourgeois gentilhomme than a true gentilhomme ) it is easy for me to find time to indulge my hobby there. Also helps me to keep some practised ripostes at the ready, against Denialists.
But I must not deflect further from this thread's topic. Despite the WUWT attractions of the ridiculous Christopher Monckton and the slightly less ridiculous Andy May, Willis Eschenbach, et alia. And despite the "peanut gallery" as you call it ~ a gallery rich in old chestnuts as well as peanut ideations, and even including some Brazil nuts (well, one or two from Chile or Argentina actually, as expatriate Yankees).
So I had better get off my hobbyhorse, and return the thread to its main topic, which seems to be the good Doctor Reddy.
[BL] Actually, the topic here is discussion of the various items posted in the digest.
Dr. Reddy seems to have decided that finding a thread here at SkS where his musings are on topic is too difficult. If he returns, we will again try to redirect the discussion to an appropriate topic. Until then, let's stop speculating about individuals.
nigelj @4
The calculations are not difficult to do. I have done them here and here.
What Dr. S. Jeevananda Reddy appears to be saying in comment @1 (if I understand correctly) is that even renewable energy use will increase global temperatures. This is obviously true. All energy use ends up as heat and entropy, i.e. temperature. The second law of thermodynamics tells us that.
The relevant question is, by how much does this energy use increase local temperatures? The answer is, that in advanced economies with high population densities current levels of energy use can increase temperatures by more than 1 °C since pre-industrial times, and this will only get worse with more population growth and economic growth. Even the average suburban housing estate will heat the local environment by over 1 °C (see here). More importantly, this has nothing to do with CO2 and the greenhouse effect. It applies equally to all energy sources, but obviously CO2 will make it even worse via radiative forcing or feedback.
The point is, green energy is not a free lunch. Therefore zero carbon emissions is not a panacea either.
[BL] Please do not continue to carry on off-topic discussions here. Discussions of waste heat can be carried out on this thread:
It's waste heat
Regular readers will find any new comments via the Comments link under the masthead, and you can always leave a link in a new comment here pointing to where you have made the on-topic comment.
Climate Detective,
I have replied to your comment on an appropriate thread.