


 Arguments


From the eMail bag: A Review of a paper by Ellis and Palmer
Posted on 5 October 2022 by Bob Loblaw
We occasionally receive excellent questions and/or comments by email or via our contact form and have then usually corresponded with the emailer directly. But, some of the questions and answers deserve a broader audience, so we decided to highlight some of them in a series of blog posts.
Yet, again, an email to Skeptical Science has asked us what we know about a paper that is being promoted in the blogosphere or some other source that is attempting to discredit climate science. This time, it was a paper from 2016 by Ellis and Palmer, published in the journal Geoscience Frontiers, that looks at albedo as a feedback in controlling glacial cycles.
Ralph Ellis, Michael Palmer, Modulation of ice ages via precession and dust-albedo feedbacks, Geoscience Frontiers, Volume 7, Issue 6, 2016, Pages 891-909
https://doi.org/10.1016/j.gsf.2016.04.004
As can be surmised from the title, the paper emphasizes albedo feedbacks. It discounts the importance of the radiative effect of CO2 changes, and argues that CO2 only affects plant growth, not temperature. The argument in the paper is that low CO2 leads to low vegetation, which leads to increased dust, which reduces ice sheet albedo, which leads to the end of a glacial period. Conversely, high CO2 is claimed to do the reverse – increased vegetation, leading to cooling and another glacial period.
At first glance, there did not seem to be anything particularly unusual about the paper – or any reason why it would be so popular among the crowd that jump on any chance to discredit the consensus view on climate science. It was just an argument that albedo effects are more important in glacial cycles than previously thought. It wasn’t until we started to read it in more detail that we saw the attraction to the “CO2 isn’t important in the greenhouse effect” argument – the paper purports to demonstrate a complete lack of CO2 radiative effect in glacial/interglacial cycles. By analogy, the paper then must be evidence that the radiative properties of CO2 are not a factor in current climate change. The paper does not actually say this, but the implication is attractive to those that want to see it.
Of course, Ellis and Palmer’s “lower CO2 causes warming, higher CO2 causes cooling” narrative is music to the ears of anyone trying to believe that current climate science has it wrong. What are the chances that this obscure paper really represents a nail in the coffin of general climate science? Vanishingly small, but we still need to look at the details in the paper and assess it on its own merits. Reviewing this paper, however, has become quite complicated. Buried under a lot of verbiage about ice albedo that is neither revolutionary nor controversial, the paper provides only a few very basic calculations that are basically wrong. Each pass through the haystack has revealed another blunt needle, and we’re only going to have space to expose a few of them in detail.
In summary, the paper provides no substantive evidence to support its conclusions, and consists of little more than a long just-so story about albedo and glacial cycles.
But first, let’s review some of the commonly-held understanding of glacial cycles and earth-sun orbital variations. We’ll need this background to be able to understand the fundamental errors in Ellis and Palmer.
Quaternary Glacial Cycles
The period of geologic time that interests us is the Quaternary Period, covering roughly the past 2.5 million years. The earth underwent several major glacial periods during that period, and we’ll be looking most closely at the later stages. Ellis and Palmer focus on the last 800,000 years.
This is not the first time that Skeptical Science has posted information on glacial cycles and feedbacks. Just over two years ago, we re-posted an article by Zeke Hausfather, from Carbon Brief, that looked at the issue. The Hausfather post covers a lot of similar issues to those discussed in Ellis and Palmer, but comes to a rather different conclusion – the radiative effects of CO2 are a key feature of glacial cycles, due to the feedback of atmospheric CO2 that rises and falls as temperature changes. The post links to a reputable paper by Baggenstos et al (2019, so more recent than Ellis's paper) that looks at the radiative effects. It concludes that albedo changes are important, but it is not dismissive of CO2 effects.
So, why is the Ellis and Palmer attempt at explaining glacial cycles so different from the vast majority of the published literature? Which provides a more realistic description of what went on in glacial/interglacial cycles? Geology and paleoclimalogy have long known that major areas of the world have gone through cycles of continental-scale glaciation. We refer to “ice ages” as periods where significant land-based ice exists, and we refer to “glacial” and “interglacial” cycles within an ice age to describe periods with more or less ice. We are now in an ice age (ice in mountains, Greenland, and Antarctica), but we are in an interglacial – relatively low amounts of land ice compared to the peak of the last glacial period (roughly 20-25,000 years ago).
Wikipedia has good articles on ice ages in general, Quaternary glaciation, and the last glacial period in the Quaternary (from about 115,000 years to 12,000 years before present). There are several glacial/interglacial cycles in the 800,000-year period covered in Ellis and Palmer. From the Wikipedia page on “Ice Age”, we have the following map of northern hemisphere minimum and maximum glacier extent. Note that North America was completely covered in ice from west to east, while in Eurasia the ice cover was much more extensive in the western (European) region.
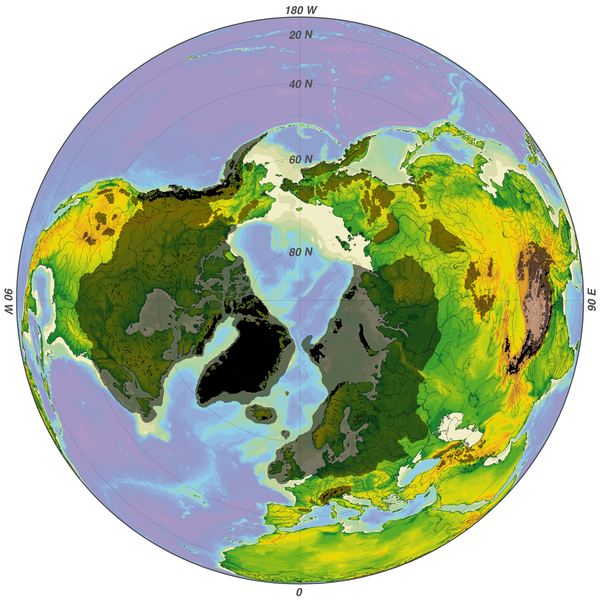
Figure 1: A north polar view of earth, showing recent (black) and maximum (grey) glaciation of the northern hemisphere during the Quaternary climatic cycles. Image from Wikipedia.
Milankovitch Cycles
Much work has been done to explain the climatological and geological aspects of glacial/interglacial cycles. In the early 1900s, a Serbian scientist named Milutin Milankovitch did a lot of work in calculating various aspects of solar radiation. One of his most enduring works was to look at variations in the earth-sun orbital relationships, and identify changes over glacial/interglacial cycles. These are now simply referred to as “Milankovitch cycles”, and both Skeptical Science and Wikipedia have pages on that, too.
The Milankovitch cycles represent changes in solar insolation (received at the earth). There are slow variations in the elliptical shape of the earth’s orbit (eccentricity), the tilt of the earth’s axis (obliquity), and the time of year of the earth’s closest approach to the sun (perihelion, currently in early January). The three cycles have periods ranging from about 19,000 years (timing of perihelion) to 110,000 years (eccentricity), so when they are put together there are a lot of squiggles. Pretty much any introductory climate course or textbook is going to cover this. Figure 2 provides a static visual.
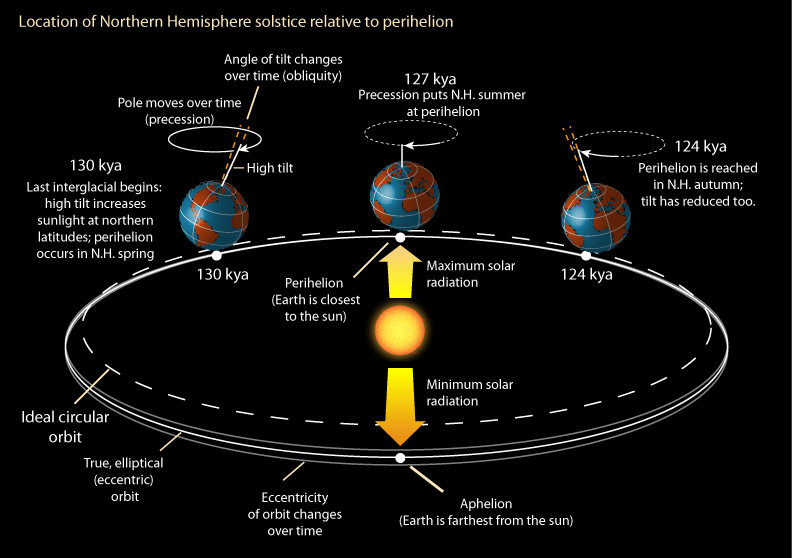
Figure 2: Earth's orbital configuration during the Last Interglacial at 130 ka, 127 ka, 124 ka. From a Skeptical Science post on the last interglacial.
If you like visuals, there is a great animated display of these orbital variations on this NASA web page. (Scroll down to the "Orbital Cycles" diagram and click on it to start the animation.)
The catch with Milankovitch cycles, over the last several glacial/interglacial periods, is that there is very little variation in annual average solar radiation received by the earth as a whole. Two of the three cycles – wobble in the earth’s tilt, and timing of the closest approach to the sun – have no effect at all on annual global averages. And the third – eccentricity - only has a slight effect on the global annual average: from +0.014% to -0.17% compared to today’s average. What does change, though, is the seasonal variation and how the solar radiation is distributed between the equator and the pole. More tilt or a more elliptical orbit both mean stronger seasonal changes in both the northern and southern hemispheres. The timing of closest approach affects the two hemispheres in the opposite direction: right now the closest approach (strongest insolation) happens during the southern hemisphere summer, so the southern hemisphere will have a stronger summer-winter change than the northern hemisphere.
To illustrate the seasonality of solar insolation, let’s look at the current daily total solar radiation received on a horizontal surface at the top of the atmosphere. We call this “extraterrestrial radiation”, and calculating it for any day and latitude is a simple mathematical process, once we know the orbital characteristics of the earth around the sun. Figure 3 shows the seasonal and latitudinal variation of this extraterrestrial radiation.
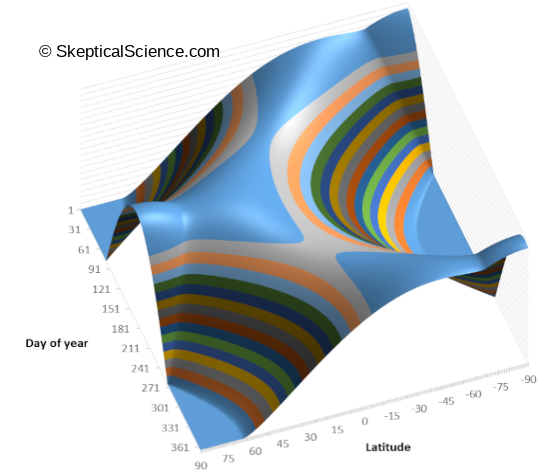
Figure 3. Daily total extraterrestrial radiation as a function of day of year and latitude.
You may be surprised to notice that the greatest single day totals happen at the poles, on the summer solstice, not at the equator or the tropics. Although the sun never gets high in the sky at the poles, you get 24 hours of daylight with the sun at an elevation of 23-1/2 degrees all day on the solstice. Of course, this contrasts with winter – the polar night has no sun at all.
If we look at annual averages of extraterrestrial radiation versus latitude (figure 4), then we see our expected concentration of solar radiation in the tropics. This equator-pole difference is, of course, the primary driver of weather and climate. Much energy needs to be redistributed from tropic regions to polar regions, and this drives atmospheric and oceanic currents.
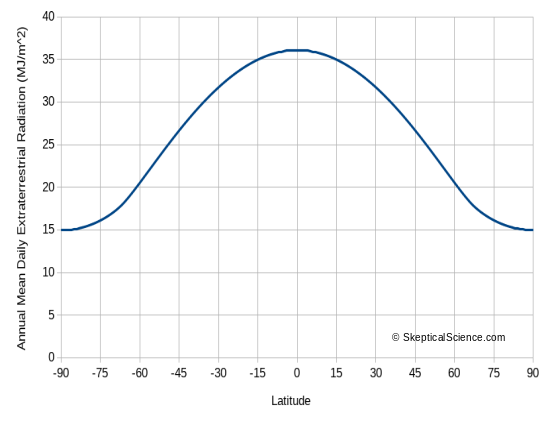
Figure 4: Mean annual extraterrestrial radiation versus latitude.
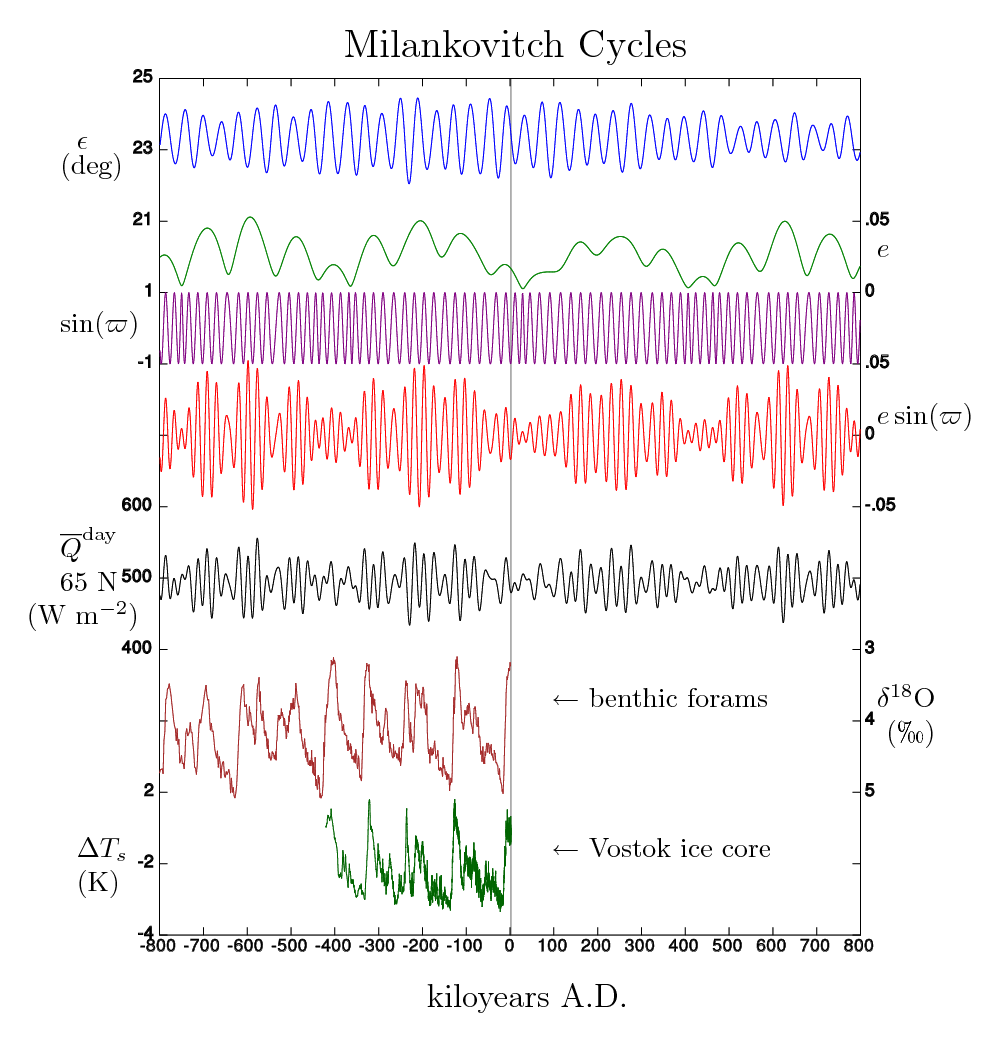
What Milankovitch did 100 years ago was look a the orbital variations over the past 650,000 years, and calculate the changes in radiation received by the earth. Milankovitch himself knew that seasonal cycles were important when he proposed the concept nearly 100 years ago. In order to focus on the seasonal aspect of the cycles, he picked the northern hemisphere, at 55°N, 60°N, and 65°N, and on the summer solstice – the longest day of the summer, when insolation is at its peak. To this day when you see graphs of “Milankovitch insolation”, it will usually be for 65°N on the summer solstice. You will frequently see graphs like this one, from Wikipedia:

Figure 5: Milankovitch cycles and selected paleoclimate indicators, from Wikipedia.
Milankovitch Cycles and Glacier Growth
The visual match between Milankovitch cycles and the glacial/interglacial cycles is quite striking, but why a single day at a single latitude? This represents the peak seasonal input of solar energy – but how does it relate to glaciation? Well, 65°N is a useful indicator of variations in solar input, but it is only a very small part of the picture.To grow a glacier the size of a continent, you actually need a lot of things to work together:
- Glaciers have a “mass balance” – the difference between winter accumulation of precipitation, and the losses due to summer evaporation/sublimation and movement of the glacier.
- Glaciers need a source of moisture, to provide precipitation inputs.
- Glaciers need a slow rate of summer melt, so snow and ice can accumulate.
- Once you have snow that survives a summer, you get a perennial snow patch, but it takes more to get a glacier.
- Glaciers need to survive long enough that the snow compacts to form ice, and enough ice accumulates that it will start to flow.
- It takes centuries or millennia to grow them.
- When they get large enough, glaciers will flow downhill. (If they are big enough, they can make their own hill.)
- Glaciers will have an accumulation zone, where precipitation exceeds melt, and an ablation zone, where melt exceeds precipitation. Ice will flow from the accumulation zone to the ablation zone.
- Mountain glaciers typically accumulate mass in the high altitudes, and flow downhill to warmer locations where melt exceeds accumulation.
- Continental glaciers typically accumulate mass well away from ocean sources of moisture, and flow towards the oceans.
Figure 6 shows a schematic diagram of the current Antarctic ice sheet, showing the flow from the central accumulation zone to the margins where ice is lost.
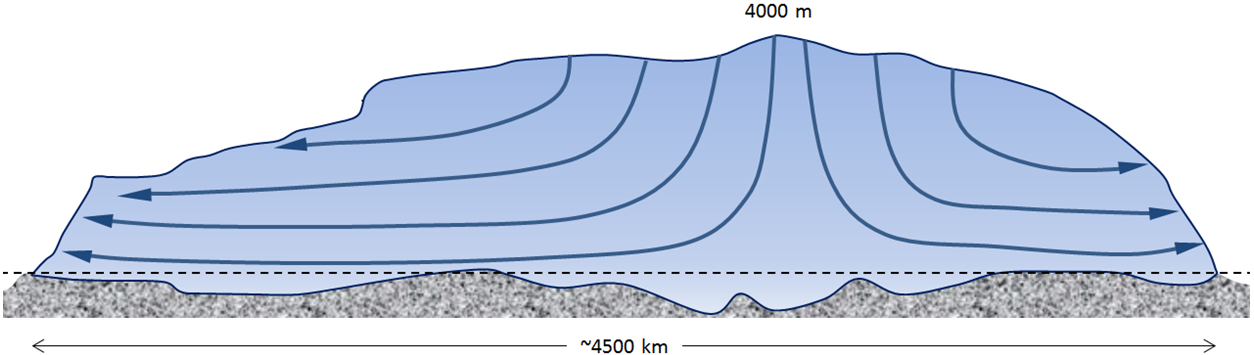
Figure 6: Schematic diagram of Antarctic ice flow. From B.C. Open Collection, by BCcampus.
Getting rid of a continental glacier also requires a lot of things to work together. Input of solar radiation is a start, but most glacier melt happens at the margins, and involves a lot of energy brought in by atmospheric or oceanic circulation from other locations. Warm air or ocean currents, or rain – all provide significant energy inputs. You also need to compare the melt rate to the flow rate from the accumulation zone of the glacier. The glacier shrinks when melt exceeds accumulation. This becomes a global climate issue, not a local or regional one. And to examine this in any sort of detail, you need to build this all into some sort of climate model – preferably one coupled with a model of glacial dynamics.
If you perform a literature search for such work, you will find many, many papers on the subject. A lot of modelling of glacial climates was done in the 1970s and 1980s, when rapid growth in the availability of computing power led to rapid development of suitable models. (According to the Wikipedia page, Milankovitch took 100 days to perform his calculations for a single day at three latitudes, over his 650,000 year period. Imagine trying to do global calculations over the entire year.) As more and more paleoclimate work was done, more and more evidence accumulated linking Milankovitch cycles to things like monsoon strength, ocean circulation, regional vegetation changes, etc. Known changes in CO2 concentration can be used in detailed climate models, so that the greenhouse gas effect of these changes can be included.
If you read these studies, a common factor is that the modelling almost invariably includes both a global climate model and a glacier dynamics model. You need the climate model to provide the surface radiation, temperature, and precipitation patterns, and you need the glacier dynamics to grow and melt an ice sheet and determine its flow.
Ellis and Palmer: Elementary Errors
Lots of people have refined Milankovitch’s calculations, and looked at finding the cycles in various paleoclimate records (much more than just glacial cycles), and the climate science community has pretty strong confidence that Milankovitch cycles are an important driver of climate change.
Ellis and Palmer do not disagree with this basic viewpoint. Where they disagree with the vast majority of the climate science community is the mechanism whereby seasonal and latitudinal changes in insolation lead to glacial/interglacial cycles. It is well-known that you can’t explain these glacial cycles simply on the basis of mean annual global insolation. The explanation must lie in the seasonal and latitudinal changes, which work through the complex patterns of atmospheric and ocean circulation, and the hydrologic cycle. Feedbacks are also important. These are discussed in the Hausfather post linked earlier, and are a key aspect of Ellis and Palmer’s argument.
So, what argument do Ellis and Palmer present to say all of this work is wrong? They present a “conundrum” in the very first paragraph of their introduction - a claim that many of the insolation maxima in the Milankovitch series “only trigger minor warming events, and so interglacials only occur after four or five insolation cycles.”. In section 2.3, figures 1-3 and table 1, they present an argument that basically comes down to a visual examination of graphs. They also state that positive changes in insolation in the southern hemisphere do not lead to increasing temperature, and claim that land masses are more important than oceans, and the explanation is likely albedo.
Of course land masses vs ocean are important – that is part of the standard recognition that continental ice sheets grew primarily in the northern hemisphere. This ties into the whole aspect of glacier dynamics – sources of water, winter snow, reduced summer melt, etc. The way the Ellis and Palmer express this is a strong indication that they really have very little understanding of the science of glacial cycles – either from a climatological or a geological/glaciological viewpoint. Depending on which area of the globe you are talking about, glacial maximum or the onset of deglaciation happens at different times, because of a different balance in all the factors affecting ice growth or decay.
So, what do Ellis and Palmer present to support their albedo hypothesis? They provide a number of diagrams and discussion of the effects of dust on the albedo of ice-covered surfaces. They look at sources of data on dust through the glacial cycles, and all of this seems to represent a reasonable discussion of the potential albedo changes. They provide numerous references to support the role of dust and snow albedo changes. Yes, snow covered with dust reduces albedo. Yes, as snow and ice melt, dust embedded in the ice will tend to accumulate at the surface, leading to darker snow that will absorb more solar radiation.
None of this is new or controversial. The problem comes in when Ellis and Palmer try to estimate the influence of these effects on the radiative forcing and the melting of ice sheets. As mentioned above, the way this is usually done is to build that sort of albedo response into a global climate model, combined with a glacial dynamics model, and calculate the growth and decay of the continental ice sheets over glacial/interglacial cycles.
So, what is the climate model presented by Ellis and Palmer? It is presented in their tables 2 and 3, and the related discussion. In table 2, they pick the 65°N maximum daily summer solstice insolation value (540 W/m2) at the peak of a Milankovitch cycle, and compare it to the corresponding value at a cycle minimum (450 W/m2). They call these two periods the Great Summer, and Great Winter (for dramatic effect?) In table 3, they derive an albedo effect related to increased dust, and conclude that it leads to 180 W/m2 greater absorption during their Great Summer, compared to a Great Winter.
Read the above paragraph again carefully. Yes, what Ellis and Palmer did for their “climate model” was to take one day, at one latitude – the summer solstice, at 65°N – and make estimates of the extra solar energy absorbed to melt snow when it is covered by dust. Comparing a “Great Summer” and a “Great Winter”, they come up with a value of 180 W/m2 as their driving force to explain glacial/interglacial cycles. Let’s look again at the current seasonal distribution of extraterrestrial radiation, repeated from figure 3. Here it is again in figure 7, with an X marking the one day of the year and the one latitude that Ellis and Palmer included in their climate model. Can anyone seriously think that the global seasonal distribution of radiation can be summarized with that single value?
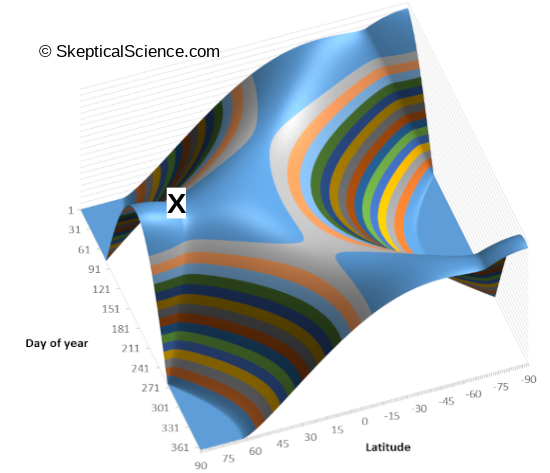
Figure 7: A copy of figure 3 (daily total extraterrestrial radiation as a function of day of year and latitude) with an X marking the only day and latitude (summer solstice, 65°N) that Ellis and Palmer use in their calculations.
Are the numbers in Ellis and Palmer reasonable? In a word, no. The summer peak insolation at 65°N is far larger than the annual average. Continental glaciers don’t melt in one day. How much energy is realistically available at 65°N? Figure 8 provides a 30-year average of surface-received solar radiation. At 65°N the annually-averaged insolation at the surface is typically somewhere around 10-12 MJ/m2/day (about 125 W/m2) or less. Compare this to Ellis and Palmer’s “estimate” of a difference of 180 W/m2 – their difference between “Great Summer” and “Great Winter” is greater that the current annual mean! By picking the peak seasonal value at the solstice, Ellis and Palmer have grossly exaggerated their potential albedo feedback. Even if their albedo estimates are reasonable, their radiative forcing values are basically bogus.
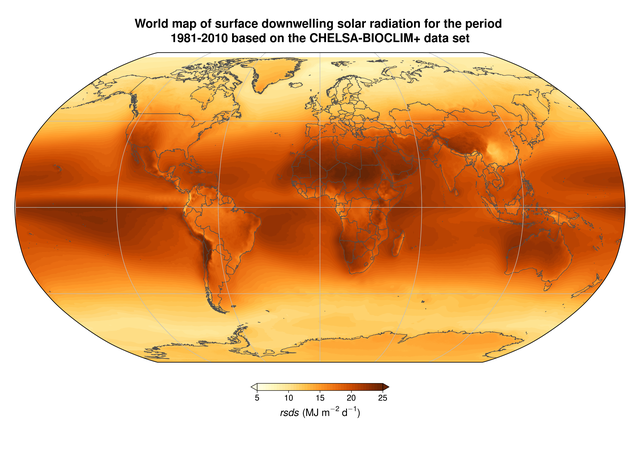
Figure 8. Solar radiation received at the surface. From Wikipedia.
Remember that Milankovitch looked at 55°, 60° and 65°N on the summer solstice. This was used to illustrate how the seasonal variations of insolation can be quite large (even though global annual average barely changes) – but no sensible glacier mass or energy balance estimate would try to determine annual effects based on a single day of the year. Figure 9 shows similar calculations for additional latitude values. You need all those values and more to model the global climate.
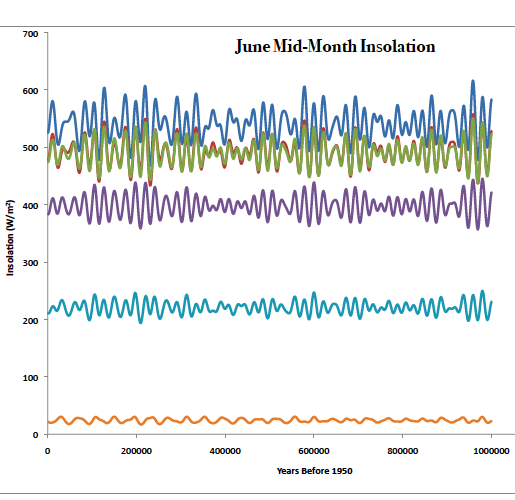
Figure 9: From the Skeptical Science blog post on Milankovitch cycles. Variations in June (daily averaged) insolation (W/m2) over the last 1,000,000 years (0=1950) at (blue= 90N), (red = 60N), (green =30N), (purple=Equator), (light blue = 30S), (Orange=60S). Data from Berger A. and Loutre M.F., 1991, Insolation values for the climate of the last 10 million years, Quaternary Sciences Review, Vol. 10 No. 4, pp. 297-317
Do Ellis and Palmer actually understand what they have done here? Apparently so, as they attempt to justify it. They present this as a regional value, and argue that it is incorrect to “spread the albedo effect out across the entire globe in a similar fashion to the calculation for CO2” (section 3.2) They are wrong. The global radiation balance is a global process, and proper calculation of the effects must look at all locations, all seasons. Yes, albedo is a local phenomenon, but global absorbed solar radiation is not. The atmosphere and oceans move energy around. To use only 65°N on a single day is equivalent to completely isolating that location on earth from all the rest of the climate system – and the rest of the year.
Continental ice sheets do not exist in complete climatological isolation. At the top of page 895, Ellis and Palmer have a statement about glaciers not caring about temperatures in Argentina, so only local effects count. This is absurd. Continental glaciers get their snow inputs from other parts of the world (the oceans). Temperatures over the glacier are linked to everywhere else through the global energy balance and atmospheric motions. Even for a weather forecast, you need to look at conditions across large areas to forecast conditions over the next week. On a climatological basis, features such as the El Nino/La Nina cycles in the sub-tropical Pacific affect the entire globe. The entire global atmospheric circulation is dominated by the equator-pole differences in solar input (Figure 4), and continent-ocean contrasts drive phenomenon such as the monsoons. This is a globally-connected system, and to think that the melt at the edges of a continental glacier will occur in complete isolation is incredibly naive.
Note that Ellis and Palmer include a precipitation map in their figure 7, which shows changes in temperature and precipitation between the last glacial maximum and now. The precipitation part is copied below as figure 10. (They fail to give units for the precipitation changes....) They discuss spatial patterns of this figure – but they cannot realize that precipitation patterns are a factor in glacier growth? Look back at figure 1, above, that shows the areas covered in the last glaciation. Again, note that eastern Asia is not ice covered – in spite of it getting the same extraterrestrial radiation input as all other locations at 65°N. Note in the figure below how precipitation changes in North America, western and northern Europe, and east Asia are not the same. Ellis and Palmer should have bought a clue with that figure, but its significance has escaped them.
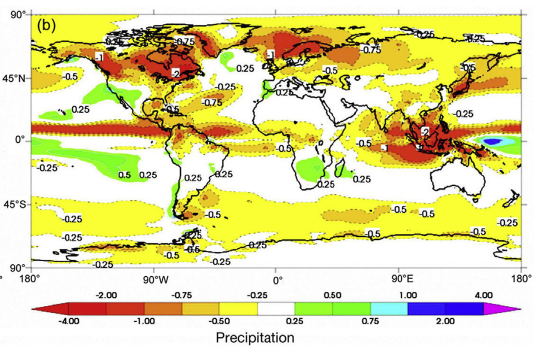
Figure 10: Ellis and Palmer’s figure 7b, showing precipitation differences between current and last glacial maximum climates.
The last part of Ellis and Palmer's radiative argument compares CO2 forcing to their inflated 180 W/m2 albedo forcing. The value they use for the CO2 effect is 0.006. That seems awfully small – until you realize the units they are using: W/m2 per decade. How do they get this? When was the last time you saw a radiative forcing expressed in units that include “per decade”? Well, they take a perfectly reasonable published estimate of the CO2 radiative forcing of 3 W/m2, for the change between 180 and 280 ppm, and then state that you need to divide it by the number of decades in a 5000-year interglacial warming event.
I kid you not: Ellis and Plamer take an energy flux that is already a rate per unit time (since a Watt is, and always has been, a Joule/second), and divide it by time again. This is like saying that a 100W incandescent light bulb uses almost no electricity, because over a typical lifetime of 2000 hours of use it only uses 0.05 W/hour. You can try to sell that idea to your electricity supplier, but they are still going to charge you for 200 kWh of electricity over the life of that bulb – they know how to combine Joules of energy and units of time.
Ellis and Palmer also try to dismiss the 0.006 W/m2/decade value by saying that it is “about a third of the energy required to power a honey bee in flight” (p894). They do give the illusion of authority by providing a reference for this. If you look at that reference, you will find that the reference states that bees generate “spectacular rates of metabolism and aerodynamic power (up to 0.8·W·g–1 and 0.2·W·g–1, respectively”. The reference does give other typical metabolic rates of 0.1-0.3 W·g–1. But how much does a bee weight? About 0.1 g, so the metabolic rates work out to a range of 0.01-0.08 W per bee. So, in order to make their “about a third” comparison, you need to compare bee metabolism in W to a bogus 0.006W/m2/decade. Note that we have two radical inconsistencies in units here: the CO2 radiative forcing is per square metre (so we need to account for the area of the earth to get total watts), and we have the “per decade” obfuscation. At 3 W/m2 for CO2, you would need 300 bees per square metre (at 0.01 W per bee) to match.
Comparing numbers with mismatching units is the sort of things that results in failure in a grade school exam. What Ellis and Palmer have done is like me claiming that I can walk far faster than a 200 km/h Porsche, because I can easily walk at a speed of 9000 furlongs per fortnight.
Deglaciation time
As a last illustration of the bogosity of the Ellis and Palmer calculations, let’s think about that “5000 year” length for interglacials, which they use in the CO2 radiation flux mangling. How long does it actually take to melt a continental ice sheet? In the following paper, Dyke (2004) provides a series of maps of the North American deglaciation from its onset about 18,000 years ago, ending 5,000 years ago.
Dyke, Arthur S. "An outline of North American deglaciation with emphasis on central and northern Canada."Developments in quaternary sciences 2 (2004): 373-424.
https://www.sciencedirect.com/science/article/abs/pii/S1571086604802094
I have collected those individual maps into an animation in figure 11.
Figure 11: an animation of the sequence of maps from Dyke (2004), showing the deglaciation of North America from 18,000 to 5,000 BP.
A few points to make:
- As mentioned earlier, it takes time to melt a continental glacier. 13,000 years in this case. If Ellis and Palmer had realized this, they could have cut their CO2 forcing down to close to 0.002 W/m2/decade! (They’d be even more wrong.)
- The melt pattern is quite complex. At each stage, we’re looking at multiple ice margins, at multiple latitude and longitudes.
- We also have multiple areas of ice accumulation – each with its own patterns of precipitation sources.
- In the later stages, ice margins that terminate in glacial lakes or oceans become quite extensive, and the water bodies are a primary melt factor.
- Ice flow rates will be changing during that period, as accumulation zones shift.
The Ellis and Palmer focus on variations in solar input on the summer solstice at 65°N ignores virtually all of this.
For what it's worth, the onset of deglaciation of the West Antarctic Ice Sheet was more like 14,000 BP, triggered by an abrupt rise in sea level. Different ice sheet, different mechanism, different timing. A concept foreign to Ellis and Palmer in their "one true factor" mindset.
Conclusion
There are several more questionable aspects to the Ellis and Palmer paper, but I have run out of room. Regardless of the suitability of the Ellis and Palmer estimates of snow/ice albedo under dusty conditions, they exhibit an abject failure to work those values into any sort of climate or glacial dynamics model. So many important factors are ignored or dismissed with a wave of the hands. They show no understanding of the carbon cycle, with its various geological and biosphere processes (and how they change over time). They show no understanding of the processes of snow and ice melt - the energy inputs (other than solar radiation input) and melt water removal.
Their basic argument of “see, it’s albedo” has no realistic calculation of radiative inputs to a glacier, and relies almost entirely on a sequence of graphs showing correlations between dust, CO2, and temperatures.
Interestingly, in the caption to their figure 1, they use the phrase ““CO2 concentration follows global temperatures very closely, giving the illusion of CO2 being the primary causal feedback factor.” [Emphasis mine] That “illusion” is supported by detailed climate and glacier dynamics models and extensive analysis in the scientific literature. Ellis and Palmer have nothing but a few graphs to support the illusion they are trying to sell about albedo being the only significant feedback.
In spite of these weaknesses, Ellis and Palmer have the hubris to finish their introduction with the statement “And while this proposal represents a reversal of conventional thinking it does explain each and every facet of the glacial cycle, and all of the many underlying mechanisms that control its periodicity and temperature excursions and limitations.” They think that their proposed mechanism is an explanation of Life, the Universe, and Everything glacial. It is not even a start – they have multiplied six times nine and gotten 42.
The paper by Ellis and Palmer does not represent a useful addition to the scientific literature.


"the paper...[argues] that low CO2 leads to low vegetation, which leads to increased dust" How does this comport with general knowledge? Vegetation requires sunlight, soil, and water, primarily. In what ecosystem is CO2 the limiting factor... deserts? In deserts, low CO2 should shrink the Hadley Cell, shrinking the desert, i.e. more vegetation, not less. I can't think of another ecosystem for which 'low CO2 leads to low vegetation' sufficient to rob the surface of all vegetation, i.e. create dust. As long as there is sunlight, soil, and water, you're going to grow stuff. And, as we've seen with hydroponics, you don't even need soil. Perhaps below 200ppm of CO2, the authors have a case. But, if so, do they prove it? And do they prove it for CO2 above 200ppm? It seems to me that for most vegetative areas, a CO2 above 200ppm precludes it as a limiting factor in vegetative growth.
"low CO2 leads to low vegetation... increased dust... reduce[d]... ice sheet albedo... end of a glacial period...[= higher temperature]." Condensed, the claim is "low CO2... = higher temperature". This demonstrably hasn't been true at any time in the last 400,000 years. If these guys think low CO2 leads to higher Earth temperature, it seems they should have to demonstrate that.
ubrew12:
The mechanism that Ellis and Palmer argue for their low CO2=low vegetation (cover, not height), is rather convoluted and you need to read their paper to see what they say. It's covered in their section 5.
Part of what they do is summarized in table 4 of their paper, where they list reductions in CO2 affecting treeline. They use CO2 values of 150 for alpine treeline (2000m altitude), and 115 for tropical treeline (4000m altitude)....
...but you need to carefully read the table to notice that they are using CO2 values in μbar, not ppm. How do they get these numbers? Well, at sea level (1 bar, or 1000 mb pressure), an interglacial CO2 concentration of 300ppm equates to 300 μbar, and a glacial CO2 concentration of 190 ppm translates to 190 μbar. They then use the standard decrease in pressure with height - at 4000m, pressure drops to about 620 mb - and 190 ppm translates to a partial pressure of CO2 of only 115 μbar.
When I read the Gerhard and Wort paper Ellsi and Palmer cite, it does not support using CO2 values in μbar. It does discuss plant response vs. altitude, and plant response at low CO2 levels, but nearly all the discussion focuses on units of ppm.
So, like the flying bee example, Ellis and Palmer choose to do a unit conversion and calculation that favours the conclusion they want to support, without really justifying the logic. Perhaps someone who knows plant physiology better than I can provide a solid argument why partial pressure rather than concentration is important for plant uptake of CO2, but Ellis and Palmer do not convince me.
Ellis and Palmer's story and its potential appeal, in addition to presenting significant misunderstandings, is an example of what can happen when scientific investigation of a part of the bigger picture fails to be presented in the full context of the bigger picture.
Even if the investigation and reporting about the part is accurate, failing to situate it in the bigger picture, especially failing to investigate and present the potential harms associated with the part being investigated, can end up being applied to develop harmful popular and profitable beliefs and activity (it actually often happens).
Learning about the constantly improving understanding of what is harmful and unsustainable is fought against by people who develop a powerful interest in 'evading learning to be less harmful and more helpful'.
Bee's even offer an example. The scientific development of chemicals that can be profitable did not include an indepth investigation of the more complex potential for harm to be done (that is difficult because of the complexity, and it would be expensive and take time). And now the people profiting who did not do that 'harder to do' investigation of the potential harm get to 'legally' demand that 'others have to do the harder work of conclusively proving the harm done (like the tobacco people still claim that the exact biological mechanisms of harm caused by smoking are not conclusively proven'. The scientifically beneficial development of the chemical was quickly embraced and exploited without serious concern for potential harm done.
Back to the story made up by Ellis and Palmer. Aspects of it are attactive to people wanting to ignore the harm of fossil fuel use ... because they benefit from fossil fuel use, and fossil fuel use got to be popular and profitable before the harmful consequences were investigated and better understood.
OPOF:
In the paper, Ellis and Palmer make no direct mention of any implications of their work for future climate. As it stands, it is a simple attempt to understand what might have happened in past climates.
Of course, the reason why the discipline of climatology looks at past climates is due to the old adage "the past is the key to the future". If we understand how and why climate has changed in the past, we have a greater chance of being able to predict future events. The IPCC reports give extensive coverage to past climates, for this specific purpose.
We can only guess what Ellis and Palmer wished to imply - if we restrict ourselves to what they say in this paper (which is the proper way to review a paper). But it is easy to see why this paper is attractive to those that wish to imply that CO2 has no radiative effect.
Something obvious seems to have been missed here. The paper says that increased CO2 leads to more greening of the planet and thus less dust on the ice sheets, and so a cooling effect (parpahrasing). But we have had increased CO2 and increased greening of the planet and a warming effect. Doesn't this failure of their prediction kill their idea dead, all other things being equal?
nigel:
You have to read the paper to try to follow the logic (as such) of their argument about CO2 and temperature. It is rather convoluted.
Section 2 of their paper discusses the Milankovitch cycles, and introduces their "see - huge difference in input of energy on summer solstice at 65N" calculation. They use this to argue that albedo reductions due to dust on snow are the real feedback factor explaining how Milankovitch cycles can grow or melt a continental glacier.
In section 3, they do their bogus comparison between the dust-albedo feedback and CO2 radiative effects.
In section 4, they expand on the dust albedo factors.
In section 5, they give their hypothesis how low CO2 leads to reductions in vegetation cover, and how this is what leads to high dust concentrations that accumulate on the ice/snow of the glaciers. It's this last step that allows low albedo that allows the increased solar input (again, summer solstice at 65N) of the Milankovitch cycles to trigger deglaciation.
At the end of it all, they are basically saying that nothing else makes much difference as Milankovitch cycles go through their many wiggles, until vegetation gets so low and albedo of the snow and ice gets low enough so that a high in the 65N summer solstice Milankovitch cycle can finally melt a continent worth of ice.
It's all hanging together by a very thin thread, and their "analysis" is sadly lacking in any sort of model that actually incorporates anything of global/regional climate, the carbon cycle, and glacial dynamics and accumulation/melt.
One criticism of Ellis & Palmer (2016) that can be hurled with some confidence is that it has not exactly set the literature alight since it was published six long years ago. That tends to suggest it presents a badly failed hypothesis.
I note one of the citations listed by Google Scholar is for a later unpublished work co-authored by Ellis (evidently 2019 or later) which doen't make such a big thing about this CO2-dust mechanism, although it does continue to stress that CO2 was not the main driver of the ice-age cycles, which most would agree with.
One of the factors working against the grand assertion of Ellis & Palmer (2016), that CO2 leads to reduced plant-growth and thus more dust & lower albedo; one factor is the switch of ice-age period from 40k to 100k. This switch is usually explained by the dust during the earlier 40k phase being diminished as the bare plantless lands close-by glaciated areas were being scoured clean of any dust-generating soils by prior glaciations, scoured back to the bedrock. If this dust is alternatively explained by reduced CO2 suppressing plant-growth, the 40k-100k transition requires a new explanation. And given this requirement the apparent silence by Ellis & Palmer (2016) on the matter is entirely wrong.
The albedo argument of Ellis and Palmer is an odd one. They explicitly state in their section 3.2 that they think it is incorrect to consider the albedo effect as a global one. In discussing the common approach to albedo feedback amounts, and comparing it to the CO2 feedback, they state:
They go on to argue that their localized "one day, one latitude" calculation of radiative effects is the proper one to use. They conclude one paragraph with:
To put it simply, the change in local or regional albedo represents one part of global albedo. To address the question of how much solar radiation the globe absorbs (which is the proper question for looking at global climate), you need to consider all of the globe - each latitude, each day, and each individual surface cover. The contribution of a single location is directly proportional to the area it covers - as a fraction of the total area of the planet.
Global changes in global albedo, caused by large white ice sheets replacing dark forests (or the reverse), is an important feedback. When climate science speaks "albedo feedback", it is this large scale issue that they mean, not Ellis and Palmer's local microclimate one.
The Rapp et al unpublished paper that MA Rodger refers to is an interesting side note. It still focuses on albedo and high-latitude insolation. It at least considers the entire year, not just the summer solstice, but it's efforts at modelling still are extremely simplistic - empirical fits between ice volume and variations in solar input. No actual climate model to provide precipitation inputs or melt processes, or glacier dynamics models to accumulate ice and move it from zones of accumulation to zones of melt.
The Rapp et al paper also seems to be rather confused about CO2 as a feedback vs. CO2 as a forcing. They argue against a straw man: that mainstream climate science thinks that CO2 is supposed to force the glacial/interglacial cycles. (It does not.) CO2 is one feedback. The overall CO2 level influences whether climate will respond to Milankovitch cycles by producing glacial/interglacial cycles, but it does not cause the individual glacial/interglacial periods. A world at 200 ppm CO2, a world at 300 ppm CO2, and a world at 450 ppm CO2 will not respond to orbital changes in solar insolation in exactly the same way.