


 Arguments


The difference between land surface temperature and surface air temperature
Posted on 2 August 2023 by John Mason
Tarmac melts at around 50oC, depending on its exact composition. That's according to the Road Surface Treatments Association, who ought to know about such things.
What's that got to do with this subject? Well, most people are familiar with melted tarmac on sunny summer days, yet few of the world's countries have ever recorded surface air temperatures of 50oC - yet. But it doesn't need surface air temperatures that high to melt tarmac. Tarmac is dark and that means, like other dark surfaces, it absorbs almost all incoming Solar radiation. The result is that on a clear sunny summer's day, tarmac can get very hot indeed when local surface air temperatures are just 35°C or so.
The current, verified European maximum surface air temperature was recorded on 11th August 2021, when it reached 48.8°C in Floridia, a town in the Sicilian province of Syracuse in the Mediterranean. This year, so far, in a prolonged heatwave beginning in the second week of July, Syracuse in Sicily recorded 47.8°C on July 24th (to be verified), while Jerzu, Sardinia, recorded 48.2°C on the same day - if verified, the hottest July day on record for Europe. 40-46°C was recorded widely from Spain across to the Greek Islands, on multiple days. That's horribly hot by most standards, regardless of whether records do fall or not.
With this 48°C heatwave coming to an end, we can look at some emerging mythology around it, starting here:

This headline and accompanying blog was republished at Watts Up With That (WUWT) on July 19th 2023 and has been archived for future reference here: https://archive.is/LDRxJ. WUWT serves as a sort of amplifier, one among many, for stories and conspiracy theories emerging in various dimly-lit corners of the Internet.
The trouble with stuff like this is that once amplified, it goes viral thanks to social media. The core of this emergent climate myth was the fictitious (to put it mildly) claim that the European Space Agency (ESA) had done something very, very naughty:

Tweet, posted on 14th July 2023, archived here.
I went to the relevant, linked-to ESA page, also archived here, for a look. On Thursday July 13th, they said:
"Temperatures are sizzling across Europe this week amid an intense and prolonged period of heat. And it’s only just begun. Italy, Spain, France, Germany and Poland are all facing a major heatwave with air temperatures expected to climb to 48°C on the islands of Sicily and Sardinia – potentially the hottest temperatures ever recorded in Europe."
Hmm. Well it had only just begun. The following week - in many places - temperatures shot up into the mid-40s, climaxing with that unverified 48.2°C on the 24th in Sardinia. Not all-time record-busting - but uncomfortably close. This is the ECMWF 2m temperature forecast for midday on July 18th, for example:
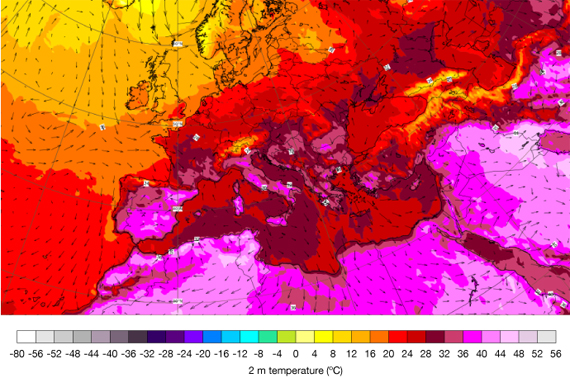
Surface air temperatures from 36-44°C were expected widely over Spain, Sardinia, Sicily, the Italian Mainland and in parts of Greece. Those are not forecast land surface temperatures. Surface air temperature maximum values recorded on the 19th, on the very same day the WUWT blogger was decrying the heatwave as pure invention, were as follows:
Greece - Kalamata, 42°C; warmest overnight minimum Kalymnos, 30°C
Italy - Decimomannu, 46°C; warmest overnight minimum Mesina, 29°C
Spain - Malaga AP/Alora, 44.2°C; warmest overnight minimum Malaga Met Centre, 31.1°C
The way surface air temperatures are measured is explained by the UK Met Office, also archived here:
"A platinum resistance thermometer (PRT) is used for the measurement of air temperature at all synoptic stations and all supplementary stations that employ an automatic system. The thermometer is exposed in a Stevenson screen at a height of 1.25 m above the ground and aspirated only by natural ventilation through the side louvers."
One of the reasons for measuring the surface air temperature above the ground is that this point samples the average temperature over a distance of a hundred metres or more upwind. The air is not being heated by the single point directly underneath the thermometer, but by all the surfaces that exist through that hundred metres. Even though the land surface temperature will be very different between e.g. a tarmac surface and a lawn, the air temperature at 1.25 m above the ground will be pretty uniform and thus representative of local conditions. Mixing of the variably-warmed air through turbulent flow smooths it all out.
Land surface temperatures are, however, also recorded and are obviously useful too. Here is a land surface temperature map for the morning of July 17th 2023:
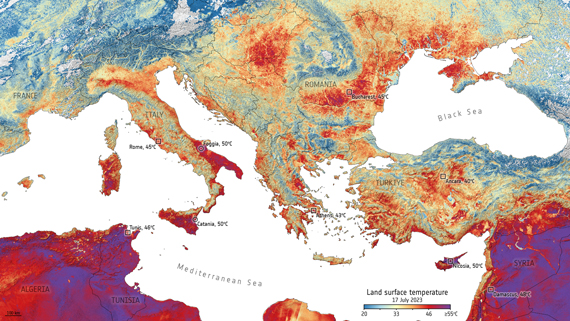
You will immediately note that there is a difference between the two charts. In the ECM surface air temperature forecast chart, temperatures were expected to reach the low to middle 40s. But in the land surface temperature observations map, the ground in some of the same spots is hitting 50C. It's worth making the point again: on a sunny day in a heatwave, many land surfaces become hotter than the air - that's how tarmac can melt in a sunny spot. This image uses data from the Copernicus Sentinel-3 mission’s radiometer instrument.
The ESA say (also archived here):
"The Sea and Land Surface Temperature Radiometer (SLSTR) is a dual-view scanning temperature radiometer, which flies in low Earth orbit (800 - 830 km altitude). There are currently two instruments in orbit, on board the Sentinel-3A and Sentinel-3B satellites. Sentinel-3 is an operational mission that is part of the Copernicus programme.
The principal objective of SLSTR products is to provide global and regional Sea and Land Surface Temperature (SST, LST) to a very high level of accuracy (better than 0.3 K for SST) for both climatological and meteorological applications. There is also provision of aerosol retrieval and fire radiative power information as additional products.
One of the primary mission objectives of the SLSTR instrument is to extend the long-term, consistent set of global Sea Surface Temperature (SST) measurements. SLSTR provides data continuity back to 1991 as its data permit the continuation of data-sets from previous instruments: Along Track Scanning Radiometer (ATSR) on ERS-1, ATSR-2 on ERS-2 and the Advanced Along Track Scanning Radiometer (AATSR) on Envisat."
So there you have it. The ESA have been monitoring land surface temperatures from space since 1991. Surface air temperatures and land surface temperatures have both been recorded for years and the, "48°C Horror That Never Was", did happen in this heatwave (subject to verification), after many days during which severe heat conditions had persisted. More importantly, the prolonged nature of the heatwave and also the very high overnight minima would have had the most severe impacts in terms of human health.
Almost exactly a year ago, I commented on a second emergent climate myth here at Skeptical Science, in a post marking the first instances (yes, multiple) of 40oC being recorded in the UK during that year's heatwave. This other myth involved stating that old forecast graphics did not have all those scary shades of red on them – indicating high temperatures. Never mind that similar colour-scales have been used for almost as long as I've been alive (60 years plus). I've always understood that blue colours mean cold, red ones hot. It says so on the taps of most sinks and baths, so why others do not understand this remains one of life's mysteries. The 'changing colours' talking-point is still wild out there, a year later, to the extent that the UK Met Office published an explainer about the colour-scale on their official blog on July 27th. To put it simply, the maps are turning more red at times because it's darned hotter at times. No conspiracy: nothing more to see. Move along now.
People who create and/or circulate such myths are denying plain reality. That reality is that it got extremely hot across southern Europe for a prolonged period in July 2023. Such prolonged heat is a serious health-hazard, never mind the appalling wildfires that made the headlines this week. Science has long predicted a greater frequency and greater intensity of heatwaves and that is exactly what is happening. As one-time UK Prime Minister Harold Macmillan commented when he was asked what was the greatest challenge for a statesman: "Events, dear boy, events". Likewise, events will become an increasingly awkward challenge to those who continue to insist there's nothing untoward going on with our climate.


"People who create and/or circulate such myths are denying plain reality."
There's a lot of it about at the moment John! My own recent article on the creation and circulation of similar myths takes a look at some theory whilst also debunking some specific "skeptical" memes:
https://GreatWhiteCon.info/2023/08/the-information-war-with-the-fossil-fuel-industry/
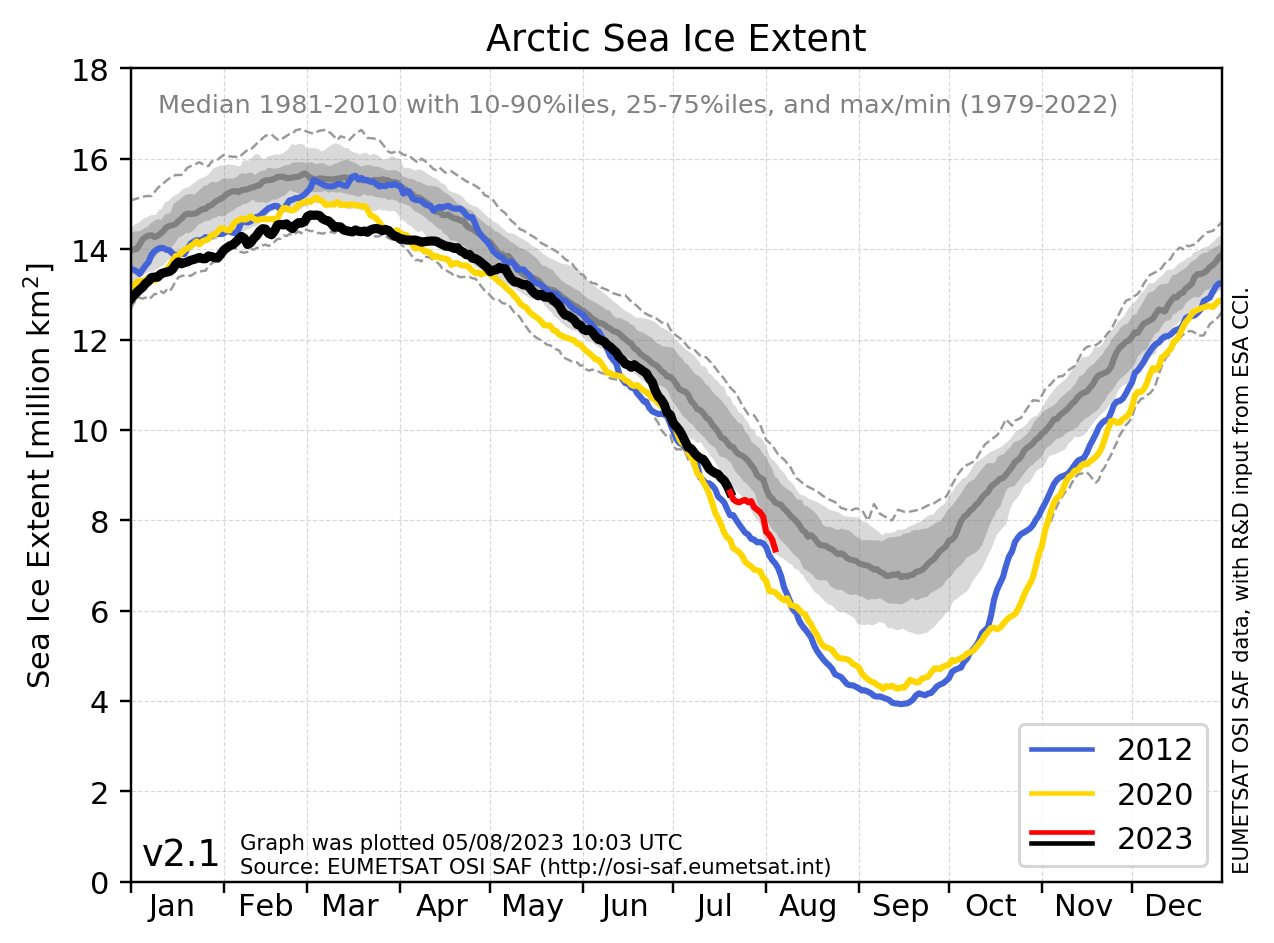
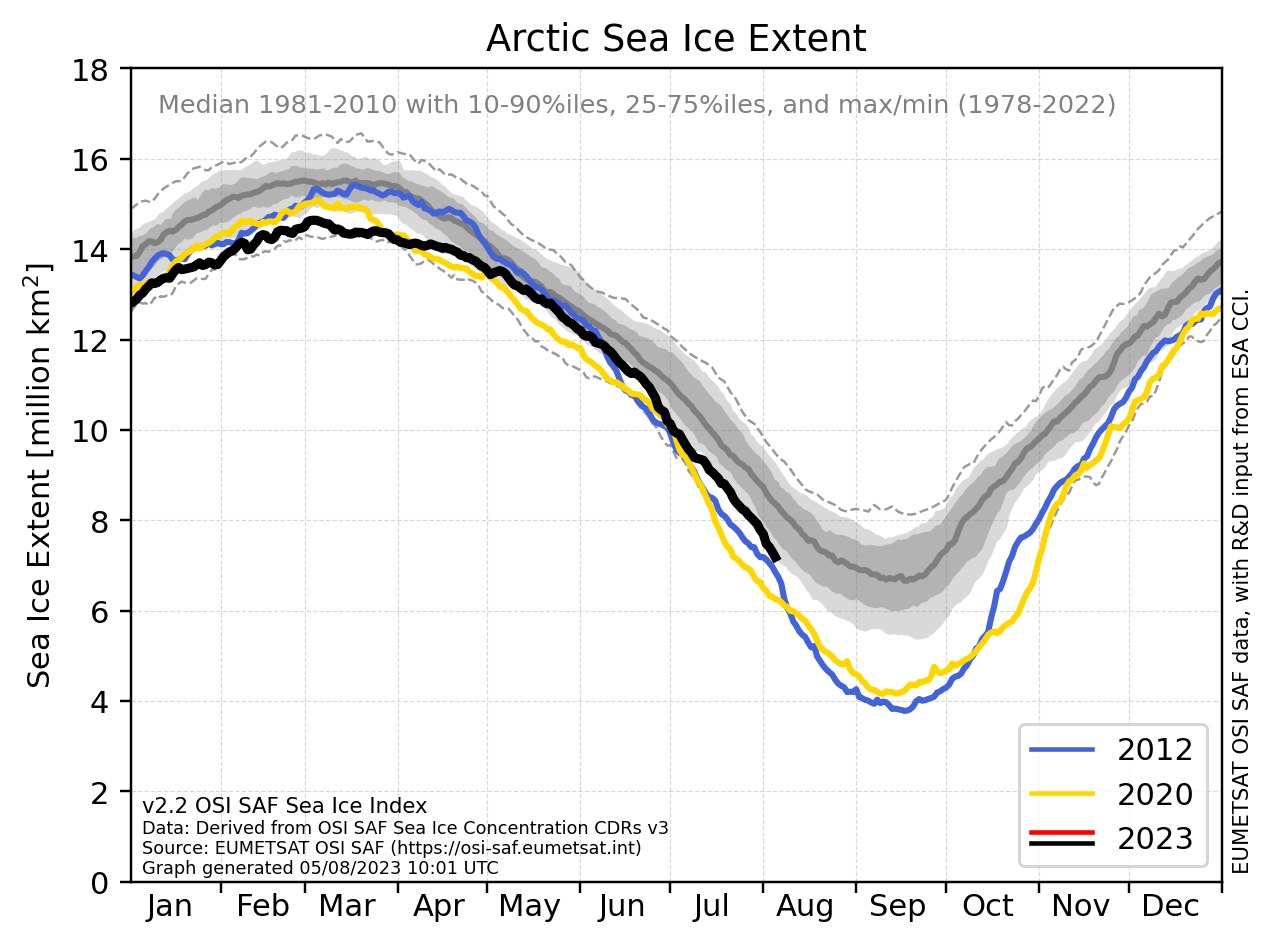
By way of just one example, if you can spot the difference between these two graphs of Arctic sea ice extent you may well wonder why a certain "Steve Goddard" has been continuously blasting the former data at his flock of faithful followers rather than the latter?
Events, dear Tony, events!
could the author kindly explain the role of the anti-cyclone known as Cerberus on the heat wave in southern Europe? Could you also explain how wild fires were started by climate change as spontaneous combustion of scrubland normally takes place at a much higher temperature, temperatures beyond that of the climate, so how can wildfires be attributed to the climate? Can you explain why the temperatures in Europe are now normal and have not been maintained and lastly why has the UK experienced the coldest July on record. Events like these need explanation If they are going to be attributed to global warming.
Davz @2 ,
You have many questions ~ but I would be grateful if you would clarify your second question.
Your second question does not seem to make sense. I assume that you are correct in that the ignition temperature of scrubland materials would be high (for instance, the wood-based material known as paper has an auto-ignition temperature above 200 degreesC ). And climate range does not extend anywhere near 200 degreesC, or even 100 degreesC.
And yet wildfires have occurred throughout pre-history, before humans & hominids, and even well before 1 million years BC. So your "question" presents a paradox ~ wildfires cannot occur naturally . . . and yet wildfires have occurred naturally.
Perhaps the paradox can be resolved by you expressing yourself more logically. Were you perhaps meaning to say that climate favoring hotter drier days would make wildfires worse in extent & intensity . . . which would make sense ~ but that makes nonsense of your second question.
re #2: As Eclectic points out, wildfires have occurred in the geologic record ever since land plants colonised the landmasses. Charcoal horizons in terrestrial sedimentary rocks provide the evidence. Dry lightning is a very obvious cause and is a key causal factor in many parts of the world today.
Vegetation does not spontaneously combust but can become well-primed by prolonged hot rain-free conditions to become an inferno should a fire start from any cause.
The UK has certainly had a below-average July but that's because it was stuck on the cold side of the jetstream for much of the month.
Looking back through reanalysis charts, 'Cerberus' was a flabby anticyclone but nevertheless it caused northwards warm air advection from northern Africa, just as UK heatwaves involve warm air advection from southern Europe as a rule, hence the meteorological term, 'Spanish Plume'. In a warming world, the chances of such events causing even hotter conditions are obviously increased.
also re - #2, I just checked and in the UK, July 2023 had a mean temperature across the month of 14.9C, 0.3C below the average for the period 1991-2020. Ironically, June was the warmest UK June on record with a mean temperature of 15.8C, this being 2.5C higher than average. Note the mich wider margin by which the heat record was broken; July was only a bit sub-par (no record there).
And according to Trevor Harley, July 1922 was the coldest on record with an average temperature of 13.7C.
Here's a telling chart: July 2023 would have been warmer than average against 1961-1990 climatology, but against 1991-2020 it was a bit cool: