


 Arguments


Introducing an Atmospheric Radiation Model to Learn About Global Warming
Posted on 17 January 2024 by Guest Author
Long-time commenter Charlie Brown was kind enough to write this introduction to an atmospheric radiation model based on a paper he published with David Archer and Valerie Young. Charlie Brown is a retired chemical engineer, experienced with energy balances, heat transfer, and process models, who has developed a keen interest in the science and the misinformation about the mechanism of global warming.
A model is an interesting and informative hands-on tool for learning and demonstrating how radiant energy causes global warming. Introduction to An Atmospheric Radiation Model, published in Chemical Engineering Progress (CEP), May 2022, provides a guide to an easy-to-use atmospheric radiation model. It can be used to gain insight into the detailed mechanism of CO2, water vapor, and methane for global warming as well as how the temperature profile of the atmosphere plays an essential role.
MILIA (MODTRAN Infrared Light in the Atmosphere) is an easy-to-use educational radiant energy model for the atmosphere hosted by the University of Chicago. Simply click on the link. No download is needed and the default run for MILIA appears automatically upon opening the webpage.
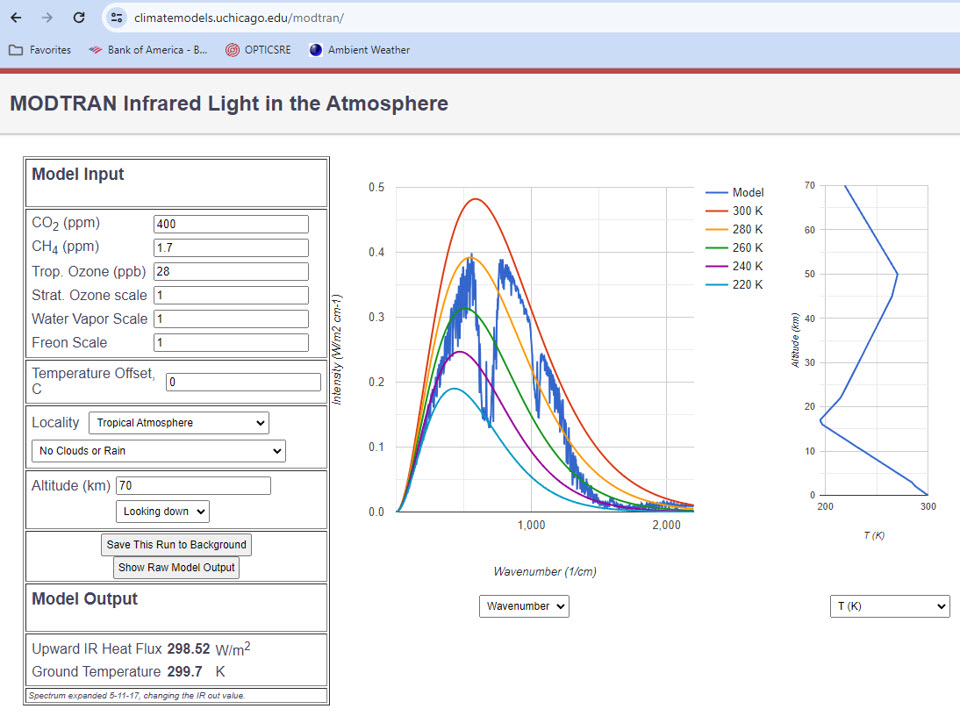
Figure 1. The MILIA model opens immediately to the default case.
The user can modify one of the inputs and results will appear. Default selections include wave number (number of waves per centimeter) and a tropical atmosphere. Wavelength in microns (µm) can be selected if preferred. Changing to the 1976 U.S. Standard Atmosphere provides an atmospheric temperature profile that is more typical of the global average.
It is tempting for a first-time user to jump right in and change CO2 concentration to see a corresponding change in ground temperature. That does not happen. The ground temperature will be based on this selection for Locality. It can be adjusted by the user as a “Temperature Offset.” Instructions for using this adjustment are provided in the article. As with any model, proper use and interpretation requires familiarity and knowledge. In addition to the guidance provided in this article, MILIA has pages for “Overview” and “How To.” It must be emphasized that MILIA is a radiant energy model that calculates radiant energy flux based on the specified atmospheric temperature and pressure profiles and the composition. It is not an energy balance model that calculates changes in equilibrium temperature for a change in conditions. The ground temperature is used to calculate the radiant energy emitted from the ground. An automatic adjustment of the temperature in the lower atmosphere follows an input to offset ground temperature. It is not rigorous, but it does provide a good approximation.
Model Versions
Several thermal radiation models have been developed for different purposes.MODTRAN (MODerate resolution atmospheric TRANsmission) was developed and is maintained by the U.S. Air Force in collaboration with Spectral Sciences, Inc. The current commercial version is MODTRAN 6 (Sept. 2016). It is a “narrow band model” that groups individual absorption lines into narrow bins for computational efficiency. It offers a line-by-line algorithm for high resolution studies and other advanced features.
The current version of MILIA is based on MODTRAN 3, Version 1.3. It is an excellent educational tool for non-professional use.
Basic Physics
The CEP article was written for a peer group of chemical engineers. Chemical engineers are skilled in energy balances and heat transfer. Most people understand conservation of energy and probably are more familiar with radiant energy than they realize. Consider night vision goggles, infrared cameras, and infrared thermometers. Fundamental principles of radiant energy transfer are listed in Table 1.
Table 1. Principles of radiant energy transfer in gases.
|
Stefan-Boltzmann Law |
Energy intensity proportional to 4th power of absolute temperature |
|
Planck Distribution |
Energy intensity of blackbody emission as function of emission temperature and wavelength |
|
Kirchoff’s Law |
Absorptance = Emittance at thermal equilibrium |
|
Beer- Lambert Law |
Attenuation of emitted energy as function of path length |
To understand global warming, it is helpful to focus on the overall global energy balance and the infrared (IR) radiant energy exiting the top of the atmosphere. Trying to mentally track the energy leaving the surface and working its way upward through the atmosphere is unnecessarily confusing, although downward IR emitted by GHGs is an essential concept for reduced energy escaping to space at certain wavelengths. Let the model do the calculations and use an understanding of the concepts to interpret the results.
Figure 2 is provided to help visualize the global energy system. The system boundaries for an overall energy balance are the lower boundary of the Earth’s surface and an upper boundary at the top of the atmosphere.
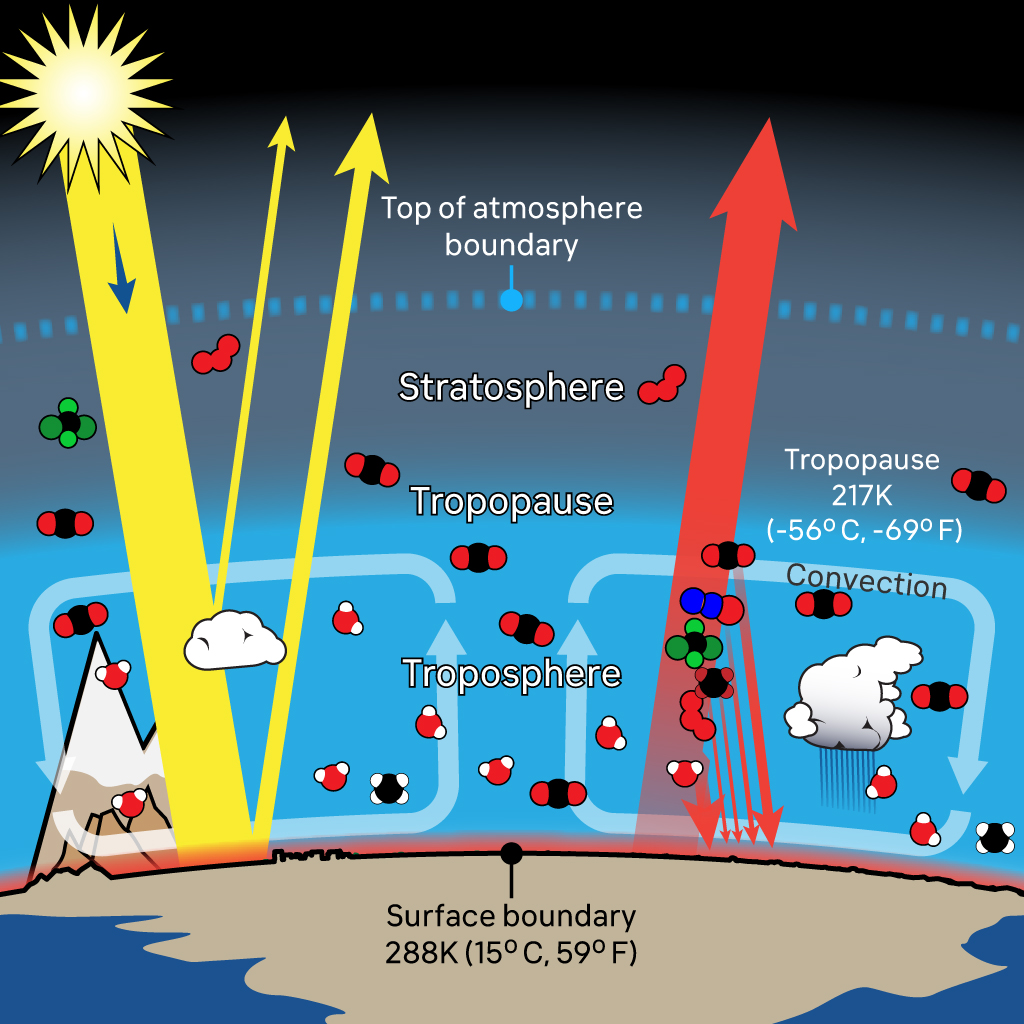
Figure 2. The overall energy balance boundaries for the global system are the surface and the top of the atmosphere. Energy flow including convection, evaporation and condensation, and downward IR radiation occur within the global system and do not cross system boundaries. Composition is represented by atoms: carbon (black), oxygen (red), hydrogen (white), nitrogen (blue), chlorine (dark green) and fluorine (light green).
Absorption Lines
All molecules above absolute zero emit electromagnetic energy as electrons change activity levels due to vibration and internal energy, which is manifested as temperature. A blackbody isan idealized surface that absorbs all incident electromagnetic radiation and radiates the full spectrum according to the Planck distribution. Because gas molecules are simpler, they radiate only at specific wavelengths and radiance approaches the Planck distribution only at wavelengths where the absorptance for a gas layer equals 1.0.
Absorption coefficients for many gases are compiled in the HITRAN (HIgh resolution TRANsmission) database. Bytran.org provides an open-source program for spectral calculations using the HITRAN database. Absorption lines for CO2 are provided in Figure 3 for a 1,000-meter path length at conditions in the tropopause that are particularly important for emitted energy loss to space. CO2 has a strong absorption band between 14 µm and 16 µm with a very prominent peak centered at 14.9 µm and “wings” or “shoulders” of lesser absorptance on each side of the peak.
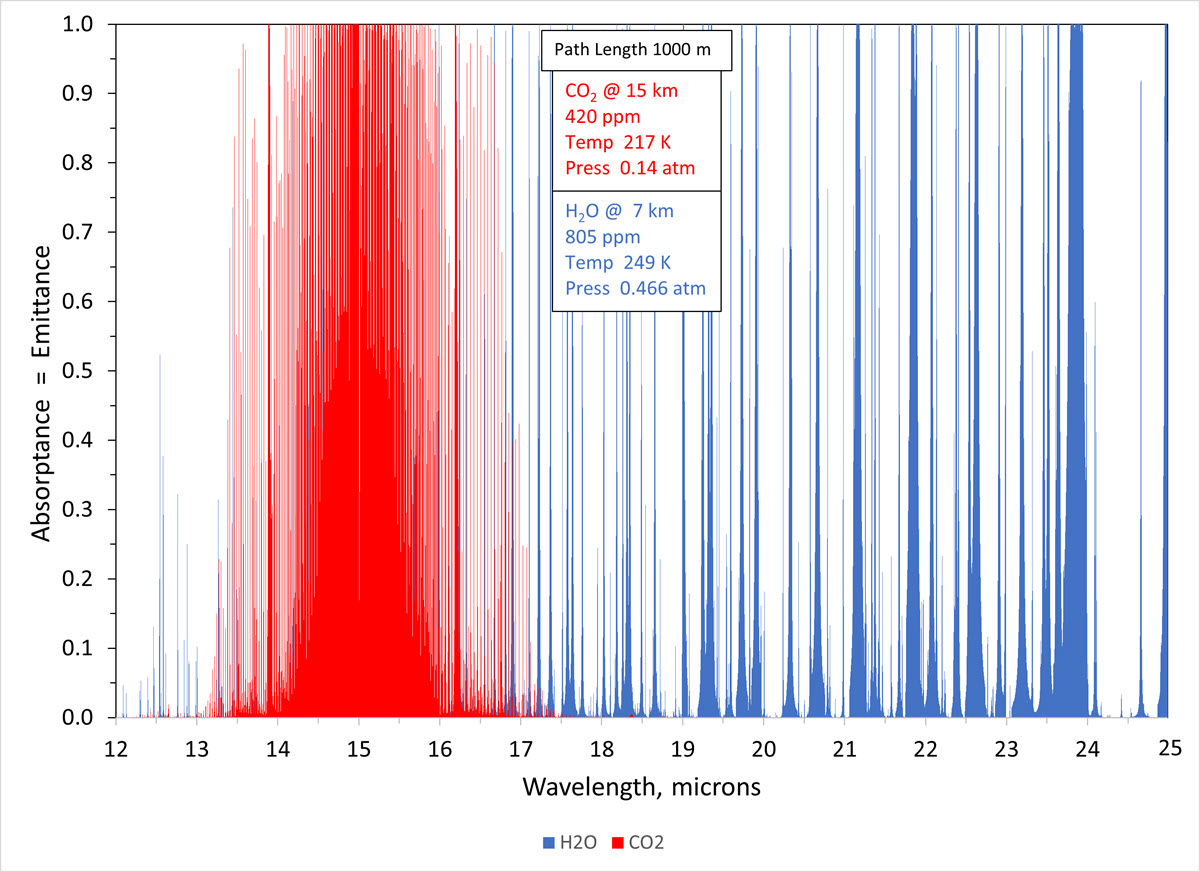
Figure 3. Absorption lines for CO2 (red) and H2O (blue) at the specified conditions. These lines illustrate the importance of the tropopause (15 km, 217 K, 0.14 atm) for CO2 and the troposphere (7 km, 249 K, 0.0466 atm) for H2O for the calculation of radiant energy emitted to space. The MILIA model uses narrow bands based on absorption lines for conditions at multiple layers of the atmosphere.
Learn by doing
MILIA is easy to use and is a convenient tool for enhancing one’s understanding of the mechanisms of global warming. Learning is most effective when practiced hands-on. Suggested exercises are provided in the CEP article and on the MILIA page for “Things To Do.” Caution: when using any model one should always understand the fundamental principles behind the model and be aware of its purpose and limitations.
Getting started
Click on the link to MILIA. If preferred, change to wavelength and to the 1976 U.S. Standard Atmosphere for locality. Temperature, pressure, and concentration profiles can be selected from the dropdown box on the right. Planck distribution curves for black body radiation at different temperatures are illustrated as smooth colored curves. The modeled spectrum in blue is the energy intensity as a function of wavelength. Integrating the area under the spectrum for all wavelengths gives the heat flux as watts per square meter. To compare two runs, click “Save This Run to Background,” then change conditions to see the results of both runs.
Increasing GHG
Change CO2 for several concentrations. Notice that the 14-16 µm band widens as concentration increases. This is caused by strengthening the weak absorption lines on the edges of the band that are illustrated in Figure 2. Plot the results for “Upward IR Heat Flux.” Note the logarithmic effect of increasing CO2.Doubling from 100 to 200 ppm has the same effect as doubling from 200 to 400 ppm and from 400 to 800 ppm. For as many points as desired, adjust the “Temperature Offset” to match the original Upward IR Heat Flux value of 267.842 W/m2 at 400 ppm. As shown in the CEP article, the shape of the curve for equilibrium temperature offset will be the same as that for heat flux, but inverted.
Repeat the exercise for methane to investigate the power of methane as a GHG. The global warming potential for methane is discussed in the CEP article.
Water vapor feedback
When a temperature offset is entered, an option appears for holding fixed either “Water Vapor Pressure” (actually the partial pressure of water vapor) or the “Relative Humidity.” Holding the partial pressure of water vapor constant means that the water vapor concentration does not change with a change in temperature. Save this run to background, then change to holding fixed “Relative humidity.” When relative humidity is held constant, water vapor concentration increases with an increase in the temperature offset. Compare the two options to observe the water vapor feedback effect that results from warming caused by increasing CO2.
Effect of Altitude
Change the altitude, looking down, from 0 to 70 km to observe the combined effects of temperature, pressure, and concentration throughout the atmosphere. Notice how the bottom of the CO2 band follows the Planck distribution temperature until the altitude reaches the stratosphere. There are sufficient CO2 molecules in the path length of the cold troposphere to fill much of the band to an absorptance/emittance value of 1.0. Further into the stratosphere, the bottom of the band stops following the corresponding Planck distribution temperature for the specified altitude. This indicates that there are not enough CO2 molecules in the stratosphere to create an emitting layer that reaches the Planck distribution temperature. Notice the interesting peak at 14.9 µm. The strong absorption lines at 14.9 µm have a greater effect because, by Beer’s Law, it takes fewer molecules to absorb and emit at those very strong lines.
IR is emitted by gases in all directions, half upward and half downward. Change the view to “Looking up” to observe radiant energy that is emitted downward.
Conclusion
MILIA is a valuable educational tool for understanding radiant energy transfer in the atmosphere. Use it to explore the effect of increasing GHG concentrations, water vapor feedback, the power of methane, the effect of altitude and the stratosphere. It is a good way to understand the essential key role of the cold tropopause in the mechanism of global warming. If you have more questions about the mechanism of radiant energy, see if you can figure out how to change the inputs to answer your question. You can add your questions and solutions as comments to the blog post.
Further Reading
Archer, D.,“Global Warming: Understanding the Forecast,” 2nd ed., John Wiley & Sons, Inc., Hoboken, NJ (2012).
Spectral Sciences, Inc., “Frequently Asked Questions,”http://modtran.spectral.com/modtran_faq.
Zhong, W. and J. D. Haigh, “The greenhouse effect and carbon dioxide,” Weather, Royal Meteorological Society, April 2013.


As there have not yet been any comments on this post, I'd just like to add a tip of the hat to Charlie for contributing this. MODTRAN has been referred to many times in the comments here at SkS, and this post presents a very useful introduction.
I would encourage readers to follow Charlie's suggestion to experiment with the model.
Good to see this post - MODTRAN is the basis of a great deal of solid research.
Thanks. I would like to re-emphasize, as mentioned in the section "Model Versions", that the commercial version of MODTRAN was developed by collaboration with the U.S. Air Force and Spectral Sciences, Inc. MODTRAN is a registered trademark of the United States of America, as represented by the United States Air Force. Now in version 6, the commercial version is not free. It provides much more flexibility for research purposes than the educational version hosted by the University of Chicago. For this reason, I like to use the acronym MILIA (MODTRAN Infrared Light in the Atmosphere) to differentiate the two versions.