Climate Science Glossary

Term Lookup

Enter a term in the search box to find its definition.

Settings

Use the controls in the far right panel to increase or decrease the number of terms automatically displayed (or to completely turn that feature off).

Term Lookup

Settings


All IPCC definitions taken from Climate Change 2007: The Physical Science Basis. Working Group I Contribution to the Fourth Assessment Report of the Intergovernmental Panel on Climate Change, Annex I, Glossary, pp. 941-954. Cambridge University Press.

Home Arguments Software Resources Comments The Consensus Project Translations About Support

Twitter Facebook YouTube Mastodon MeWe

RSS Posts RSS Comments Email Subscribe


Climate's changed before
It's the sun
It's not bad
There is no consensus
It's cooling
Models are unreliable
Temp record is unreliable
Animals and plants can adapt
It hasn't warmed since 1998
Antarctica is gaining ice
View All Arguments...


Username
Password
New? Register here
Forgot your password?

Latest Posts

Archives

Did global warming stop in 1998?

1998 was an unusually hot year as it featured the strongest El Nino of the century. In fact, from Jan to May, 2007 is tied with 1998 as hottest year on record. The WMO reported in August that January and April 2007 were the hottest on record.

However, when determining trends, you don't pick one month or year out of isolation - particularly if that year features a short term weather anomaly like El Nino. By this method, based on the fact that 2005 was .17°C hotter than 2000, you could conclude that the rate of global warming doubled from 2000 to 2005.

5 year moving average

When considering long term climate trends, you need to filter out short term weather anomalies like El Nino or volcanic eruptions - an easy way is to plot a 5 year average. This shows the trend hasn't reversed at all.
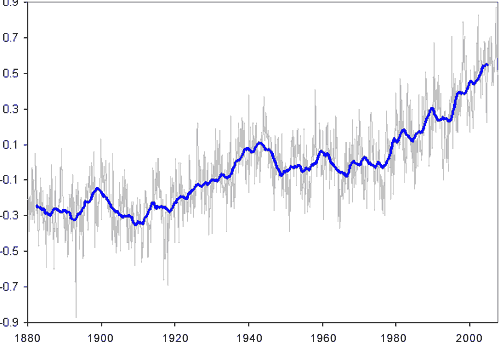

Monthly global temperature anomaly (grey line) with a 5 year moving average (blue line) from 1880 to 2007

Line of best fit

While a 5 year average is visually compelling, a more rigorous statistical method to determine any trend is to apply a line of best fit to the data.
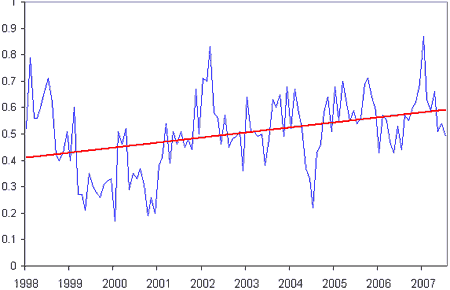

Monthly global temperature anomaly (blue) with line of best fit (red) from 1998 to 2007

In this case, a line of best fit calculates the temperature trend is 0.16°C per decade from 1998 until July 2007. This is a close match to the temperature trend over the last 30 years (0.15°C from 1975 to 2007). So even starting from 1998, we find the planet is still warming at the same rate.


The Consensus Project Website

THE ESCALATOR

(free to republish)


© Copyright 2024 John Cook
Home | Translations | About Us | Privacy | Contact Us