


 Arguments
Software
Resources
Comments
The Consensus Project
Translations
About
Support
Arguments
Software
Resources
Comments
The Consensus Project
Translations
About
Support
![]()
![]()
![]()
![]()
![]()
![]()
![]()
![]()
![]()
![]()


![]()


Latest Posts
- 2024 SkS Weekly Climate Change & Global Warming News Roundup #17
- Fact Brief - Is Antarctica gaining land ice?
- Simon Clark: The climate lies you'll hear this year
- Skeptical Science New Research for Week #17 2024
- Water is at the heart of farmers’ struggle to survive in Benin
- At a glance - The difference between weather and climate
- India makes a big bet on electric buses
- 2024 SkS Weekly Climate Change & Global Warming News Roundup #16
- EGU2024 - An intense week of joining sessions virtually
- Skeptical Science New Research for Week #16 2024
- How extreme was the Earth's temperature in 2023
- At a glance - Is the science settled?
- What is Mexico doing about climate change?
- 2024 SkS Weekly Climate Change & Global Warming News Roundup #15
- Fact Brief - Did global warming stop in 1998?
- Skeptical Science New Research for Week #15 2024
- EGU2024 - Picking and chosing sessions to attend virtually
- At a glance - The Pacific Decadal Oscillation (PDO) is not causing global warming
- Climate Adam: Is Global Warming Speeding Up?
- 2024 SkS Weekly Climate Change & Global Warming News Roundup #14
- Gigafact and Skeptical Science collaborate to create fact briefs
- Skeptical Science New Research for Week #14 2024
- How can I make my retirement plan climate-friendly?
- At a glance - Global warming and the El Niño Southern Oscillation
- A data scientist’s case for ‘cautious optimism’ about climate change
- 2024 SkS Weekly Climate Change & Global Warming News Roundup #13
- Skeptical Science New Research for Week #13 2024
- You can start applying for the American Climate Corps next month
- At a glance - Human fingerprints on climate change rule out natural cycles
- Want clean electricity? These are the overlooked elected officials who get to decide.
Comment Search Results
Search for Roy Spencer
Comments matching the search Roy Spencer:
- UAH atmospheric temperatures prove climate models and/or surface temperature data sets are wrong
retiredguy at 06:44 AM on 13 February, 2024Any thoughts / comments on the below article by Roy Spencer ?
https://www.heritage.org/environment/report/global-warming-observations-vs-climate-models
- At a glance - Evidence for global warming
One Planet Only Forever at 07:28 AM on 4 December, 2023Paul Pukite,
I like John Mason’s question @26. But would extend it as follows: “...why did you choose to interject on this thread...” the way that you did @2?
Though you have not directly addressed the questions I raised @4 regarding your comment @2, your latest comments appear to indicate an awareness that it was incorrect to state that there was no similar warming in “the middle of the equatorial Pacific” [quote from you @2] (I agreed that it is worthy of being thrown away). But I still do not see indications of awareness that it was also wrong to try to justify that incorrect assertion by misrepresenting the paper you linked @2 with a ‘quote-clearly-out-of-context’.
Making incorrect statements with questionable or made-up justifications and then arguing against attempts at clarification and correction of the incorrect belief is similar to the behaviour of the regular denizens of sites like WUWT and Dr. Roy Spencer.
I wish you luck in your endeavours to ‘constantly learn more about ENSO – constantly changing your mind as you learn more’.
- At a glance - Evidence for global warming
One Planet Only Forever at 03:40 AM on 1 December, 2023Paul Pukite @7,
One has to try very hard to evade evidence and understanding that contradicts a preferred unjustified belief. You appear to have chosen to not address the evidence and understanding presented in my comment @4 that shows that your initial claim @2 is non-sense.
As mentioned by Eclectic @6 sites like WUWT are a swirl of laughable efforts to evade learning about things that contradict 'preferred beliefs'. Do an internet search of "belief vs understanding". There is an important difference. The pursuit of learning to better understand things requires being open to revision of beliefs.
Pursuing a resistance to learning can be popular. Sites like WUWT and Dr. Roy Spencer's are proof of that.
Thanks for giving us all a laugh here without having to venture into the Non-Sense-Land of WUWT and Dr. Spencer's. Admittedly they would be funnier if the type of people they attract did not have any significant influence on leadership actions. But, tragically, popular non-sense can significantly compromise the actions of leaders who are reliant on getting some support from people who are tempted to believe non-sense.
- John F. Clauser: the latest climate science-denying physicist
AB19 at 21:32 PM on 29 November, 2023I quote from the article introduction:
"It’s a familiar story – the physicist who draws attention for declaring that climate scientists have got climate science all wrong. He (it’s always a ‘he’) was born before color television was invented, usually retired, perhaps having won a Nobel Prize, but with zero climate science research or expertise. William Happer."
I don't know if the writer of the article is a scientist or not but it starts with some rather unscientific viewpoints, namely by suggesting that male, retired physicists are not qualified to comment on climate matters. What does it matter what sex they are or how old they are? In relation to physicists, I don't know about the others in the list given, but William Happer would, I would have thought, certainly qualify to comment on the global warming debate given that if you have watched any of his presentations on this topic, you'll know that his field of research was the absorption of infra-red radiation by CO2 molecular stretches and bends - very apt in the climate debate I would have thought, given that it is precisely CO2 that is being posited as the culprit in current global warming trends. He also openly admits that he was once a climate alarmist until his work led him to believe he was wrong.
I am not a climate scientist- my background is chemistry- but there are certain apparent facts that appear to be ignored in the current debate, namely that we know the earth warmed before about 1000 years ago in the medieval warming period and again about 2000 years ago in the Roman period. These warmings cannot have been due to human activity given that there were no combustion engines or factories around and world population was vastly lower than today. I believe it's also true that in the last ice age the level of atmospheric CO2 was at least 10 times current levels - which according to IPCC thinking ought to have produced a blisteringly hot climate - yet there was an ice age. Whilst not denying that CO2 is x greenhouse gas, these facts do tend to cast doubt on just how potent a greenhouse gas CO2 really is. I believe Dr Roy Spencer, who is a meteorologist not a physicist and also not retired ( though he is male) has similar views to the listed physicists. - Climate Science Denial Explained
Eclectic at 23:02 PM on 20 March, 2023MA Rodger @21 ,
Yes, as I was addressing Foster @11 and @17 , it seemed reasonable to throw in mention of those two scientists who are "icons" of the science-denier crowd at WUWT .
As you know full well, Richard Lindzen and Roy Spencer are almost the only climate scientists having enough genuine track record in the field, as to qualify for worshipful attitude from the denialists. (In their desperation to find a respectable scientist who is "on our side" . . . the denialists are reduced to a choice of slim-to-none , compared with the many hundreds of mainstream climate scientists ~ or many thousands, depending on how defined.)
Dr Spencer's tendency is ( I gather secondhand from a Potholer54 video ) to take a religious fundamentalist viewpoint ~ to the effect that "all will be well with the Earth, thanks to divine protection". And Potholer54 relates how - over many years - Spencer has had to repeatedly backpedal from his climate assertions, as the contrary evidence keeps proving him wrong. Even so, at times Spencer gets a bit of flak from denizens at WUWT , because he is not quite politically-correct enough to deny Greenhouse Effect etc.
Both Lindzen and Spencer demonstrate how some well-informed & intelligent men can get it so very wrong, owing to a pigheaded "motivated reasoning" directed by the emotional part of their brain.
- Models are unreliable
Bob Loblaw at 12:33 PM on 6 December, 2022That is one weird analysis presented by Spencer. I read the blog post OPOF pointed to, and the one linked in it that points to an earlier similar analysis.
I really cannot figure out what he has done. Figure 1 refers to "2-Station Temp Diff.", but there is no indication of how many stations are included in the dataset, or exactly how he paired them up. Is each station only paired to one other station, or is there a point generated for each "station 2" that is within a certain distance? He talks about a 21x21km area centered on each station - but he also mentioned a 150km distance limit in pairing stations. Not at all clear.
There are also some really wonky statements. He talks about "operational hourly (or 3-hourly) observations made to support aviation at airports" and claims "...better instrumentation and maintenance for aviation safety support." He clearly has no understanding of the history of weather observations in Canada. Aviation weather historically was collected by Transport Canada (a federal government department), and indeed the Meteorological Service of Canada (as it is now known) was part of that department before the creation of Environment Canada in the early 1970s. Even though MSC was in a different department, it still looked after the installation, calibration, and maintenance of the "Transport Canada" aviation weather instrumentation. This even continued (under contract) for a good number of years after the air services were moved out into the newly-created private corporation Nav Canada in 1996. The standards and instrumentation at aviation weather stations was no different from any other station operated by MSC. Now, Nav Canada buys and maintains its own instruments, and MSC has ended up going back to many of these locations to install their own instrumentation because the Nav Canada "aviation" requirements do not include long-term climate monitoring. (Nav Canada data still funnels into the MSC systems, though.)
What has changed over time is levels of automation. Originally, human observers recorded data and sent it into central collection points. Now, nearly all observations are made by fully-automated systems. A variety of automatic station types have existed over the decades, and there have been changes in instrumentation.
As for the 3-hour observing frequency? Not an aviation requirement - but rather the standard synoptic reporting interval used by the World Meteorological Organization.
So, reading Spencer's analysis raises large numbers of questions:
- What stations?
- How many?
- Which ones are paired together?
Without this information, it is very difficult to check the validity of the comparisons he is making. Figure 1 has a lot of points - but later in the post he mentions only having four stations in "SE Alberta" (Edmonton, Red Deer, Calgary, and Cold Lake). Does figure 1 included many "within 150km" stations paired to each individual station in the list? Does this mean that within an area containing say 5 stations, that there are 4x3x2 "pairs"? That would be one way of getting a lot of points - but they would not be independent. We are left guessing.
Spencer links to this data source for weather data. I managed to search for stations in "Alberta", and found 177 active on January 1, 2021. It contains six stations with "Edmonton" in the name. Which one is Spencer's "Edmonton" is important. It is almost certainly the International airport south of the city (often jokingly called "Leduc International Airport because of its distance from the city proper), but the downtown Municipal airport is also on the NOAA/NCEI list. The difference in urbanization is huge - the Leduc one has some industrial areas to the east, but as you can see on this Google Earth image, it is largely surrounded by rural land. The downtown airport would be a much better "urban" location. The Leduc location only has "urbanization" to the east - downwind of the predominant west-east wind and weather system movements.
My number of 177 Alberta stations is an overestimate, as the NOAA/NCEI web page treats "Alberta" as a rectangular block that catches part of SE British Columbia. I also only grabbed recently-active stations - the number available over time changes quite a bit. The lack of clarity from Spencer about station selection is disturbing.
As MAR has pointed out, Spencer's four "SE Alberta" stations of Edmonton, Red Deer, Calgary, and Cold Lake make for an odd mix. The first three are all in a 300km N-S line in the middle of the province. Edmonton is 250km from the mountains; Red Deer about 125km, and Calgary about 65km. (For a while, I had an office window in Calgary where I could look out at the snow-capped mountains.) Cold Lake is about 250km NE of Edmonton, near the Saskatchewan border. The differences in climate are strong. Spencer dismisses these factors as unimportant.
Spencer's Table 1 (cities across Canada) suffers from the same problems: not clearly identifying exactly which station he is examining. At least here he says "Edmonton Intl. Arpt".
He does not clearly explain his method of urban de-trending. I followed his link to the earlier blog post that gives more information, but it is not all that helpful. As far as I can tell, he's used figure 4 in that blog post to determine a "temperature difference vs urbanization difference" relationship and then used that linear slope to "correct" trends at individual stations based on the Urbanization coefficients he obtained from a European Landsat analysis for the three times he used in his analysis (1990, 2000, and 2014). Figure 4 is a shotgun blast, and he provides no justification for assuming that an urbanization change from 0 to 10% has the same effect as a change from 80-90%. (Such an assumption appears to be implicit in his methodology.) In fact, many studies in urban heat island effect have show log-linear relationships for UHI vs population of other indicators (e.g., Oke, 1973). Spencer's figure 4 in that second blog post is also for "United States east of 95W". No justification as to why that analysis (with all its weaknesses) would be applicable in a very different climate zone such as the Canadian prairies (Alberta).
His list of 10 Canadian cities also has some wildly different climate zones in it.
- Saskatoon? Regina? Both cities of about 200,000 people. Both cities where the airport is to the west of the built-up area. Both areas where most of the weather systems move west to east, so "upwind" is rural.
- Grande Prairie? Population about 63,000. What a booming metropolis!
- Abbotsford? In the Fraser Valley east of Vancouver. Air masses funnel between the mountains into the valley. No local effects to see here! (NOT!)
- St. John's NL Airport? A coastal city. Airport is located on a rocky peninsula about 15-20km wide (E-W), with huge variations in microclimate. Great place to assume nothing else affects "urban heat island". Easy to see on Google Earth. (HTML really badly needs a "sarcasm" tag.)
Spencer should be embarrassed by this sort of analysis, but I doubt he cares. He has the "result" he wants.
- Models are unreliable
MA Rodger at 05:23 AM on 6 December, 2022One Planet Only Forever @1325,
Spencer is not the first to waste his time searching for that mythical archepelago known as The Urban Heat Islands. Of course these explorers are not trying to show such islands exist (they do) but to show the rate of AGW is being exaggerated because of these islands. That's where their myth-making kicks off.
This particular blog of Spencer's is a bit odd on a number of counts. He tells us he is correlating 'temperature' against 'level of urbanisation' using temperature data of his own derivation and paired urban/rural sites, this all restricted to summer months. Yet this data shown in his Fig 1 seems to show temperatures mainly for a set of pretty-much fixed levels of ΔUrbanisation (no more than 5% ΔUrbanisation over a 10-mile square area), so not for any significant changing levels of urbanisation. The data showing these urban records warming faster under AGW that nearby rural stations and thus the actual variation in warming between his paired rural/urban stations is not being presented.
And note his "sanity check" appears to confirm that "homogenization" provides entirely expected results so why is he using his own temperature derivations?
And I'm also not sure his analysis isn't hiding some embarassing findings. Thus according to the GISTEMP station data, the urban Calgary Int Airport & rural Red Deer have a lot less summer warming than the urban Edmonton Int Airport & rural Cold Lake. The data doesn't cover the full period, but it is rural Cold Lake that shows the most warming of the four.
- Models are unreliable
One Planet Only Forever at 14:26 PM on 5 December, 2022This is new information related to the video by Spencer mentioned by EddieEvans @1312 and comments about it since then.
Roy Spencer has a November 19th 2022 blog posting titled "Canadian Summer Urban Heat Island Effects: Some Results in Alberta".
In the conclusion Spencer says:
"The issue is important because rational energy policy should be based upon reality, not perception. To the extent that global warming estimates are exaggerated, so will be energy policy decisions. As it is, there is evidence (e.g. here) that the climate models used to guide policy produce more warming than observed, especially in the summer when excess heat is of concern. If that observed warming is even less than being reported, then the climate models become increasingly irrelevant to energy policy decisions."
That is very similar to the wording by Spencer included in the comment by MA Rodger @1316. It appears to be Spencer's "New Trick" - seeking any bits of data evaluation to make-up a claim about model inaccuracy that is then claimed to mean that "Energy Policy" should be less aggressively ending fossil fuel use.
And the introduction of this blog post by Spencer makes it pretty clear he has made this line of investigation, evaluation and claim-making regarding "Energy Policy" his new focus.
- Models are unreliable
One Planet Only Forever at 05:59 AM on 29 November, 2022EddieEvans is justified to question Roy Spencer's work. And I agree with MA Rogers that Spencer's claim that 'what he claims to have discovered about climate models should alter (govern) US Energy Planning Policy development and action' is bizarre.
I do not believe it is necessary to get into the details of what Spencer did. The real question is: How is the 'summer trend in average surface warming of the contiguous USA' relevant to US Energy Planning? The likely answer is "It Isn't relevant".
The rate and total ultimate magnitude of human global warming impacts is the concern. And US Energy Planning needs to be aligned with the USA responsibly leading the rapid ending of harmful impacts (because the USA undeniably led the creation of the problem and is still a per capita leader of the increase of the problem).
Also, it is unlikely that the sea level rise impacts on the USA, or many of the other climate change impacts on the USA, are altered by what the models indicate as the 'trend of Summer surface average temperature in the contiguous USA from 1973 to 2022' vs NOAA data. And "What about the Fall or Winter or Spring values?"
This apperas to just be Spencer 'doing his thing' - creative development of attempts to be misleading about climate science to delay the development of the understanding of, and delay the development of popular support for, the need to rapidly end the harm done by fossil fuel use and other harmful human pursuits of benefit.
Actually, this recent bit about how the models appear to overstate the rate of warming of the 'Summer values' of the contiguous USA is rather weak compared to many of Spencer's 'more subtle distortions and misleading claim-making'.
- Models are unreliable
MA Rodger at 20:38 PM on 27 November, 2022EddieEvans @1314,
The 3-minute video clip linked @1312 in turn referrs to this blogpost by Spencer. The agrument put forward by Spencer is that the summer trend in AGW over the contiguous USA 1973-2022 as measured by NOAA is +0.26ºC/decade, a value he confirms with his own analysis of temperature records (although Spencer also suggests this result may be impacted by the presence of that fantastical archipelago 'The Urban Heat Islands' even though his analysis fails to note their location within the contiguous USA).
Spencer then compares this US summer trend with that of 36 modelled trends** and finds a bit of a mismatch. The models are all showing far more warming for this particular measure according to Spencer. If correct (and that is a big 'if' because Spencer is involved), these modelled trends are sitting in the range +0.28ºC/decade to +0.72ºC/decade and averaging perhaps +0.45ºC/decade.
And so Spencer concludes:-
Given that U.S. energy policy depends upon the predictions from these models, their tendency to produce too much warming (and likely also warming-associated climate change) should be factored into energy policy planning. I doubt that it is, given the climate change exaggerations routinely promoted by environment groups, anti-oil advocates, the media, politicians, and most government agencies.
This all seems a bit of a leap into the realms of purile nonsense rather than the sort of stuff a grown-up climatologist should be doing. I note in Spencer's comment thread somebody says they "checked NOAAs summer temperature for Europe 1975-2022 and got 0.53 deg.C/decade." So if there is "far more warming" showing in these models, for Europe that modelled warming must show a steep trend indeed.
** Spencer doesn't explain his analysis of these models but points to this web engine which might have done it for him, or confused him enough to make his blunderful grand finding. A quick go on the web engine for Tas & SSP2-4.5 (as per Spencer) yields a summer global land model average of +0.33ºC/decade which is pretty close to the NOAA NH summer land average trend (1973-2020) of +0.31ºC/decade. - Models are unreliable
EddieEvans at 21:06 PM on 26 November, 2022I'm interested in comments about this Youtube channel's climate deception and denial, especially this video and Roy Spencer's comment about models being wrong. 1:34
- UAH atmospheric temperatures prove climate models and/or surface temperature data sets are wrong
Eclectic at 04:25 AM on 14 June, 2022Knaugle , this very issue is addressed by the science journalist "Potholer54" in his latest Youtube climate video. Video dated 19 March 2022, and titled "A close look at Roy Spencer's claims on global warming". (Duration 20 minutes ~ and is number 59 in his climate series.)
The video lacks the usual humorous touch by Potholer54 . . . possibly because it leans more towards discussing Spencer's intransigence - the failure to acknowledge the validity of the mainstream climate science (owing to Spencer's religious fundamentalist belief that the Earth's climate is ultimately under divine control).
- UAH atmospheric temperatures prove climate models and/or surface temperature data sets are wrong
MA Rodger at 04:41 AM on 8 June, 2022knaugle @2,
I would not myself say that UAH TLTv5.6 "showed reasonably close agreement" with anything other than HadCRUT4 which itself showed less warming than other SAT records like GISTEMP.
And while RSS TLTv3.3 showed lower warming than all others back in the day, RSS TLTv4.0 is now showing more warming than UAHv5.6 did.
A comparison between HadCRUT4, UAH TLTv5.6 & v6.0 and RSS TLTv4.0 is plotted in this WoodForTrees presentation. Note how UAH v6.0 diverges over a short period 2000-12 which is symptomatic of a satellite calibration issue, something the UAH folk themselves accuse other satellite records of ignoring.
- Models are unreliable
Eclectic at 20:06 PM on 20 March, 2022Bob Loblaw @1302 - thank you. It is a while since I looked at the background info on Dr Roy Spencer. The SkS info on him is from 2012, and the Desmog info goes up to 2017. ( I do see Spencer's UAH monthly chart always gets featured on the WUWT blogsite, and draws many comments of a vacuous sort. Other global temperature charts get little mention there . . . and oceanic warming is almost tabu. )
Spencer has to keep backstepping from his original position of total AGW denial (including the "minimal warming" assertion). And he has stepped even further back since 2017, and is now admitting (quietly) that it is possible the majority of modern warming comes from manmade GH gasses.
No such admission from that other celebrated contrarian climatologist Dr Judith Curry. On her blog [ClimateEtc] her latest article, posted 17 March, titled: "A 'Plan B' for addressing climate change" . . . is classic Curry vagueness. The reader risks almost drowning in discursive verbiage ~ which in essence kind of boils down to: We should be doing nothing to counteract Global Warming because it is all too difficult (and too mild) and should probably be given a priority way, way below all the other problems that we face in this world. (And of course we cannot tackle more than one problem at a time.)
- Models are unreliable
Bob Loblaw at 04:50 AM on 20 March, 2022Although it does not have a place for comments or responses, readers of this discussion who are curious about Roy Spencer's work may also wish to read the information on this page:
https://skepticalscience.com/skeptic_Roy_Spencer.htm
As usual, Desmog also tracks him:
- Models are unreliable
Eclectic at 22:55 PM on 19 March, 2022Out today ~ date 19 March 2022 ~ a new YouTube video
by science journalist PotHoler54
Describing multiple errors with Dr Roy Spencer's [Christy and Spencer] UAH satellite system's tropospheric temperature measurements, errors made over several decades.
In short : Spencer's predictions wrong, and model predictions right.
Not exactly news ~ except I myself had not realised how greatly Spencer's fundamentalist religious beliefs had given a severe bias to his thinking.
(Moderator ~ I'm not sure if there is a better thread for this post.)
- 2021 SkS Weekly Climate Change & Global Warming News Roundup #31
One Planet Only Forever at 15:03 PM on 3 August, 2021Checked Dr. Roy Spencer's update for the July UAH global average.
He has a new twist for presenting data to make it appear as though the current numbers as not unusually high. He has shifted all the data to be lower relative to the zero line. And he helpfully provides the following:
"REMINDER: We have changed the 30-year averaging period from which we compute anomalies to 1991-2020, from the old period 1981-2010. This change does not affect the temperature trends."
If the change does not affect the presentation of the temperature trends then - Why was it done? Probably to try to make things appear more like he wants them to appear.
- SkS Analogy 22 - Energy SeaSaw
One Planet Only Forever at 12:42 PM on 11 May, 2021Evan, I try to learn as I try to help other people understand what is happening. I appreciate your attention to my comments, and your feedback.
I have a few more suggestions for your consideration starting with the last point you made in your comment @16 (potentially only my comments “Regarding 10 years of temperature data being a sufficiently long time to provide a degree of technical rigour” affect what you have presented in your See-Saw item).
I find it helps to expose people to the fuller record of basic data like CO2 levels and Global Average Surface Temperature. That can help them see how unusual or unnatural the recent values are and that CO2 and Temperature are related. That is why I recommend looking at the history of Temperature and CO2 data:
- back to 1880 for the surface temperature which shows that one of the biggest See-Saws was a warm bump in the 1940s that many “global warming - climate change” doubters mistakenly believe was Globally warmer than now because it was very warm in parts of the USA (And some people experienced that or knew someone who was alive back then similar to your “Winter recollections”).
- back to 1979 for the satellite data (to see that, though satellite temperatures are not the surface temperature, the pattern of temperature is similar)
- and back 800,000 years for CO2 levels, like the animation by NOAA that allows the details of recent decades to be seen along with the final full length record. It shows that:
- several 100 to 120 ppm changes happened in the previous ice-ages
- the high level of CO2 of 300 ppm was only reached once in all that time, until recently
- for the past 4000 years the CO2 level has been between 270 and 280 ppm.
- CO2 levels are now at 420 ppm, 140 above the pre-industrial level of 280 ppm, and continues to increase, and indeed an increase of 100 ppm since 1960.
The higher recent rates of warming do indeed over-whelm the impressions of the See-Saw. However, the magnitude of the warming is more important. Even if the decade rate was only 0.10 degrees C, eventually the warming would be clear in spite of the larger swings of the See-Saw.
Regarding how people will perceive a message
There is a diversity of awareness, understanding and perspective. Not everyone will see things the way you intend.
You asked: “Many people feel a difference in winters now than during their childhood (1970's or earlier). Can you tell how old I am? :-)”
What I can tell is how far North you likely live. You are likely part of the small portion of humanity who live north of, or near to, 60 degrees N latitude. The arctic regions have warmed faster than the rest of the global surface. People may legitimately recollect that Northern winters were different decades ago. But global average warming since the 1960s is far less than 1 degree C with non-arctic areas warming less than the average (and there is more warming at night than the daytime. So, people in non-arctic areas may not recall a difference. I was born before 1970 and have lived between 50 an 55 degrees N. In spite of my bias of being aware of the warming and climate change that has occurred, I cannot claim a clear recollection that winters were significantly different when I was younger. So there are likely many people who do not have a legitimate recollection that winters were different decades ago.
Regarding 10 years of temperature data being a sufficiently long time to provide a degree of technical rigour
I do agree you may want to reconsider what you say about the adequacy of a 10 year set of temperature data.
As KR suggests, unless the data has had significant variable influences like ENSO and volcanic impacts scrubbed out of the data, which raises questions about how those impacts are “scrubbed out”, temperature data sets longer than 20 years may be needed to avoid unintended interpretations.
I spent a little time learning about “decades of temperature data using the SkS Temperature Trend Calculator. I looked at the Trend values for sets of 10 years in the GISTEMPv4 and UAHv6.0 TLT data starting in 1979 (everyone can do this to verify the results):
- The Satellite data set shows a negative trend for the decades starting in 1987, 1998, 2000, 2001, 2002, 2003, and 2004.
- There are also many decades where the Positive Trend is less than 1/10th of the 2 sigma range of variability starting in 1980, 1986, 1997, 1999, and 2005 (decades with almost no clear warming, like the set starting with 1997 being 0.015 +- 0.445 degrees C per decade meaning a value range from -0.430 to +0.460, or 2005 being 0.005 +- 0.376 meaning -0.371 to +0.381).
- In the Surface Temperature data set only the decade starting in 1987 had a negative trend. There were no decades with a positive trend that was less than 1/10 of 2 sigma.
This may explain why the likes of Dr. Roy Spencer focus on their satellite data manipulations and try to claim the superiority of that data over surface temperature data. That run of values from 1997 through 2005 was a long period of being able to claim that the warming had appeared to have ended even though CO2 levels continued to increase (the UAHv6 data set trend for the 19 year period of 1997 to 2015 is negative. In the UAHv5.6 data set the longest negative Trend was for the 11 years 1998 – 2009, and in the RSSv4 TLT data set the longest negative trend is the decade starting with 2003). So shorter sets of data, rather than the fuller story, can be the “Friend” of the likes of Dr. Roy Spencer (and updated manipulations of the data can also be “Friendlier to the likes of Dr. Roy Spencer.).
A final point about presenting decade averages
I do like the presentation of the averages of the 70s, 80s, 90, 2000s, 2010s when a graph cannot be shown. And I agree that such a presentation is not improved by adding earlier decades. But I also consider a “moving average” presentation to be better, but it needs to be Graphed (referring to the SkS Temperature Trend Calculator works). The moving average values can’t be described in words the way the decade averages can be. However, the discrete decade averages are a 120 month "moving average" with the data points being every 10 years (on a graph the decade averages would be points in the middle of each decade). As you can see from the investigation I summarized above, any set of 10 years of data can be a Decade average. And when those averages are done for each new month of data the series of points will look like a line (note that Dr. Roy Spencer presents a 13 month moving average because that makes it easier to present the data points. They go on the middle point of the data set – no need to set the graphic up to present a 12 month average between the middle two months of a 12 item data set).
- Critical Thinking about Climate - a video series by John Cook
nigelj at 12:50 PM on 7 October, 2020An example of climate change sceptics who give mixed messages might be Roy Spencer, a sceptical leaning climate scientist. He says in his writings that some warming is human caused, but that much of the warming is natural, so he is not in complete denial apparently. Except that he also signed an evangelical declaration on global warming that said "the recent warming is one of many natural cycles through history" (note it didnt say "partly"due to a natural cycle but clearly means its all natural). Refer to his bio on wikipedia. Another sceptic with ever changing views is Judith Currie, depending on her audience.
- YouTube's Climate Denial Problem
Eclectic at 12:32 PM on 10 April, 2020Since the SkS scene is a bit quiet at the moment (a covid-19 effect?) , I take the liberty of doing some more waffling about the notorious WUWT website. So my apologies for this long post.
WUWT claims to be the world's "most viewed site" for global warming and climate change ~ and I have seen no evidence disproving WUWT 's possession of the crown for most popular Climate Denial echo-chamber website status.
As mentioned above, WUWT has a rapid churn of headlines to keep its fans interested & clicking-on frequently. Proprietor Anthony Watts claims WUWT receives no subsidy from the fossil fuel industries ~ I don't know if this was so in its early days, but it could well be so nowadays. (There are of course many ways in which secret sponsors can covertly channel funds indirectly to WUWT or associated entities . . . but that's not immediately relevant to the site's anti-science activities.) Judging by the large range of of on-line advertising at the WUWT site, it seems there is no shortage of dollar income ~ and it also suggests that the on-line advertising agencies have examined & confirmed a high rate of traffic going to the website.
Nigelj and OPOF ~ my earlier wording that many of the regular WUWT commenters "are thick as two short planks" . . . was a colloquialism, and was not meaning that Denialists are of lower IQ than the general population. AFAIK, there is no evidence that Denialists have an average IQ lower than logical thinkers have. Yes, most of the WUWT commenters are "pretty average" [another colloquialism!]. But as always ~ it is not whether you are intelligent but whether you actually use the intelligence you have.
And there are indeed [a few] highly intelligent commenters at WUWT. My favorite is Willis Eschenbach. Very intelligent, and he has a sense of humor I like . . . but despite his analytical skills, he nevertheless has a "Dark Side" twist in his psyche ~ such that he always fails in the end to reach the destination of logical synthesis of the full context of the climate issue. I reckon he has a combination of Motivated Reasoning and Doublethink. Like so many (all?) Denialists, he somehow manages ultimately to suppress seeing the Bleeding Obvious.
# There are certain neurological conditions [often, from stroke] where the brain fails to identify the human face, or other objects. Climate Denialists achieve that status, sometimes wilfully perhaps . . . but eventually it becomes an automatic mental habit to "not see" what their emotions don't want to see.
Nigelj , as I mentioned earlier, it surely must be that the WUWT Moderators allow Nick Stokes as a token example of their "non-discrimination" policy. But there is yet another example ~ Steven Mosher. Mosher does not come from the strong scientific background of Stokes . . . but over the years he has gained his stripes as a scientist (in a de-facto manner). IIRC, Mosher was at first rather climate-skeptical, and joined the original BEST project in a sort of literary capacity. And when the BEST project eventually confirmed the mainstream climate science data, he accordingly "converted" to become a mainstreamer.
As a convert from "skepticism" , Mosher is loathed and hated by the bulk of WUWT commenters. Mosher's style is usually not to go into details on how the OP or fellow commenters have messed up or been stupid . . . but he more often issues a one-liner to point out an error, or he merely says [in effect] : "Sigh. You've gotten it wrong again." Unsurprisingly, this enrages many of the Denialists.
Stokes is hated too, and is hated also because he is unfailingly correct , and the Denialists can find no chinks in his scientific armor ~ not that the Denialists at WUWT would ever change their viewpoint merely because someone publicly proves them wrong !
In the past, WUWT had a system where registered commenters could vote a Like or a Dislike to any post in the Comments column. Run-of-the -mill Deniaist comments sometimes garnered one or two or a handful of Likes. But I always found it amusing to see how every comment by Stokes or Mosher was immediately garnering 20 - 50 Dislikes ! (In a way, it's pity this Like/Dislike barometer got scrubbed.)
# Over my years of observation, there have not really been any other "anti-Denialists" to stay the course in the hostile environment at the WUWT comments columns. Some appear for a little while, then disappear ~ mostly by being censored I think (but doubtless, a few have become tired & disgusted). Yet I also detect a few who (after banning) resurrect themselves under a new pseudonym. However, in recent months WUWT has introduced a new stricter regime of registration to make resurrection far more difficult. ( It also raises your risk of being doxxed.)
And no, I myself don't post at WUWT. The denizens there are largely rabid political ultra-extremists, quite uncharitable to humanity as a whole. There are also some (apolitical or non-partisan) scientific crackpots. But all are hard-core deniers of climate science, and they show zero inclination to become sane.
# If you examine the bulk of WUWT posted articles, you see a strong undercurrent of petulant and childish propaganda slant. Clearly WUWT is essentially aiming at the Lowest Common Denominator of everyday Denialists. (Some Denialist websites exist, which are slightly more high-brow e.g. Judith Curry's and Roy Spencer's .) But for rampant psychopathology, my "vote" goes to WUWT.
My apologies once again for the long post. I hope readers have found elements informative and/or entertaining.
- YouTube's Climate Denial Problem
One Planet Only Forever at 07:10 AM on 9 April, 2020I commented on the recent "A History of FLICC:..." post with what I think accurately describes Deniers (of any improved awareness or better understanding):
- People who are less aware, with a related lack of understanding, who are unwilling to learn - including people who have a lack of interest in learning - especially people who sense that learning would require them to change their mind about something they have developed a liking for.
Everyone else, including the most knowledgeable of experts, are:
- People who are less aware, with a related lack of understanding, who are interested and willing to learn.
Deniers are not Dumb or Incapable of learning. They lack an interest in learning, maybe because there is so much they learned that would have to be corrected that they are happier to carry on believing what they developed a liking for - no amount of effort to increase awareness or improve understanding will make much of a dent in those types of made-up minds.
Tragically for the future of humanity there is a lot of developed Liking that needs to be corrected but resists being corrected because the corrections would be detrimental to many developed Impressions of Superiority Relative to Others. Massive denial resistance easily Drummed up by misleading marketing appeals to people willing to be easily impressed by it is to be expected.
Sites like WUWT and Dr. Roy Spencer's are like Pied Pipers for people desiring to be misled, not wanting to learn how to be helpful, liking excuses for being harmful. As are all the misleading YouTube bits that this OP is concerned about.
- Here Are 3 Climategate Myths That Have Not Aged Well
One Planet Only Forever at 09:30 AM on 1 December, 2019blub @36,
"Give me 10-100Million dollars and i will design a model which will show that cimate correlates with anything you want it to correlate..."
I believe you could try but you would unlimately not be able to sustain any perceptions you create that do not actually match or reasonably explain the robust diversity of observations and information that is available.
Dr. Roy Spencer has repeatedly tried to get 'his interpretation of satellite data to indicate temperatures in the atmosphere, not at the planet surface' to prove that global average surface warming is not happening the way the climate science has determined it most likely is happening at the surface. He has had to correct his interpretation many times when the results of his way of interpretting the data failed to make sense. But he persists in trying to make-up any possible claim that warming is not occurring, or is not significant, or is beneficial even those everyone with increased awareness and understanding of what is going on 'actually knows better'.
- Here Are 3 Climategate Myths That Have Not Aged Well
One Planet Only Forever at 07:22 AM on 20 November, 2019Questions regarding Dr. Roy Spencer include:
- "Why is he still able to be perceived to be a pursuer and professor of expanded awareness and improved understanding?"
- "How is he able to still have his work funded, given the history of misunderstanding he has presented, including the many misleading presentations of the results of his manipulations of satellite data?"
It appears that the developed socioeconomic-political systems have become so corrupted by selfish pursuit of personal interest that Popularity and Profitability have been able to get significant control over "The direction of Thought". And that harmful selfishness is able to drive Thinking away from the pursuit of expanded awareness and understanding and the development of sustainable improvements for the benefit of the future of humanity.
- Here Are 3 Climategate Myths That Have Not Aged Well
nigelj at 06:09 AM on 20 November, 2019Roy Spencer is in charge of a group doing upper atmosphere temperature analysis. If his group were the only group doing this there would be a good case to discontinue his funding, given the misleading comments, sour grapes comments, and straw men he comes out with in the quotes mentioned @comment 3. Anyway his comments are also completely unscientific.
- Here Are 3 Climategate Myths That Have Not Aged Well
One Planet Only Forever at 04:10 AM on 20 November, 2019The careful deliberate deceiver Dr. Roy Spencer continues to present more evidence of how deliberately deceptive he continues to be.
His take on the 10th anniversary of Climate-gate opens with the following gem: "... the unfortunate truth is that fewer and fewer people actually care about the truth." He relates that to his set-up point that a believer of Truth would be a "...skeptic of the modern tendency to blame every bad weather event on humans".
He follows that misrepresentation set-up with a doozy of Fictional Tale built on his carefully selected bits of Non-Fiction. His New Fable makes the initial Climate-gate Fiction appear almost Non-Fiction (less Fantasy) by comparison.
It opens with the following Fantastically incorrect Fairy Tale claim.
"You see, it does not really matter whether a few bad actors (even if they are leaders of the climate movement) conspired to hide data and methods, and strong-arm scientific journal editors into not publishing papers that might stand in the way of the United Nations Intergovernmental Panel on Climate Change (IPCC) mission to pin climate change on humans, inflate its seriousness, and lay the groundwork for worldwide governmental efforts to reduce humanity’s access to affordable energy."
And his fans and the lovers of WUWT will fervently passionately belief the Fairy Tales. That is an expected result of developing a powerful personal interest in benefiting from an understandably harmful and ultimately dead-end activity like fossil fuel use.
Future generations cannot continue to benefit from burning fossil fuels, they are non-renewable. All the future generations get is the increased challenges and harmful results created by what the previous generations 'choose to continue to do'. That Non-Fiction cannot be acknowledged in the Fantasy-Fiction-Filled made-up minds of the likes of Spencer and Watts.
The Sustainable Development Goals are like Garlic or Sunlight to the Vampire-like fantasy beliefs of the likes of Spencer and WUWT.
- There's no empirical evidence
MA Rodger at 02:18 AM on 27 August, 2019billev @385 & 386.
As well as setting out some quite complex questions that could be interpreted in different ways and which could do with being clarified, it would be useful to specifically understand why you say "there appears to be no evidence"?
It occurs to me that this sounds a bit like a passage in the chat Roy Spencer gave at the Heartland shindig at the end of last month. (His grand assertion was "And as we add CO2 the theory says we've reduced the ability of the earth to cool itself by about one percent. That's according to theory not measurements. None of our satellite measurements of any kind are good enough to measure that. It's a theoretical expectation." Of course, as is usually the case with statements from Roy Spencer, it is wrong.)
And as the subject is quite a complex one, it might be better to kick-off discussing it with a clear understanding of what you are actually asking about. Thus, could you explain why you say "there appears to be no evidence"?
- Residence Time and Prof Essenhigh
MA Rodger at 03:15 AM on 26 August, 2019daveburton @35,
It would be better if you could come up with some support for your advocacy of Spencer's silly model rather than presenting unsupported assertions that it is "correct". All we have otherwise is the 'big ocean' which you say must be thus effectively an infinitely large sink. You tell us "Mankind has increased CO2 level in the atmosphere by about 47%. We've increased carbon content in the oceans by only about 0.4%." (Note Roy doesn't reckon to your 47% figure.)
If that was correct that the percentage ocean carbon increase has to match the atmospheric percentage increase (which it doen't), that will have massive implications for a whole lot of stuff. (1) The projections of CO2 levels in the RCP scenarios would be massively revised if Spencer's model were anything like reflective of reality. Now I know Spencer denies that CO2 has any sigificant warming impact on the climate but this CO2 model would give him a brilliant second string to his contrarian bow (and how he needs one, as the other ones have proved pretty useless). (2) The implications for ocean acidification are massive and for fresh water it doesn't bear thinking about. (3) The low CO2 levels of the ice ages will have to be entirely re-thought. If atmospheric CO2 levels drop by a third, there would be 13,000Gt(C) being pumped out the oceans and into .... where? Golly, that's a tricky one!!
Yet (and I note that up-thread I wrongly called it a blog from last year 2018) in the four months since this model was posted (April 2019), I see no reference to it beyond that blog. It didn't even get a posting on the planet Wattsupia (which is a really bad sign!!!) Is Spencer too busy chatting to fellow contrarians at the Heartland Institute (where he seemed to have said nothing about his grand revalation)? So why the silence? My take is that Spencer's model is so embarassing that Spencer hopes it goes away. So, daveburton, you are not helping the reputation of poor old Roy with your insistence that his model is correct (when it patently isn't).
By the way, that long fat tail may be a lot stumpier than Spencer's model implies. The idea that the oceans are sucking up carbon at a rate constant with the level of atmospheric CO2 above an equilibrium of 295ppm(v) doesn't seem to hold over the period 1958-2010. Rather than a constant level of uptake, the rate has dropped by a half from the start of this period (1959-78) to the end of this period (1991-2010). That isn't exactly constant over centuries as Spencer's model assumes.
In truth, daveburton, your words do correctly assess Spencer's model when you say "If you start with a physically impossible assumption, you get a physically impossible result." That is exactly what Spencer's silly exercise in curve-fitting has done.
- Residence Time and Prof Essenhigh
daveburton at 21:52 PM on 25 August, 2019Eclectic wrote, "your heated-wire analogy is even wider of the mark..."
It is just a simple example illustrating a general principle. It's how negative feedback systems work. If the removal rate increases with system output level, that's a negative feedback mechanism. A constant forcing input will then result in a plateau at "equilibrium," where the negative feedback has caught up with the constant input.
That's true when the input forcing is energy added to your toaster via electricity, and the negative feedback mechanism is radiative & convective heat loss from a nichrome wire.
It's also true when the input forcing is CO2 added to the atmosphere, and the negative feedback is CO2 removal from the atmosphere via dissolution in the oceans and terrestrial plant uptake.
The principle is true regardless of whether the negative feedback is linear or nonlinear. For the nichrome wire example, there are actually three significant negative feedbacks, all with different transfer functions: radiative heat loss goes up in proportion to the 4th power of the temperature relative to 0K, convective heat loss goes up in approximate proportion to the temperature difference between the wire and ambient air, and the resistance of the wire also goes up with temperature. The fact that all three have different-shaped transfer functions doesn't affect the conclusion: because they are negative feedbacks, a constant input (forcing) must result in a plateuing output, gradually approaching equilibrium.
Eclectic continued, "The design of the Simple Model fits at best tangentially with physical reality."
It fits extremely well for the period for which we have accurate measurements:
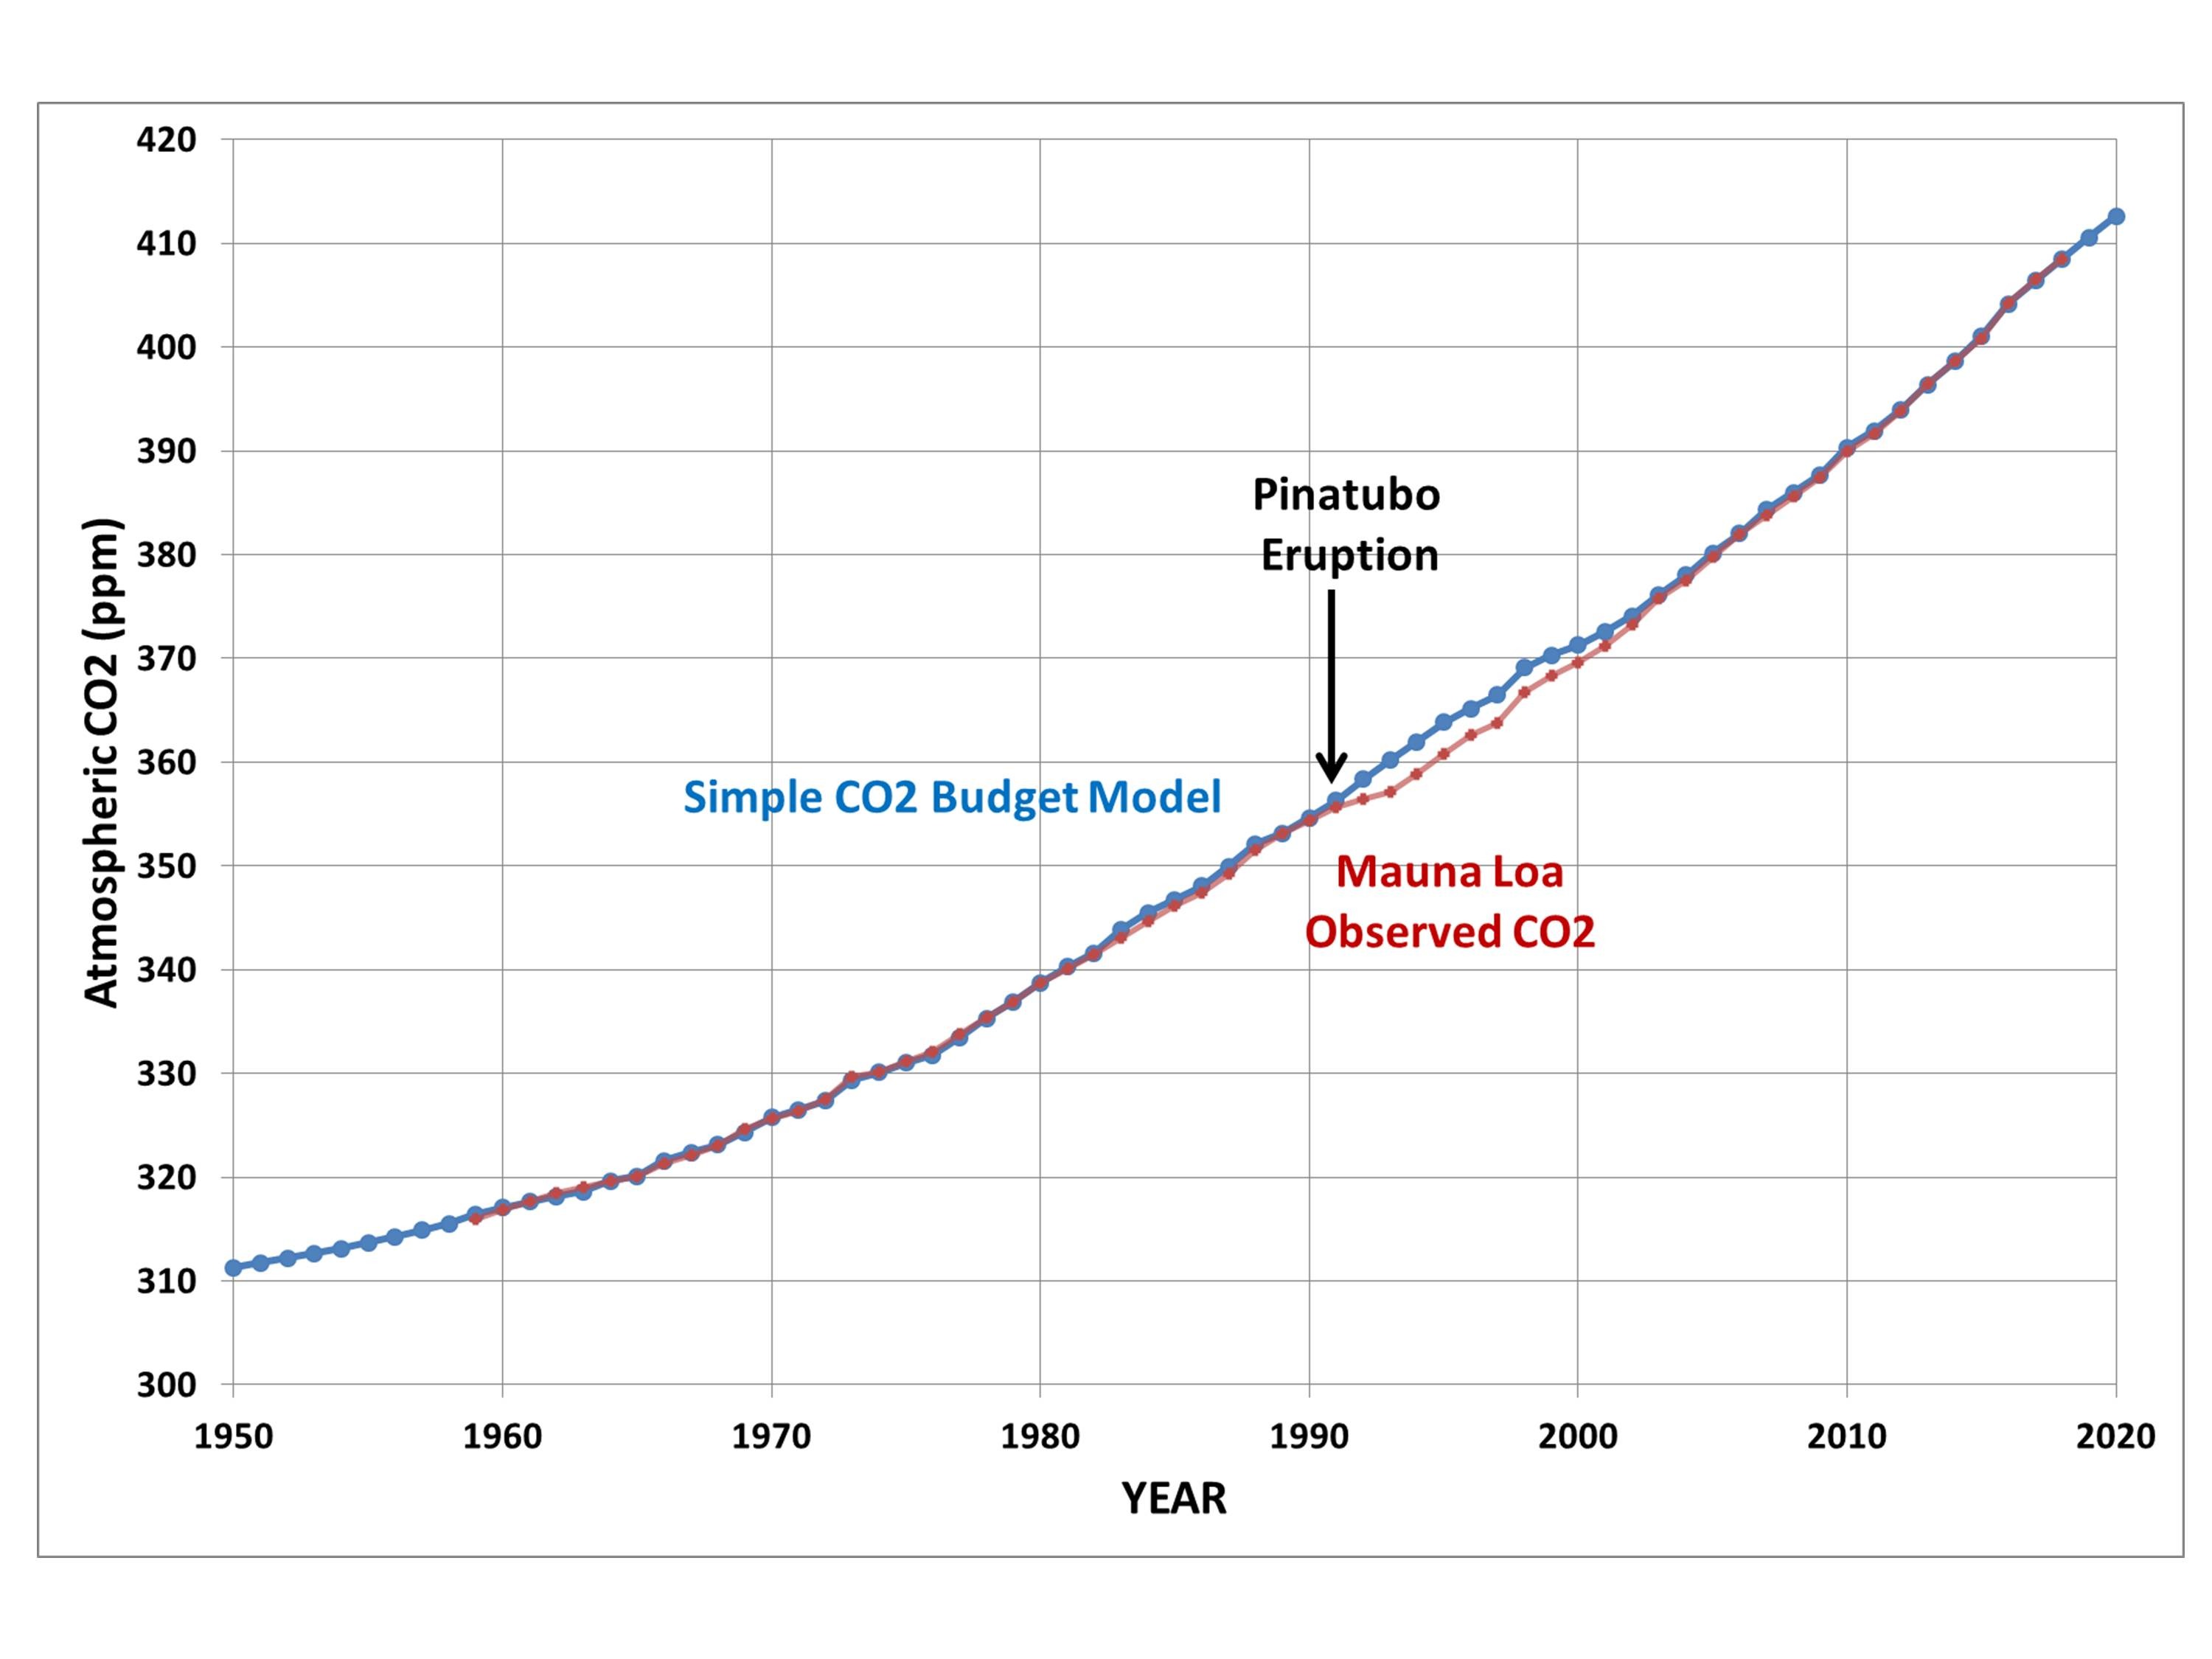
Eclectic continued, "nor do we have the luxury of time to sit back and observe another 40 years or so, as the Simple Model diverges from the (complex) real world."
Well, I obviously don't, at my age.
But mankind does have that luxury, and you should not expect Roy's Simple Model to diverge much from reality over the next 40 years. It is the "long, fat tail" (due to increased carbon levels in non-atmospheric reservoirs) which is not modeled by the Simple Model. Regardless of what happens with CO2 emission rates, CO2 removal over the next 40 years will be dominated by the removal mechanisms which the Simple Model models well.Eclectic continued, "the paleo evidence demonstrates the falsity of Spencer's too-simple Simple Model."
All models are false, but some are useful. Roy's Simple Model is very useful. It is a very good fit to measured reality, and it will continue to be a good fit as long as the CO2 removal mechanisms which are currently most important continue to be most important. When CO2 levels drop below 300 ppmv, and the accumulation of anthropogenic carbon in non-atmospheric reservoirs becomes an important factor affecting atmospheric CO2 levels, then his Simple Model will diverge from reality.
MA Roger wrote, "Yes, the oceans are big. Yes, the oceans contain contain sixty-times the carbon found in the pre-industrian atmosphere (which was in full equilibrium with the oceans). But what has that got to do with your "fact"?"
Mankind has increased CO2 level in the atmosphere by about 47%. We've increased carbon content in the oceans by only about 0.4%.
So, why does that matter? Because it is that accumulation of carbon in non-atmospheric reservoirs that is not modeled by Roy's Simple Model. In other words, his Simple Model assumes the other carbon reservoirs have infinite capacity.
That's a pretty good simplifying assumption, as long as the anthropogenic increase in atmospheric CO2 dwarfs the anthropogenic increase in carbon in other reservoirs. It will diverge from approximating reality during the "long, fat tail," when the anthropogenic increment in atmospheric carbon dioxide no longer dwarfs the anthropogenic increase in carbon in other reservoirs.
MA Roger wrote, "it is very odd that they would ever allow atmospheric levels to remain constant while the ocean absorbed a large constant flux of dissolving CO2."
Atmospheric levels will remain constant when transfer of carbon to the oceans and other carbon reservoirs removes CO2 from tha air as quickly as anthropogenic emissions are adding it. (They're currently removing it only about half as fast as we're adding it.)
MA Roger asked, "Have you actually examined the workings of Spencer's model?"
Of course.
MA Roger wrote, "If you set the future anthropogenic emissions to a fixed value... atmospheric CO2 levels tend to a constant value"
Which is, of course, correct.
MA Roger wrote, "while negative emissions, suck out 15Gt(C)/yr and by AD2191 the atmosphere is entirely denuded of CO2. daveburton, doesn't that strike you as "very odd"?"
Not at all. If you start with a physically impossible assumption, you get a physically impossible result. The only thing I can think of which could possibly remove a net 15 GtC/year from the atmosphere when CO2 levels are below 300 ppmv, is some idiot genetically engineering a fast-growing, fast-propagating C4 tree.
Please don't do that! The Earth doesn't need another K-T Extinction! - Residence Time and Prof Essenhigh
MA Rodger at 20:49 PM on 24 August, 2019daveburton @32,
Yes, the oceans are big. Yes, the oceans contain contain sixty-times the carbon found in the pre-industrian atmosphere (which was in full equilibrium with the oceans). But what has that got to do with your "fact"?
The ocean carbon content is a complex mix of carbonate species that populate our salty seas. The actual amount of dissolved carbon dioxide in the whole global ocean is a tiny portion of the total, perhaps 200Gt(C), less than a quarter of the carbon dioxide in the atmosphere. It is this alone that that the atmosphere directly balances with (this balance achieved only when it appears at the surface).
Given the complex set of carbonate species within the oceans and the complex ocean currents, it is very odd that they would ever allow atmospheric levels to remain constant while the ocean absorbed a large constant flux of dissolving CO2. (When I say "very odd" I mean it is utter nonsense.) And were it not so, the accepted scientific works on the subject would be themselves very odd.
Have you actually examined the workings of Spencer's model? (The spreadsheet of it is linked on this Spencer blogpage) If you set the future anthropogenic emissions to a fixed value (Spencer sets it to 10.109Gt(C)/yr) , atmospheric CO2 levels tend to a constant value:-
CO2[atm-ppm] = 195 + 20 x Emissions[GtC]
So drop emissions to zero and see the pre-industrial CO2 level restored in two centuries. while negative emissions, suck out 15Gt(C)/yr and by AD2191 the atmosphere is entirely denuded of CO2.
daveburton, doesn't that strike you as "very odd"?
- Residence Time and Prof Essenhigh
MA Rodger at 19:03 PM on 23 August, 2019daveburton @27,
The problem is as described by Eclectic @28&30. Roy Spencer is not renowned for errorless analysis. This 2018 blog of Spencer's you rely on is no more than an exercise in curve-fitting that leads to the ridiculous conclusion that if humanity restricts itself to pumping 10Gt(C)/year of CO2 into the atmosphere (as it did in 2018), continuing year-after-year for ever-&-ever-&-ever, the atmospheric CO2 level will stablise over 200 years at 500ppm(v) CO2.
This is plainly nonsense. Where does all this extra carbon accumulate? And if paleoclimate studies show atmospheric CO2 levels in past eons at 2,000ppm for over a hundred million years, were did the carbon come from to maintain such levels? According to Spencer's model, simply to maintain it at 500ppm over such a period would require emissions upward of 1Zt(C). I'm pretty sure the planet doesn't contain that much carbon!!
You are perhaps correct to suggest that many misinterpret the Airbourne Fraction which is simply a product of our rising emissions. It is not a subject much discussed beyond the Af concept itself. In terms of the draw-down mechanism, Af is a very poor concept to start from. So in Af terms in 2018, that 57% of 2018 CO2 emissions drawn-down out of the atmosphere is better seen as comprising something like a draw-down of 4% of the emissions 2014-18, 2.5% of the emissions 1999-2013, 0.6% of the emissions 1919-98, etc. These approximate numbers I obtain by scaling one of the 1000_cswv plots in Fig 1 of Archer et al (2009) 'Atmospheric Lifetime of Fossil Fuel Carbon Dioxide' which models a single 1,000Gt(C) impulse. The draw-down dynamics under the gradual release of AGW mean these numbers will not entirely match the AGW numbers, but they do well enough as a rough guide.
- Residence Time and Prof Essenhigh
daveburton at 10:31 AM on 23 August, 2019Trying again, with explicit line-breaks added...
Mr. Moderator, I meant no offense, but I'm not aware of any comment policy that I violated, and I do not understand why you deleted so much of my comment.
MA Rodger, here's where the "about fifty year" practical residence/adjustment time comes from. Well, actually, a number of scientists have independently calculated approximately the same figure, but this is how I did it.
Start with the observation that the rate at which natural systems (oceans & terrestrial biosphere, mainly) remove CO2 from the air is governed chiefly by the CO2 level in the air. When the CO2 level is higher, so is the removal rate. When the CO2 level is lower, so is the removal rate.
Some people think the removal rate is governed by the emission rate, and that it's necessarily "about half" (leaving an "airborne fraction" which is also about half). They are mistaken. There is no physical mechanism by which any of the major contributors to the removal rate could be governed by the emission rate. It is the CO2 level, not the CO2 emission rate, which primarily governs the removal rate.
For the oceans, the removal mechanism is dissolution into surface water per Henry's Law, and then then transport to the ocean depths by currents and calcifying coccolithophores, and complex chemistry which is beyond my ken.
For the terrestrial biosphere it is "greening."
AR5 estimates that the terrestrial biosphere removes about (2.5/9.2) = 27% [p. 6-3] or 29% [Fig 6.1] of anthropogenic CO2 emissions from the atmosphere, each year, and that the oceans remove another 26% [Fig 6.1]. (There are wide error bars on those numbers, but the ≈55% sum has narrower error bars than the two addends have.)
Of course, other things also affect the CO2 removal rate, as is obvious, for example, from the detectable effect of very large volcanic erruptions on measured CO2 levels. But the most important factor governing the CO2 removal rate from the atmosphere is clearly the CO2 level in the atmosphere.
Those numbers are known, with fair precision. For the last sixty years we have very good records of both atmospheric CO2 levels and production/use rates of fossil fuels & cement (from which can quantify the main sources of anthropogenic CO2 emissions).
From those data we can calculate how much CO2 was removed from the atmosphere by natural sinks (oceans, biosphere, etc.), each year.
Since we also know the atmospheric CO2 level each year, we can easily build a spreadsheet, and fit a curve, showing the approximate net rate of CO2 removal as a function of the CO2 level.
Dr. Roy Spencer did that, and found it is very closely approximated by a very simple function, which you can read about here:
http://www.drroyspencer.com/2019/04/a-simple-model-of-the-atmospheric-co2-budget/
Using Dr. Spencer's "simple model," I wrote a tiny Perl program to simulate the effect on atmospheric CO2 level of a sudden cutoff of CO2 emissions. Counting 280 ppmv as "pre-industrial," 63% of the anthropogenic CO2 is gone from the atmosphere in 54 years, and 2/3 is gone in 60 years:#!/usr/bin/perl
# estimate CO2 removal rate in ppmv/yr as a function of CO2 level in ppmv,
# per Dr. Roy Spencer's "simple model"
# ref: http://www.drroyspencer.com/2019/04/a-simple-model-
# of-the-atmospheric-co2-budget/
sub removal_rate {
local($co2level) = shift;
local($removalrate) = 0;
local($co2elevation) = $co2level - 295.1;
local($ratio) = 47.73;
if ($co2level <= 295.1) {
$removalrate = 0;
} else {
$removalrate = $co2elevation * 0.0233;
}
return $removalrate;
}
# SIMULATE DECLINE IN CO2 LEVEL IF EMISSIONS SUDDENLY WENT TO ZERO
$co2level = 410;
$year = 2019;
print "Simulated CO2 level decline, with level starting at
$co2level ppmv in $year, and zero emissions:\n";
while ($co2level > 300) {
printf("$year %5.1f\n", $co2level);
$year += 1;
$removalrate = &removal_rate( $co2level );
$co2level -= $removalrate;
}
Here's the result of a simulation run, with CO2 starting at 410 ppmv in 2019, and zero emissions:
2019 410.0
2020 407.3
2021 404.7
2022 402.2
2023 399.7
2024 397.2
2025 394.8
2026 392.5
2027 390.3
2028 388.0
2029 385.9
2030 383.8
2031 381.7
2032 379.7
2033 377.7
2034 375.8
2035 373.9
2036 372.1
2037 370.3
2038 368.5
2039 366.8
2040 365.1
2041 363.5
2042 361.9
2043 360.4
2044 358.8
2045 357.3
2046 355.9
2047 354.5
2048 353.1
2049 351.7
2050 350.4
2051 349.1
2052 347.9
2053 346.6
2054 345.4
2055 344.3
2056 343.1
2057 342.0
2058 340.9
2059 339.8
2060 338.8
2061 337.8
2062 336.8
2063 335.8
2064 334.9
2065 333.9
2066 333.0
2067 332.2
2068 331.3
2069 330.4
2070 329.6
2071 328.8
2072 328.0
2073 327.3 <== residence/adjustment time (e-folding time) = 54 years (using 280 ppmv as base)
2074 326.5
2075 325.8
2076 325.1
2077 324.4
2078 323.7
2079 323.0 <== two-thirds of the anthropogenic CO2 is gone in 60 years (using 280 ppmv as base)Of course we know that this simple model would not accurately model the "long, fat tail," with CO2 levels under 300 ppmv. But the point I made previously is that, for practical purposes, that doesn't matter, because we all know that CO2 levels that low are harmless.
- 'No doubt left' about scientific consensus on global warming, say experts
shoyemore at 16:49 PM on 1 August, 2019Sam-qc,
Crescenti's letter has had little or no impact in Europe. This was the first I heard of it.
Part of the right and far-right retain climate change denial as part of their DNA, but the recent (relative) success of the Greens in European elections has forced them to dial back. I am not sure if they have the stomach to fight this battle again, which they apparently lost.
The letter reads like a regurgitation of standard boiler-plate denial. I could have been written by Roy Spencer. The inclusion of the name of Fred Switz and the pre-refuted NIPCC Report is a dead giveaway.
However, there is no reason to be complacent. We await the stance of the Johnson UK Government on climate change - his cabinet contains "skeptics", and he has been ambivalent in the past.
- 'No doubt left' about scientific consensus on global warming, say experts
knaugle at 00:17 AM on 30 July, 2019Wow! I occasionally peruse Roy Spencer's blog, and he definitely is not on board with the consensus. His latest post is still beating the "urban heat island" and "it's always cold somewhere else" drums. I wonder if he and John Christy are all that remains of the "3%"? It's no surprise the political think tanks like CEI are pushing to not even mention this topic. As I recall it was one of their key talking points 20 years ago, that scientists are all over the map on AGW.
- Roy Spencer on Climate Sensitivity - Again
climate_watcher at 17:58 PM on 4 June, 2019Another Roy Spencer blog post on this topic, posted in our group for climate change news.
http://www.drroyspencer.com/2018/04/new-lewis-curry-study-concludes-climate-sensitivity-is-low/?fbclid=IwAR2EU3mgUfELyXzhXEiznTlXGTeMwVK7rV9ZS7jkt-L3kTPo0u9_XWR1bJw - The human fingerprint in the daily cycle
MA Rodger at 18:55 PM on 30 May, 2019Ddah144,
Your initial comment on this thread @142 made quite an issue of "the moon’s huge day to night temperature swings" which doesn't seem to have been addressed properly. You correctly point out that the massive size of the change in lunar day-to-night temperature is due to the month-long Lunar day. The graph below shows the equitorial lunar temperature and the temperature range remains high all the way from the equator almost to the poles - even at 75º of latitude it has only dropped from a 300K swing to 200K.
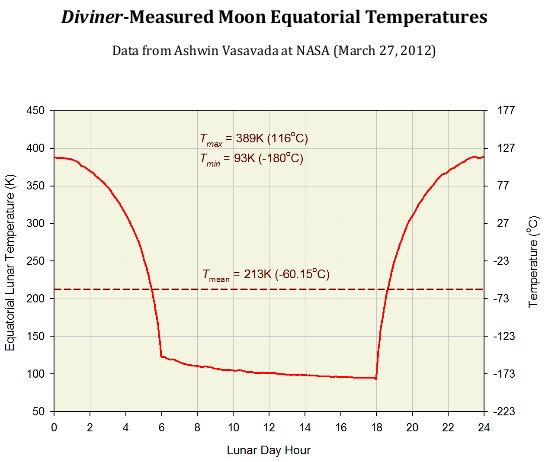
The portion of this lunar graphic of interest when considering the equivalent effect for a 24 Earth-hour rotation would be the 0.8 Lunar-hours centred on the Lunar average temperature. That would suggest a day-to-night equatorial temperature range of something like 80ºC. A more accurate calculation (the graphic below provided by climate skeptic Roy Spencer) shows an equitorial range of about 70ºC, a lot lower than the actual range for a planet with a GHG atmosphere. For instance Singapore has (or more correctly 'had') an average daily maximim of 30.3ºC and daily minimum of 23.5ºC, thus a range of just 7.2ºC.
- 10 Indicators of a Human Fingerprint on Climate Change
MA Rodger at 02:56 AM on 5 May, 2019Wilmer_T @100,
The paper you refer to is Varotsos & Efstathiou (2019) 'Has global warming already arrived?', the latest serving from a pair of nonsense-writers. Concerning increased height of the tropopause (fingerprint #9), this is found occurring in climate models and within atmispheric measurements, as shown by Santer et al (2001) cited by the OP above and this finding continues to be observed (eg Xian & Homeyer 2018).
Varotsos & Efstathiou ignore this serious work entirely and instead use UAH TP satellite data to assert there is no increase in tropopause height because there is no increasing trend in UAH TP. The use of such data is mind-blowingly stupid, as worthless as using a twelve inch ruler to measure the width of a human hair. UAH TP does not measure tropopause temperature. It measures a wide range of temperatures from the surface up to 24 km. Thus it is measuring the cooling stratosphere as well as the warming troposphere, two strong signals which will overwhelm entirely any tropopause tempoerature trend. The figure below is sourced from Spencer at UAH.
- Freedom of Information (FOI) requests were ignored
Bob Loblaw at 02:29 AM on 11 March, 2019To address the specific quote that Rogue provides in #17:
The quote should be interpreted as an indication that the single "temperature" value provided by the UAH model calculations (based on satellete-measured atmospheric radiation emissions - AKA brightness) are dependent on atmospheric conditions over the layer from the surface to roughly 8km. The value is not equally-weighted for all heights within that range. Spencer's web site shows the weighting for the various model values they produce:
- 97 hours of consensus: caricatures and quotes from 97 scientists
Marathon at 06:30 AM on 21 February, 2019Magma, The three deniers are John Christy, Richard Lindzen, and Roy Spencer.
- The Scientific Consensus on Climate Change
One Planet Only Forever at 01:35 AM on 24 November, 2018There appears to be confusion due to incorrect conflating of:
- Scientific consensus of understanding (development of an emergent truth that is open to correction if substantive new evidence is contrary to the developing understanding).
- An individual's helpfulness in efforts to improve awareness and understanding: in the field of understanding, among leaders in society, among the general population.
Individuals are not 'part of the 97% or 3%'. The consensus measure is regarding how much of the 'literature that is a legitimate part of the effort to improve the understanding of an area/field of understanding' is aligned with a developing understanding. As the degree of alignment increases it can be understood that an emergent truth is being established (an understanding that is unlikely to be significantly altered by new investigation in that field of learning).
An evaluation of all of an individual's actions is the basis for determining how helpful they are to the improvement of the understanding and to the increased 'correct' awareness and understanding among leaders and the general population.
While the likes of Judith Curry, Roy Spencer and Richard Lindzen may have their names on a specific piece of literature that is included in the 97% side of the climate science consensus evaluation regarding the understanding that human activity is significantly impacting the global climate, that does not make them 'a part of the 97% side'.
Individual merit would be determined by their collective actions regarding the understanding. That evaluation would undeniably indicate that the likes of Judith Curry, Roy Spencer and Richard Lindzen are very unhelpful (harmful) to the improvement of awareness and understanding the understanding that human activity is significantly (and negatively) impacting the global climate that future generations will suffer the consequences of and the challenge of trying to maintain perceptions of prosperity that are the result of a portion of humanity getting away with benefiting from the damaging unsustainable burning of fossil fuels (benefiting in ways that do not develop sustainable improvements for the future of humanity - like perceptions of reduction of poverty that cannot be sustained if the damaging impact creation of fossil fuels is significantly and rapidly curtailed like it has to be in order to minimize the damage done to the future generations of humanity).
- The Scientific Consensus on Climate Change
Philippe Chantreau at 13:15 PM on 23 November, 2018As I recall, there has been a longstanding disconnect between what Roy Spencer's reseach results show and the opinions he communicates to mass media. One can say that his own research does not really support his opinions. Perhaps that's why he figures as part of the consensus. The consensus is one of results more than opinions. AFAIK, Spencer's peer- reviewed papers do not show anything that deviates significantly from the all the rest of the science.
- The Scientific Consensus on Climate Change
Art Vandelay at 09:57 AM on 23 November, 2018One Planet Only Forever @ 9. I take your points but I'm not convinced that any of those forementioned scientists have too much impact on the public's perception of climate change. Very few people I speak to have heard of Roy Spencer, even if they're aware of satellite based temperature measurements, so I would be suprised if his blog is widely read and influential to any significant extent. Most people's attitudes to climate change are derived from their media channels of choice, which to a large extent is determined by their political leanings.
But still, it's anomalous that Spencer is probably included in the 97% along with several other scientists with profiles in the faculties of climate research, which is why I would personally like to see a more detailed analysis of climate scientist opinion.
- The Scientific Consensus on Climate Change
One Planet Only Forever at 01:59 AM on 23 November, 2018Art Vandelay@8,
A more important measure than 'grudging acceptance of climate science to a limited degree' is how helpful a person is to improving the more correct awareness and understanding of climate science in the general population and among leadership.
By that measure Judith Curry, Roy Spencer, Richard Lindzen are dismal damaging failures.
As a case in point, I frequently visit Roy Spencer's site (just for the amusement, but in case he actually presents a meaningfully insightful point).
Roy Spencer spends almost all of his time making up stories to refute the need for the burning of fossil fuels to be curtailed. The lack of validity of his story-telling is consistent. He also spends a significant amount of time creating creative ways to intrerpret satellite data in an attempt to refute that unacceptable warming and climate change is happening (he has been forced to partially correct his misinterpretations of the satellite data many times).
- The Scientific Consensus on Climate Change
Art Vandelay at 17:27 PM on 22 November, 2018It should be noted too that Judith Curry, Roy Spencer, Richard Lindzen et al, are all painted as skeptics or "deniers", but are in fact members of the 97% consensus.
Perhaps a more valuable statistic would be one that indicated a percentage of (climate) scientists who hold the view that it's a serious threat requiring urgent, universal remedial action.
- IPCC overestimate temperature rise
MA Rodger at 00:07 AM on 6 November, 2018Samata @65,
The Monckton YouTube video you link to appears to be the 'work' presented in Monckton et al (Unpublished) which remains unpublised because it is total nonsense. You ask for the mathematical errors. There may be many but the central problem Monckton has is his insistence that climate sensitivity can be calculated on the back of a fag packet in the following manner:-
If the black body temperature of a zero GHG Earth is 255K and there is, according to Monckton, enough forcing pre-industrial to add 8K to that temperature directly from those forcings (giving a temperature without feedback of 263K), then if the actual pre-industrial temperature with feedbacks is 287K, the feedback mechanisms have raised the temperature by 24K. Monckton then calculates the strength of these feedbacks as a portion of the full non-feedback temperature (287/263-1) = 0.09. [This, of course, is a big big error.] Thus ECS(Monckton)= 1.1K x 1.09 = 1.2K.
(See Monckton's explanation of his basic method at Roy Spencer's, a climate denier who refutes Monckton's methods).
The big big error is in attributing pro-rata feedback to all the black body warming. It is also an error to run with these back-of-fag-packet calculations all the way to zero LL-GHG (what Monckton calls NOGS) but not as dreadful a mistake as using them pro rata all the way down to absolute zero.
His back-of-fag-packet calculation should be saying that 8K LL GHG-forced warming results in 33K of warming at equilibrium, thus ECS = 1.1K x 33/8 = 4.5K, a value that is high but not entirely implausable.
A more sensible analysis would not consider that ECS is a constant value over such large temperature ranges. And there will be feedback mechanisms operating without LL GHGs being present. But they will bear no resemblance to the feedback mechanisms facing a world at 288K.
- The silver lining of fake news
dkeierleber at 03:27 AM on 30 August, 2018I think this is being oversimplified. It’s a complex issue. It is enticing to dismiss those who mistrust science as being uneducated on the subject. But that leads us to the same dead end of thinking all we have to do is tell the real facts and people will come around to the right way of thinking. Research doesn’t support that view.
As reported here in the past, regarding climate change, the more educated a conservative is the less likely they are to be persuaded by facts. Presentation of science facts drives deniers further into denial. So I don’t think the problem lies with denialist falsehoods. In my experience, climate change denialists are in love with the lamest over-simplifications. How often have you read the comment about how temperatures could have risen in the past if the cavemen had no SUVs to drive? Ever hear any denialist try to use Roy Spencer’s argument about natural variation tied to the Pacific multi-decadal oscillation?
Things are even worse on the economic front. Workers who have been profoundly hurt by supply side fiction insist that the wealthy pay too much in taxes. Educated upper middle class conservatives think the top tax rate in America’s Golden Age (the 2 decades after WWII) was 20%. Trying to explain the idea of a progressive tax to young conservatives shows how our education system has changed over the years. We were too distracted by defending evolution in public education to notice that the curricula on basic economic theory took a wrong turn somewhere. Now it seems the age old divide between property rights and majority rule is becoming an economic war and the rich are winning. That doesn’t bode well for the sanctity of our democracy.
Research has shown physical differences in brain patterns between conservatives and liberals. So part of the problem is that some of us tend to believe those in positions of authority while others tend to ask how they rose to that position.
- State of the climate: 2018 set to be fourth warmest year despite cooler start
One Planet Only Forever at 14:21 PM on 22 August, 2018Mal Adapted,
The likes of Roy Spencer could learn a lot from Sean Carroll's book "The Big Picture" published in 2016. It is an extensive presentation of the developed improved awareness and understanding of what is going on, including how the human mind works.
It was a NY Times Bestseller. However, it did have critics, mainly the angry group of evangelical purists that disliked the way that Carroll explains that our current understanding of what is going on in our Universe does not require an Intelligent Designer, and the way he effectively makes the case that it is unlikely that there is a God-being influencing what is going on.
So the likes of Spencer would not likely learn anything from reading Sean Carroll's book.
As you say, they have already decided not to be open to improved awareness and understanding. They deliberately limit their scientific methods and critical thinking to the defense of the limited worldview they have personally chosen to try to hold on to and defend.
Sadly, scientific investigation and critical thinking can be very harmful when it is applied by people who are not open to a holistic worldview (not liking the understanding presented by Sean Carroll), and who are focused on narrow-minded selfish interests (not interested in more altruistically helping to develop a sustainable better future for humanity).
More people need to develop improved awareness and understanding of what is really going on and strive to help develop a sustainable better future for all of humanity (all of the future generations), rather than seeking excuses for a sub-set of current day humanity getting away with an unsustainable activity that is undeniably harmful to future generations (and harmful to a significant portion of current day humanity).
- State of the climate: 2018 set to be fourth warmest year despite cooler start
Mal Adapted at 09:21 AM on 22 August, 2018nigelj:
According to wikipedia, Roy Spencer who compiles the UAH data is an agw climate change sceptic to some extent, and has strong religious fundamentalist views and has signed declarations that say our climate change is natural.
Well, Spencer signed An Evangelical Declaration on Global Warming, which states:
WHAT WE BELIEVE
We believe Earth and its ecosystems—created by God’s intelligent design and infinite power and sustained by His faithful providence —are robust, resilient, self-regulating, and self-correcting, admirably suited for human flourishing, and displaying His glory. Earth’s climate system is no exception. Recent global warming is one of many natural cycles of warming and cooling in geologic history....
WHAT WE DENY
We deny that Earth and its ecosystems are the fragile and unstable products of chance, and particularly that Earth’s climate system is vulnerable to dangerous alteration because of minuscule changes in atmospheric chemistry. Recent warming was neither abnormally large nor abnormally rapid. There is no convincing scientific evidence that human contribution to greenhouse gases is causing dangerous global warming....
Ellipses represent arguments from consequences, boiling down to "mitigation will harm poor people."
IOW, evidence be damned: AGW can't be a threat because God wouldn't allow it. By signing this document, Spencer has publicly announced his determination to fool himself, and IMHO has forfeited all scientific credibility thereby.
- State of the climate: 2018 set to be fourth warmest year despite cooler start
nigelj at 08:10 AM on 21 August, 2018The biggest difference seems to be between the UAH satellite temperature data and everything else particlualry the RSS data.
Its hard to see why there's such a difference between UAH and everything else. Why is Roy Spencer right and everyone else wrong? He would need a compelling reason, so what is it? Does anyone have technical knowledge on it?
According to wikipedia, Roy Spencer who compiles the UAH data is an agw climate change sceptic to some extent, and has strong religious fundamentalist views and has signed declarations that say our climate change is natural.
- It hasn't warmed since 1998
MA Rodger at 22:38 PM on 1 June, 2018guym @400,
I have long pondered the "hiatus" nonsense from contrarians. My take on it is perhaps more clinical than Eclectic @401, and a smidgen shorter.
One of the difficulties we face addessing the "hiatus" is that contrarians define the "hiatus" to mean vastly different things, from silly nonsense from Rose of the Daily Rail (Temp(Jan1996)=Temp(Aug2012) => global warming stopped 16 years ago) to more allegedly-grown-up versions comparing modeled & measured temperatures. Which ever version is used, their take-away is "Global Warming has stopped" or "Models are badly wrong". And any attempt to sensibly address the issue like in the AR5 Box 9.2 or for instance Hansen et al discussing the 'Global Warming Standstill' in 2012 results in a contrarian 'we told you so!!' response which is then grafted onto nonsense by even the more respected of contrarians to beat the "Global Warming Has Stopped!!!" drum (eg ex-clomatologist Judith Curry).
So you really do have to be careful when addressing the issue of the "hiatus" and that means more than using a title that calls it the "Hiatus in Global Mean Surface Warming of the Past 15 Years" as per AR5 Box9.2.
I think the AR5 Box9.2 use of OLS analysis over the period 1998-2012 was poorly contrived. (For the record, the resulting SAT trend roughly doubles if you use 1999-2012, to +0.09ºC/decade, instead of 1975-1996.) What was poor was firstly comparison of 1998-2012 with 1951-2012. The start period should have been roughly 1975, the start of the recent strong AGW. Contrarians who exaggerate the significance of the "hiatus" would be surprised to hear that if you compare 1975-1996 with 1975-2012 you get almost identical trends. The reason for 1998-2012 being so different from the longer-term SAT trend is because the 1998-2012 SAT trend relies on one of those reality-busting steps as in the SKS Escalator. So a second criticism of AR5 Box9.2 is giving credance to the 1998-2012 reality-busting OLS analysis.
Simply-put, anybody who (a) supports a "hiatus" 16-years long or (b) uses the "flatness" in surface temperature record to create a 16-year long "hiatus" by for instance saying "I predict we will see continuation of the ‘standstill’ in global average temperature for the next decade" (and good old Judy Curry manages both a & b) show they have departed from truthful analysis of AGW.
I myself feel the way to take command of the "hiatus" is by setting its true length. This analysis of HadCRUT data (usually 2 clicks to 'download your attachment') finds it was just 32 months long. And a message that must always be included in "hiatus" talk - thoroughout these years, AGW did not show any signs of faltering as the Ocean Heat Content data surely demonstrates.
- Climate Science Denial Explained
DPiepgrass at 16:24 PM on 16 April, 2018Unfortunately greenhouses (or hot cars) aren't ideal examples of the greenhouse effect, because a greenhouse works in part by trapping air so that it can't rise (and be replaced by cooler air that used to be higher in the atmosphere). The glass of a greenhouses also, incidentally, traps infrared radiation the same way greenhouse gases do, but it's easy for a pseudo-skeptic to point to the lack of convection and say "that's how a greenhouse really works - so the planetary greenhouse effect is a hoax."
If I catch someone denying the greenhouse effect, I just point out that most contrarian climate scientists (e.g. Roy Spencer, John Christy, Judith Curry) agree that the greenhouse effect exists. More learned pseudo-skeptics have all kinds of other arguments.
- 2017 was the hottest year on record without an El Niño, thanks to global warming
nigelj at 06:24 AM on 3 January, 2018I agree with OPOF that Roy Spencer doesn't give any real commentary on his climate website on el nino. Theres also not much the general issues of what temperature trends all mean. He has several sceptical views on climate science, although I don't know if he fits the denier category, but he sure seems to get close. His wikipedia profile is interesting.
RSS who also do temperature series for the troposphere, and give a much better discussion as below. However its important to realise the troposphere is not the surface, and the RSS people say its more important to look at nasa temerature trends which are at the surface. Roy Spencer makes no comment on such issues.
- 2017 was the hottest year on record without an El Niño, thanks to global warming
One Planet Only Forever at 04:54 AM on 3 January, 2018Dr. Roy Spencer's Blog Post "UAH Global Temperature Update for December, 2017:" further exposes that he is either:
- a deliberate deciever/denier, well aware of the unacceptability of what he is doing
- or someone who is not well aware or is lacking a good understanding of things
He states that: "2017 ended up being the 3rd warmest year in the satellite record for the globally-averaged lower troposphere, at +0.38 deg. C above the 1981-2010 average, behind 1st place 2016 with +0.51 deg. C, and 2nd place 1998 at +0.48 deg. C."
All of that is technically accurate. But he fails to make any mention of the influence of the ENSO cycle on the satellite data results; He fails to attempt to make people more aware and better understand what is going on.
If "Technocognition" proposed in the Guardian article "Fake news is a threat to humanity, but scientists may have a solution" (re-posted on SkS) does get traction, would it flag Dr. Roy Spencer?
- 2017 was the hottest year on record without an El Niño, thanks to global warming
One Planet Only Forever at 04:18 AM on 3 January, 2018I suggest expanding/changing the term "Climate Denial/Denier". That abbreviation is open to easy criticism. The intent is better described by "Denial/Denier of the developed and constantly improving awareness and understanding of climate science". If that fuller explanation seems too cumbersome, it can be stated once in an article followed by a harder to criticise abbreviation that is used in the balance of the item like: "...- Denial/Denier of Climate Science", or "...- Climate Science Denial/Denier".
Dr. Roy Spencer recently attempted to attack efforts to 'gain support for the awareness and understanding of climate science and the changes of human activity that it has exposed are required for humanity to develop a sustainable better future for all' by criticising some terms that have been used in that effort.
Dr. Roy's December 31, 2017 blog post "First Annual List of Banished Climate Change Terms" includes the term Climate Denier with the following criticism: "Climate Denier - How does one deny climate? Climate has always changed and always will. Maybe the intent is, “denier of catastrophic human-caused climate change”; if that’s the case, then I’m guilty as charged."
However, Dr. Roy exposes that he is either:
- a deliberate deciever/denier, well aware of the unacceptability of what he is doing
- or someone who is not well aware or is lacking a good understanding of things
because, in addition to abusing the term 'catastrophic human caused climate change' (used rather than being on his list of terms to banish), he uses the nothingburger term "nothingburger" as part of his feable rant against 'efforts to increase awaress and better understanding climate science and the changes of human activity that it has exposed are required for humanity to develop a sustainable better future for all'.
- There once was a polar bear – science vs the blogosphere
Matthew L at 02:18 AM on 2 December, 2017She has done meta-analysis on research data on polar bear numbers which is compelling, if not peer reviewed. As a medic I am well aware of the problems with peer review and the lack of replicated results, so I do not dismiss any paper just because it is not peer reviewed.
There is nothing to suggest that global numbers of polar bears have declined in the last 40 years and plenty to suggest that they have grown. It may be difficult to disentangle growth due to a reduction in hunting with decline due to a reduction in habitat. However, to date, the former effect has evidently been stronger than the latter, despite a steady decline in Arctic sea ice. You are disingenous in your statement that polar bears are listed as endangered. This was done to protect them from dangerous men with dangerous guns, not gradual sea ice decline.
From what I can gather, most of the time when an unbiased assesment is done on Arctic fauna the results tend to be less alarming than the initial press would suggest. For instance the recent Fish and Wildlife Service assesment of walrus populations as not endangered following "analysis of the best available scientific information".
https://www.fws.gov/alaska/fisheries/mmm/walrus/esa.htm
I do not know of Crockford's attitude on climate change, but as she is a highly qualified and published scientist who has worked extensively in the Arctic I very much doubt it is "anti-science" - any more than Judith Curry, Pielke Junior and Roy Spencer are "anti-science" or "deniers" (absolutely hate the use of that word). They are all highly qualified scientists in relevant fields of study who understand global warming and greenhouse gases but have come to a different view of the scientific evidence than taken on this blog - largely through empircal study and analysis rather than reliance on the wildly variable reuslts from General Circulation Models.
I am broadly on your side, fascinated by the science, but absolutely despair of the politics on both sides. The rampant and totally ludicrous millenial cult level alarmism (Manhatten under water by 2010, no Arctic ice by 2012, 5 million climate refugees by 2015 etc) in the press followed by ridiculous self justification and cognitive dissonance when the world does not end ("its worse than we thought!") just demolishes credibility . As for the "sky dragon slayers", I absolutely despair...
Blogs really are not the problem. The problem is that the uncertainties in the science are so huge (ECS between 1.5C and 4C per CO2 doubling according to IPCC) that it is quite possible to take a reasonable view at both ends of the spectrum. It would be better for sites such as this to climb down from the moral high ground and start looking at the effect that crying "wolf!" so often has on scientific credibility when the wolf does not appear.
- The Mail's censure shows which media outlets are biased on climate change
MA Rodger at 21:36 PM on 30 September, 2017nigelJ @39,
Note that within her spreading of doubt and denial about AGW, Curry is even happy to trash the temperature record. (This is perhaps odd as the temperature record is about the only thing she has to base her grand theory of there being a humongous natural climate wobble which has amplified the recent AGW over 1970-98 to create the present climate 'hysteria' with Wyatt's Unified Wave Theory being Judy's candidate for such an oscillation back in 2015.)Her stance in the temperature record is basically that 'there has been warming, but...' with the 'but' being followed by the buckets of doubt and denial. In many ways her comments about the temperature-record exemplifies her highly unscientific method. She will raises issues but almost always fails to set out clearly what she concludes from such issues. If she did, she would be slammed for promulgating serious denial with sky-high Monckton-ratings.
Consider her testemony about the temperature record in front of this 2015 Senate Committee:-
♠ Her citing of the hockeystick graph as showing "overall warming may have occurred for the past 300–400 years. Humans contributed little if anything to this early global warming," rather misrepresents the hockeystick. She is strongly suggesting that the possible 0.2ºC warming over a recent 300-year period (1600-1900) somehow brings into serious doubt the IPCC's attribution of the 1.2ºC warming since 1900.
♠ Her evidence on the relevance of the 'hiatus' never concludes. Rather it rambles on about "The growing discrepancy between climate model predictions and the observations", the raging debates over the recent Karl et al (2015), the 'hiatus' "clearly revealed" by satellite data (helpfully plotted by denialist Roy Spencer so the graph shows the now-superceded RSSv3.3 and the then-yet-to-be-released UAHv6.0 and with the RSS data re-based and curiously shorn of some of its maxs&mins and for good measure the graph stops short of the latest 2015 warmth), scientific disagreement over discrepancies between TLT & SAT records (and note where she stands on that with her oral testimony "we need to look at the satellite data. I mean, this is the best data that we have and is global"), convoluted statistical probability of 2015 becoming warmest-year-on-record, discrepancies amongst temperature data sets, a five years requirement to be sure the 'hiatus' has actually ended. It rambles on but the relevance of the 'hiatus', the message she is meant to be delivering, is never set out.
♠ Beyond her written testimony, Curry also expounds on SAT record adjustments, spreading yet more doubt:-"... And the adjustments, as you can see, are rather huge, OK?
So should we—so, to me, the error bars should really be much bigger if they are making such a large adjustment. So we really don’t know too much about what is going on in terms of, you know, it is a great deal of uncertainty. Yes, I do believe that we have overall been warming, but we have been warming for 200, maybe even 400 years, OK? And that is not caused by humans."After the digression onto the pet "warming for even 400 years,OK" Curry returns to adjustments but specifically ocean adjustments stating "I mean, the land datasets are sort of starting to agree, but there is a great deal of controversy and uncertainty right now in the treatment of the ocean temperatures." Poor Judy has failed to note that Chariman Cruz was asking for comment on USCHN data adjustments and her comment relevant to that data solely comprises "the land datasets are sort of starting to agree" and thus that the adjustments Cruz is complaining about are perfectly appropriate. Yet that is certainly not the take-away message she provides.
Curry gets away with talking this rubbish, even in written reports presented to a Senate Committe. She really should be taken to task for it.
- These are the best arguments from the 3% of climate scientist 'skeptics.' Really.
Inti at 03:20 AM on 28 September, 2017How does Roy Spencer reconcile raising his first point (trace gas) in the White paper with his blog article "Skeptical Arguments that Don’t Hold Water" from 2014?
http://www.drroyspencer.com/2014/04/skeptical-arguments-that-dont-hold-water/Spencer is pleading with fellow deniers not to embarrass themselves with these claims. The first 7 of his of 10 examples are various attempts to deny that CO2 causes warming:
1. There is no greenhouse effect.
2. The greenhouse effect violates the 2nd law of thermodynamics.
3. CO2 can’t cause warming because co2 emits IR as fast as it absorbs.
4. CO2 cools, not warms, the atmosphere.
5. Adding co2 to the atmosphere has no effect because the CO2 absorption bands are already 100% opaque.
6. Lower atmospheric warmth is due to the lapse rate/adiabatic compression.
7. Warming causes co2 to rise, not the other way aroundYet surely by posing the old "trace gas" nonsense he is making exactly the claim that "there is no greenhouse effect"?
Am I missing something, or is Spencer?
- Climate denial is like The Matrix; more Republicans are choosing the red pill
nigelj at 06:04 AM on 22 July, 2017Supak @6, the research you quote appears to be claiming adiabatic air pressure, analogous to compression, causes recent global warming.
They are wrong. Heres a good explanation from Dr Roy Spencer (of all people). I only have a very general sort of knowledge and memory of gas laws, but can get what they are saying.
www.drroyspencer.com/2016/07/the-warm-earth-greenhouse-effect-or-atmospheric-pressure/
- Surrendering to fear brought us climate change denial and President Trump
nigelj at 06:43 AM on 20 July, 2017Thoughts @38, with respect, you are entirely missing the point. Certainly some scientists deny climate science, including a very small number of climate scientists, and some other scientists.
But there's evidence that at least some of these people have various ulterior motives, rather than just purely scientific objections and this could extend to various fears, beliefs and vested interests that colour their conclusions on the science. I would suggest you will find the vast majority have these motives.
For example some sceptical climate scientists have been funded by fossil fuel lobbies like Willie Soon. Now are you seriously going to claim this doesn't alter their mindset? Of course it could, because these lobbies will expect a certain result.
www.theguardian.com/environment/2015/feb/21/climate-change-denier-willie-soon-funded-energy-industry
Roy Spencer is a sceptical scientist, and has strong religious convitions that "man couldn't fundamnentally destabilise" the planet. He also has strong libertarian political leanings so would definitely be suspicious of carbon taxes etc. Its perfectly reasonable to conclude these things colour his conclusions about the science to some extent.
en.wikipedia.org/wiki/Roy_Spencer_(scientist)#Climate_change
Richard Lindzen is a sceptic, and has expressed something very similar that the planet is self correcting. He also has or had interests in the coal industry.
Other sceptical scientists I have come across have strong fiscally conservative views, or libertarian leanings,and may be worried about government involvement or taxes. Its reasonable to think this could be a cause of their scepticism of the science.
I think you will find many sceptical scientists, probably most are influenced by a range of ideological issues, personal interests, and fears.
- James Powell is wrong about the 99.99% AGW consensus
DPiepgrass at 09:34 AM on 13 July, 2017I am curious who the four authors of 69,406 are that rejected AGW in peer-reviewed literature. Anyone know? I only know of 4 prominent contrarian climatologists – John Christy, Roy Spencer, Judith Curry, and Willie Soon – but only the first two are still publishing in the scientific literature AFAIK, and most likely Roy Spencer and John Christy would not attempt to publish something that explicitly rejects AGW.
- Models are unreliable
Tom Dayton at 11:40 AM on 27 June, 2017NorrisM, initially I'm going to assume you are who you claim to be, though the content of your post makes me suspicious--very suspicious--that you are one of SkepticalScience's fake-skeptic, trolling, chronic sock-puppeteers, and one in particular.
Your statement
The APS panel consisted of six (6) arm’s length physicists (with no axe to grind) chaired by Steve Koonin who were asking hard questions of both sides. What actually struck me as very astounding was how honest Koonin was about his previous lack of understanding as to how uncertain climate science is owing to the uncertainties underlying the climate models.
is incorrect. Steve Koonin is a notorious fake skeptic, who has both the background and the subsequent, repeatedly delivered, information to know that most of what he says and writes is factually and drastically incorrect. Christy has and continues to make claims that are factually incorrect, and is motivated primarily by political and religious beliefs. Christy's partner in crime is Roy Spencer, who is a member of the Cornwall Alliance that claims human-caused global warming is impossible because God promised Noah there would not be any more floods. Really. LIndzen's pet theory about the "iris" mechanism that self-regulates the Earth's temperature conclusively and repeatedly has been proven wrong (obviously, since Earth's temperature has varied drastically--Snowball Earth, ice ages,...) but that has had no effect on his opinion, and he very much resents and takes personally the criticisms. Curry once was an adequately productive climate scientist, but for reasons I won't speculate on here, has become quite the opposite.
- Claiming that Listerine alleviates cold symptoms is false: To repeat or not to repeat the myth during debunking?
nigelj at 07:53 AM on 24 June, 2017OPOF @7, what you say makes total sense if you are talking to a friend, or responding on a website. No need to restate the myth, so you just respond on whats really happening with temperatures (and this can also be a valid response to numerous myths)
I think the issue being described above is more relating to the media. It's hard for the media to respond to the latest myth doing the rounds in society, without actually stating what it is, and the logical place is to put the myth as the top of discussion. Avoiding being specific about the myth or burying it in the text is confusing for me.
However I agree about satellite data. A couple of additional things occur to me. If you are just a typical person and not a science expert and look at the UAH satellite data on Roy Spencers website, or over at RSS, the graph looks kind of flat compared to the surface data. This is partly because the vertical scale is simply a bit different I think. When you see the satellite data together with surface data on the same graph, there is much less difference. Of course the satellite data doesnt show as much warming since about 2005, but when seen together with the surface data even that difference is not as huge as it seems.
And the satellite data doesn't measure temperature directly. It extracts temperatures by measuring changes in the molecules that make up the atmosphere, and this is not as reliable as simple surface thermometer readings.
As you undoubtably know satellites also do not actually measure surface temperatures where we live, only the middle of the troposphere. But how many other people realise this?
- The day after withdrawing from Paris, Trump declared a flooding disaster in Missouri
nigelj at 12:17 PM on 7 June, 2017Eclectic @6, I don't understand why you would defend Ivar Gaiever. He is smart enough and highly qualified enough to know his claims were flippant and shallow.
Does he have a pre-existing emotional bias? I have a suggestion: He is currently a science advisor to the Heartland Institute. This suggests to me he sympathises with their entire dubious libertarian and ultra conservative, small government world view, as I cannot believe anyone would work for them, if they didn't share that basic world view. He does not appear the sort who would struggle to find work, given his credentials! Of course he is free to state what his world view is, if he thinks I'm being unfair.
I agree Lindzen is influenced by old testament beliefs. I wonder if Roy Spencer is as well, given things he has written.
So we have two things associated with climate denial, religious fundamentalism and free market economic fundamentalism. Now theres an interesting coincidence!
- Venus doesn't have a runaway greenhouse effect
Tom Curtis at 10:18 AM on 6 June, 2017MVW @216:
1) The runaway greenhouse effect is premised on two essential facts. First, increasing water vapour in the atmosphere, as with any GHG, decreases the total amount of Outgoing Longwave Radiation (OLR) for a given Global Mean Surface Temperature (GMST). Second, if OLR is less than the Net Incoming Solar Radiation (NISR), surface temperatures will increase. The way the runaway greenhouse effect works is that, for a given atmospheric pressure, and GMST, as surface temperature increases the amount of evaporated H2O increases at a sufficient rate that the OLR stays constant. Because it stays constant, the gap between OLR and NISR cannot be closed while this situation occurs, and the temperatures must keep on increasing.
Eventually, of course, if this situation arises, the oceans will boil dry. At that point, the gap between OLR and will still exist, but can begin to close. That is, the system is not in a state of equilibrium at that point, but can finally achieve it over the course of time. (Technically it does not achieve equilibrium, but quasi equilibrium, ie, equilibrium approximated over a short time period of at least a year, given that solar insolation is not constant throughout the year.)
2) Energy transfers within the atmosphere are not restricted to just radiation. Therefore a model of atmospheric temperature that relies solely on radiative energy transfers will not accurately estimate surface temperatures. This was first shown by Manabe and Strickler (1964), from whom this figure comes:
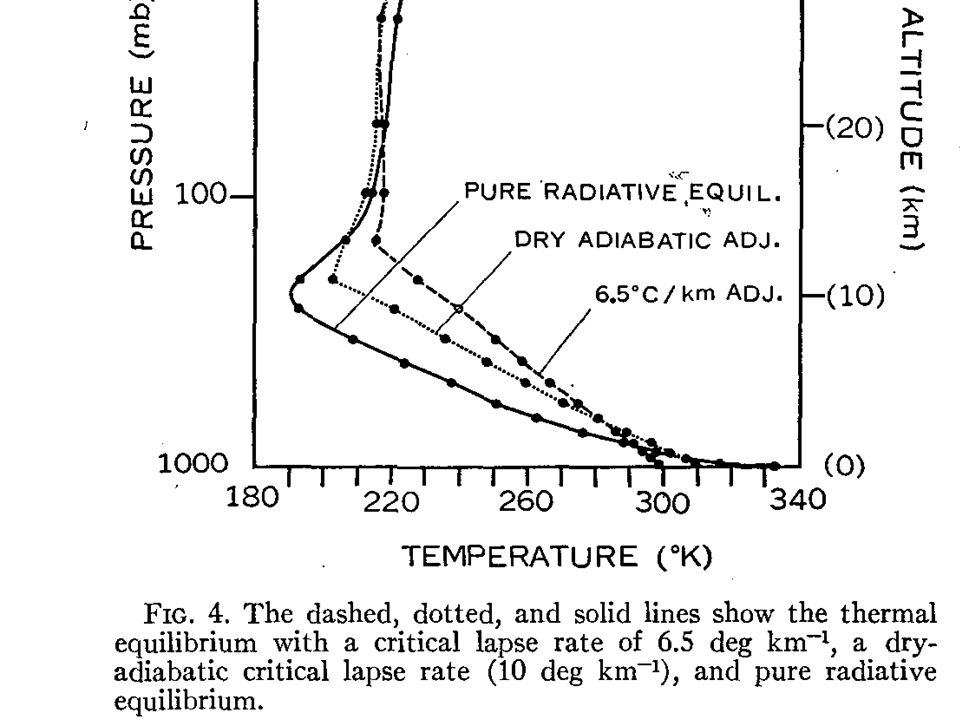
As you can see, using a simple, one dimensional model they showed that if radiative transfers within the atmosphere were the sole source of energy transfers, that would result in a much warmer surface temperature (approx 30oC warmer). For Earth, energy transfers by convection and latent heat need to be accounted for in addition to those by radiation. On Venus, because of the absence of water vapour, only energy transfers by convection and radiation need to be accounted for. In a full Global Circulation Model, lateral energy tranfers also need to be accounted for.
The temperature profile of Venus atmosphere has been modeled. As one example, here is a one dimensional model equivalent to that from Manabe and Strickler from Tomasko et al (1980):

For what it is worth, here is a 2017 paper on a full Venus GCM (pay wall for full paper), and a 2017 update on another full Venus GCM.
- Study: inspiring action on climate change is more complex than you might think
Eclectic at 10:40 AM on 21 May, 2017Factotum @3 , you may be right, about the role played by religious fundamentalism in fostering a science-denying attitude about the changes occurring in this planet. See Roy Spencer's strong leaning toward minimizing (in his mind) the amount of global warming going on. And the relatively high level of Christian fundamentalism in the USA has some correlation with the higher than world-average denialism among Americans. It would be a difficult matter to study statistically. For comparison, it would be interesting to see the relative amount of denialism among Christian fundamentalists in Mexico, South America, and perhaps Africa.
I suspect that a greater motivation, at least in the USA, is the anger felt by change-rejecting conservatives — combined with right-wing rejection of governmental regulations, plus ordinary selfishness & lack of compassion for others (especially foreigners).
It is not just Christian fundamentalist theology having a hand. Take for example the (non-Christian) Richard Lindzen who also expresses a belief that this world is a Divine creation, formed as a mechanism which is self-correcting : and which cannot slide into a condition which is unfit for mankind. Presumably this reflects his Old Testament upbringing. [ I am unaware of the degree of denialism in Israel. ]
However, there may also be many people whose thinking is influenced by some amount of "non-religious spiritualism" or subconscious worshipping of an idealized Mother Nature.
Of course, all these factors could be: Horses harnessed together and pulling in the same direction.
- New publication: Does it matter if the consensus on anthropogenic global warming is 97% or 99.99%?
knaugle at 00:38 AM on 5 May, 2017Most of the time when I look into this, at a purely amateur level, I find that there are maybe 80 really active, publishing climate scientists. From this list, I can count less than a handfull of scientists whom I know are critical of AGW. Roy Spencer, John Christy, and Judith Curry come to mind. Interestingly Curry has retired and so is no longer on my list. As is the case with Richard Lindzen and William Gray, and for that matter Christopher Moncton and Fred Singer (who aren't really climate scientists) it seems the most ardent "deniers" are getting really old and I'm not seeing their replacements. The eternal problem of being a contrarian is always that while you might be right, it is really hard to convince anyone.
- Yes, we can do 'sound' climate science even though it's projecting the future
ubrew12 at 01:46 AM on 20 April, 2017Lamar Smith: "Anyone stating what the climate will be... at the end of the century is not credible" Then Chairman Smith is not credible, since the argument for doing nothing about fossil emissions is based on a prediction that climate in 2100 will be unaffected by it. This 'pushback' argument is not made often enough: the 'do nothing' alternative is still a course of action based on a prediction (that despite doing nothing, everything will be OK). On what is that prediction based? History? Intuition? Madam Costanza's crystal ball? No rational course of action, or inaction, is made without an estimate of its future impact. Since all courses of action, or inaction, require such future predictions, why are only the predictions of the climate scientists being questioned?
Deniers, when questioned on this, will often appeal to history: 'climate has always changed naturally over the course of Earth's history'. This is a non sequitor: if Smith shot his neighbors dog, his defense can't rest on the observation that most dogs throughout history died naturally. Besides: name something that hasn't changed naturally over the course of Earth's history.
Rarely, deniers will reveal something closer to the heart of their objection, as when Dr. Roy Spencer said "Earth and its ecosystems — created by God’s intelligent design and infinite power and sustained by His faithful providence — are robust, resilient, self-regulating, and self-correcting, admirably suited for human flourishing, and displaying His glory." So, that's a prediction of future climate based on 'Everything is going to be OK, because God told me so'. Personally, I prefer Madam Costanza's crystal ball.
- Just who are these 300 'scientists' telling Trump to burn the climate?
Nick Palmer at 00:31 AM on 2 March, 2017I thought I'd see how many of the usual suspects were in it. Interestingly, I didn't find Christy or Peiser in there...
ABDUSSAMATOV, Habibullo Ismailovich
ANDERSON, Charles R
BALL, Tim
BARTLETT, David
BASTARDI, Joseph
BELL, Larry S
BOEHMER-CHRISTIANSEN, Sonja A
BRIGGS William M.
D'ALEO, Joseph S.
DOUGLASS JR.
DYSON, Freeman
EASTERBROOK, Donald J.
EVANS, David M. W.
HAPPER, William
HUMLUM, Ole
IDSO, Craig
LEGATES, David R.
LINDZEN, Richard
MANUEL, Oliver K.
MISKOLCZI, Ferenc Mark
MOCKTON, Christopher
MOORE, Patrick
MORNER, Nils-Axel
MOTL, Lubos
SCHMITT, Harrison H.
SINGER, Fred S.
SOON, Willie
SPENCER, Roy W.
WHITEHEAD, David - Correcting Warren Meyer on Forbes
Tom Curtis at 12:13 PM on 21 February, 2017"One more error is, he claims Al Gore states that, "...we will see a tipping point where temperatures will run away, [Gore] is positing that feedbacks will be nearly infinite (a phenomenon we can hear with loud feedback screeches from a microphone)." Nope. Sorry. That is Mr. Meyer's misunderstanding and is nothing that Al Gore has ever stated."
I did a bit of research and managed to find the source for Al Gore's claims about "tipping-points". It turns out to be a conflation of a comment Gore made to CBS news in 2006, and a review of An Inconvenient Truth, by James Hansen.
CBS reported on January 26th, 2006 that:
"And politicians and corporations have been ignoring the issue for decades, to the point that unless drastic measures to reduce greenhouse gases are taken within the next 10 years, the world will reach a point of no return, Gore said.
He sees the situation as "a true planetary emergency.""
You will notice that while the sentiment is Gore's, the initial sentence contains no quotations, and hence no indication that the term "point of no return" was Gore's.
Meanwhile, in his review of "An Inconvenient Truth", Hansen expressed similar views when he wrote:
"Any responsible assessment of environmental impact must conclude that further global warming exceeding two degrees Fahrenheit will be dangerous. Yet because of the global warming already bound to take place as a result of the continuing long-term effects of greenhouse gases and the energy systems now in use, the two-degree Fahrenheit limit will be exceeded unless a change in direction can begin during the current decade. Unless this fact is widely communicated, and decision-makers are responsive, it will soon be impossible to avoid climate change with far-ranging undesirable consequences. We have reached a critical tipping point."
In January, 2016, Anthony Watts published an article by Jaclyn Schiff, which quoted the NBC article, before saying:
"Well, the 10 years are about up, by now, warming should have reached “planetary emergency levels” Let’s look at the data:
...
As you can see, little has changed since 2006. Note the spike in 1998, in the 18 years since the great El Niño of 97/98, that hasn’t been matched, and the current one we are in isn’t stronger, and looks to be on the way to decaying. So much for the “monster” El Niño."
In the space covered by the ellipsis, Schiff published a graph of the UAH TLT temperature through to Nov 2015. Why November, given that the Dec 2016 data was published by Roy Spencer on January 5th, 2016. Perhaps it had something to do with the December values being higher than those of October, hence giving the lie to the claim that the temperatures "looks to be on the way to decaying". Regardless, hindsight shows her claims to be utterly baseless:
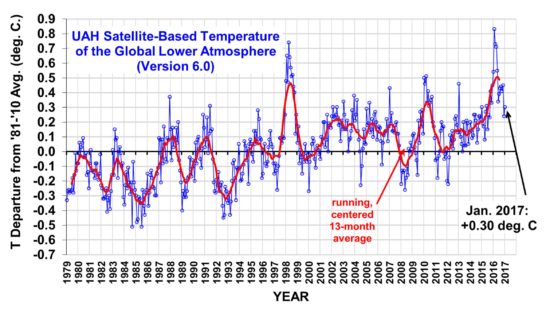
Indeed, so also did foresight for anybody aware of the relative delays of surface and mid troposphere temperature responses to ENSO fluctuations.
More important than any shenanigans with out of date temperature data is the complete misunderstanding of what Gore is reputed to have said.
Going back to the original NBC metaphore, a point of no return is that point in a flight, or expedition, were turning around will not leave you with sufficient fuel (or supplies) to return to base. It could also be used of a scenario where you are driving rapidly towards the lip of the Grand Canyon, in which case the point of no return is that point at which no amount of braking, or rapidity of turning will prevent you from going over the lip. In neither case is there any sudden change in your conditions. The point of no return on a flight is not a point of sudden turbulence; and the point of no return as you follow Thelma and Louis to a premature death is as smooth as any other point you had traversed on the trip thus far.
Applying this to Gore's thought, clearly he was saying (whether using that phrase or not) that if radical action was not taken by (approximately) 2016, then we would have reached a point where no economically achievable measures could prevent CO2 concentrations rising sufficiently to cause temperatures to pass the threshold beyond which their impacts are considered dangerous. No sudden jump in temperature is predicted, and nor is it predicted that the temperature increase by 2016 will itself have passed a dangerous threshold.
In any event, Schiff's misunderstanding was then picked up by the deniasphere, with Hansen's term frequently substituted. From there, it was apparently further misinterpreted by Warren Myer.
Ignoring the gross misrepresentations without which deniers have no argument, the question is whether or not we have in fact passed Gore's 'point of no return', or Hansen's "tipping point". The answer is that we do not know. We may have, and if we have not we certainly will do so soon. My feeling is that we have for a 1.5oC increase above the preindustrial, but not quite yet for a 2oC threshold. Unfortunately, whether we have or have not passed it, the actions of Trump in the US, and Turnbull in Australia seem geared to ensure we pass it very soon, if we have not already.
- 2nd law of thermodynamics contradicts greenhouse theory
Tom Curtis at 22:27 PM on 19 February, 2017MA Rodger @1489, the energy balance diagram only shows energy movement between realms - ie, from the surface to the atmosphere, or from the atmosphere to the surface. It does not show energy transfer within the atmosphere itself. For that reason, the figure is not a good guide for estimated what Global Mean Surface Temperature (GMST) would be like in the absence of convection.
A better guide is Fig 4 from Manabe and Strickler (1964):
As you can see, from their model, an absence of latent heat transfer (ie, dry-adiabatic lapse rate) would lift GMST by about 10oC, while the complete absence of convection would lift it by about 45oC relative to current conditions. As the greenhouse effect on Earth raises GMST by over 33oC, the presence of convection cools the Earth by over 50% of the temperature increase that would occur from a greenhouse effect without convection.
Eliminating latent heat transfer within the atmosphere by the condensation of water would eliminate just under 25% of the greenhouse effect coupled with convection. That is an esoteric figure, however, given that 75% of the greenhouse effect is from water vapour and clouds. Consequently the combined effect (greenhouse and lapse rate) of water vapour in the atmosphere is to warm the Earth; although at a lower GMST it might be to cool it given the reduced greenhouse effect but near constant cloud albedo effect.
- 2017 SkS Weekly Climate Change & Global Warming Digest #3
One Planet Only Forever at 09:08 AM on 23 January, 2017The Graphic of the Week appears to be a "Cherry-picked" way of analysing and presenting the data. It seems to have been done in order to claim the warming has just about reached 1.5 C. That is unnecessarily Alarmist.
I struggle to see a scientific reason for evaluating the temperatures the way they have been evaluated.
However, I also consider it far more meaningful to present a graph of a running 10 year average (a new point for each new month, not even having to wait for a calendar year to end) than showing straight lines of the average over each Decade. The use of the 10 year bar leads to arguments that we need to wait for the next 10 years of data to be collected before anything can be concluded.
I also think that a running 12 month average is also a more meaningful presentation of what is going on than waiting until the December numbers are in to declare how much warmer a 12 month period has been.
I would think that a clearer and more comprehensive presentation would be the running 12-month average through the past 137 years of data. It would highlight what needs to be highlighted about how warm the planet is becoming even though the maximum value would not have been as close to 1.5 C. And lines for the running 10-year average and 30-year average should also be shown to highlight the trend of the temperatures.
And the same should be done for the satellite data. The 9 year length of the 30 year average in the satellite data would be good for people to see, because though it is short it is undeniably climbing. And it would raise the valid question of why the likes of Dr. Roy Spencer prefer to show a 13 month average on the satellite data.
- Models are unreliable
sailingfree at 02:15 AM on 10 December, 2016Spencer now shows Cornbelt data, and "42 CMIP5 models.
http://www.drroyspencer.com/wp-content/uploads/Corn-belt-temp-JJA-thru-2016-vs-42-CMIP5-models-1.jpg
He implies that the CMIP5 projections are for the cornbelt.
Is this true?
(In my local newspaper I clash with Joe D'Aleo's misiformation, can use help.)
- Trump and the GOP may be trying to kneecap climate research
MA Rodger at 02:18 AM on 8 December, 2016Moderator @ 29,
There are of course two UAH TLT records as well as RSS TLT.
The v6.0beta5 (which is not yet released so shouldn't be in use) has an annual cycle with an average well below freezing so the annual averages will also be below freezing. I calculate Dec15 to Nov16 at -8.67ºC. (Note, the value presented by the commenter is only a couple of fat fingers away from this value.)
RSS TLT would have similar anomaly values. UAH TLTv5.6 has a lower average altitude (about 2km lower) so should have an average above freezing but the +8.77ºC could be a bit high. I've never seen its absolute values quoted for UAHv5.6.
- Trump and the GOP may be trying to kneecap climate research
john warner at 14:31 PM on 2 December, 2016The scientific explanation of carbon dioxide radiative forcing is easy to understand. With the analytic application of this understanding I can prove that the exaggerated claims of the global warming advocates fail the scrutiny of reason by the weight of their own silliness. The best way to access the IP addresses I am providing is to copy the address and paste it into the Browser IP address row and press enter. Then print the document for future reference. (snip) To return to the Moraleconomist Web Blog click x on the file folder you are viewing.
This is the IP address for the concentration of carbon dioxide in the atmosphere. [mod. - This is not an IP, it's a url.]
ftp://aftp.cmdl.noaa.gov/products/trends/co2/co2_annmean_mlo.txt
In 1979 NASA began using satellites to measure the earth’s average annual global air temperature. [mod. - Not exactly...] For the purpose of evaluating the validity of the global warming hypothesis [mod. - Needs a citation.] I prefer to use this period of the earth's air temperature record. The growth rate of carbon dioxide from 1979 to 2015 is 1.7892ppm per year. [mod. - Needs citation.]
This is the IP address [mod. - URL] for the Intergovernmental Panel on Climate Change, Third Assessment Report, Climate Change 2001: The Scientific Basis, Table of Contents.
http://www.grida.no/publications/other/ipcc_tar/?src=/climate/ipcc_tar/wg1/
Click on chapter 6 and scroll down to table 6.2. From the first equation C/Co, Co is 400.83 in 2015. Extrapolating the current growth rate [mod. - You can't do a straight linear projection.] to 2115 yields C equal to 579.75, (400.83+178.92= 579.75). (579.75/400.83=1.4463738) The natural log of this growth rate is 0.3690595. Multiplying the natural log times 5.35 yields 1.97wpsm. This is the most likely scientific prediction for a 100 year increase in carbon dioxide radiative forcing [mod. - No it's not. Pleaser refer to the Representative Concentration Pathways data for accurate figures.]. Before you thoughtlessly dismiss this go back to the TAR and go to table 6.1 and notice that between 1750 and 1998, 248 years, radiative forcing by carbon dioxide only increased 1.46wpsm. You can verify this with a scientific calculator by calculating the ratio of 365/278, taking the natural log and multiplying by 5.35. You can also calculate the 265 year increase in carbon dioxide radiative forcing, 1.96wpsm, by evaluating the ratio 400.83/278.
This is the IP address [mod. - URL] for NASA’s 2010 Earth Energy Budget based on the 10 year Climate and Earth Radiation System experiment.
http://science-edu.larc.nasa.gov/energy_budget/pdf/Energy_Budget_Litho_10year.pdf
The first thing to note is that there is no greenhouse gas radiative forcing quantity [mod. - Yes there is. Right there on the first page of your URL link.]. It is 17.9wpsm. This is a 33.4wpsm decrease from NASA’s 1998 Solar Energy Budget estimate of 51.3wpam. [mod. - citation needed.] The water vapor component was reduced 75%. [mod. - citation needed.] The well mixed greenhouse gases component was reduced 25%.[mod. - citation needed.] Therefore the most likely prediction is reduced to 1.48wpsm.
Notice also that the surface air temperature radiates 358.2wpsm. Google the Free Stefan-Boltzmann Law Calculator. Enter 1 for e and A. Enter 358.2 for P and x for T. Click calculate. T equals 281.93 degrees Kelvin. Adding 1.48wpsm to 358.2wpsm equals 359.68wpsm. Now enter 359.68 for P and x for T. T equals 282.22 degrees Kelvin. The difference, (282.22-281.93=0.29), is 0.29 degrees Kelvin per century. That is also 0.0029 degrees Kelvin per year.
This is the IP address [mod. - URL.] for Dr. Roy Spencer's Web Site. Click on Latest Global Temp. Anomalies.
http://www.drroyspencer.com/
This is the gold standard of temperature records [mod. - No, it's not.] for analytically evaluating the validity of the global warming hypothesis [mod. - Go chat with Roy, he'll tell you that you're wrong in your hypothesis here]. Notice the range of variability of the monthly data, 1.35 degrees Kelvin. Even more important for our purpose notice the 13 month running average temperature. Between July 2011 and April 2016 [mod. - why 13 months and not 12?.] this temperature went up 0.5 degrees Kelvin. Multiplying 4.75 years times 0.0029 degrees Kelvin per year yields 0.014 degrees Kelvin. The temperature went up 35 times more than the 4.75 years of carbon dioxide growth can explain [mod. - No one claims that CO2 and temperature are expected to operate in lockstep.]. Also notice every time the temperature goes down none of that variations is explained by carbon dioxide because [mod. - because, because, because....] annual average levels of carbon dioxide never go down [mod. - Technically wrong, but again, no one expects that CO2 and temperature will operate in lockstep.]. To credit carbon dioxide with average annual global air temperature changes is silly on its face compared to the other natural forces controlling earth’s air temperature. [mod. - Please quantify these other radiative forcings in relation to GHG forcing.]
From the IPCC Third Assessment Report [mod. - URL.] on Climate Change 2001 1st footnote from page 5 Summary for Policy Makers 1...
http://www.grida.no/publications/other/ipcc_tar/?src=/climate/ipcc_tar/wg1/fnspm.htm#1
"Climate change in IPCC usage refers to any change in climate over time, whether due to natural variability or as a result of human activity. This usage differs from that in the Framework Convention on Climate Change, where climate change refers to a change of climate that is attributed directly or indirectly to human activity that alters the composition of the global atmosphere and that is in addition to natural climate variability observed over comparable time periods.
The TAR could not prove that human activity [mod. - "proof" is a mathematical term and can't be applied to theories] caused global warming and they could not use the more ambiguous phrase, “climate change,” because of the definition adopted by the Framework Convention in 1992 [mod. - You've profoundly misinterpreted the passage you pasted above.]. In order to be semantically correct they had to redefine their definition of “climate change” to include naturally caused variability. Since the IPCC, the world’s leading scientific global warming authority[mod. - Weird claim.], secretly [mod. - Please read the terms of commenting on SkS again.] changed the definition in 2001 the global warming advocates believe they are not lying when they use, “climate change,” to refer to naturally caused climate change but the general public hears the lie that the changes are being caused by human activity. [mod. - Statements like these generally get commenters banned at SkS. You're on thin ice.]
The IP address [mod. - URL.] for the earth’s annual absolute temperature cycle [mod. - Really?.] is:
https://ghrc.nsstc.nasa.gov/amsutemps/amsutemps.pl
Scroll down until you see the colored years. Select near surface temperatures channel 4, degrees Kelvin, and year 2006. Notice that for January the temperature is 258 degrees Kelvin and for July the temperature is 261 degrees Kelvin. When the earth is closest to the sun the earth air is 3 degrees Kelvin colder.
The IP address [mod. - URL.] for Earth Orbit — Wikipedia is:
http://en.wikipedia.org/wiki/Earth%27s_orbit
Notice in the second paragraph under the heading Events in orbit the following sentence. “The changing Earth-Sun distance results in an increase of about 6.9% (footnote 8) in total solar energy reaching the Earth at perihelion relative to aphelion.” Next scroll down to the table labeled Orbital Characteristics. The earth’s aphelion is 94.51 million miles from the sun and the perihelion is 91.40 million miles from the sun. The ratio is 1.034. Because of the inverse square rule the solar radiation power per area at the perihelion is 1.069 times higher than at the aphelion. 1.034 squared equals 1.069. (0.069*340.4wpsm=23.5wpsm) The difference in solar radiative forcing between July and January is +23.5wpsm and the earth’s air is 3 degrees Kelvin colder.
The earth’s air mitigates a 23.5 watts per square meter annual solar radiative forcing cycle [mod. - citation needed.] but according to the global warming advocates theory, it can’t mitigate a 1.48 watts per square meter [mod. - citation needed.] increase in radiative forcing from a 100 year increase in carbon dioxide [mod. - citation needed.]. On January, fifth, the solar radiation on the earth is 353.75 watts per square meter. On July, fifth, the solar radiation is 330.25wpsm. When the sun’s radiation power per area is 23.5wpsm greater the earth’s air temperature is 3 degrees Kelvin colder. The global warming activists don’t care enough about science to realize that there are very powerful natural physical mechanisms that mitigate earth’s air temperature during its elliptical path around the sun [mod. - called the greenhouse effect.]. The annual increase in radiative forcing due to carbon dioxide growth is 1,588 times smaller [mod. - citation needed.] than the amplitude of the annual solar radiation power cycle, (23.5/0.0148=1,588) [mod. - citation needed.] Yet the global warming theory public policy advocates do not feel the necessity to explain why these same powerful natural physical mechanisms can’t also mitigate such a small determinant of the earth’s air temperature. These physical forces of nature are called: cloud albedo, radiating to space as a function of air temperature raised to the fourth power, reduction in conduction as the temperature difference between earth’s surface and surface air gets smaller and ocean sequestration of heat.
Another global warming lie we can expose here is that their public policy advocates say it takes 40 to 100 years for the earth’s air temperature to adjust to a change in radiative forcing due to carbon dioxide growth. But how long does it take to adjust to daily changes in solar radiative forcing. Notice that from NASA.s annual temperature cycle graph that as the earth begins to move away from the sun on January, Fifth, the earth’s air temperature begins to increase within two weeks. This means the earth’s air temperature regulating mechanisms are already increasing radiative forcing faster than the sun's radiative forcing is decreasing.
This is an invitation to a, Frank Knight type, free discussion of reasonable men to discover whatever truth emerges that we can agree upon.
[mod. - (sigh).]
- Global weirding with Katharine Hayhoe: Episode 1
michael sweet at 05:12 AM on 1 October, 2016Red Baron,
According to Gallop polls, 40% of Americans are young earthers. That includes the UAH scientist Roy Spencer. Please provide a citation to support your claim that young earthers are uncommon in the USA.
- There's no correlation between CO2 and temperature
Tom Curtis at 21:58 PM on 21 August, 2016victorag @87:
"A great many skeptics are in fact climate scientists..."
Passing over the assumption that "skeptics" are in fact skeptical, rather dogmatically oppositional, surely you have mistated your position. First, and this should be very clear from any excursion to WUWT, the vast majority of "skeptics" have neither qualifications in, nor understanding of climate science. Saying that a "great many skeptics are in fact climate scientists", ie, that a large proportion of the class "AGW skeptic" are also members of the class "climate scientist" is absurd.
I assume you merely mispoke, and intended to say that "a great many climate scientists are 'skeptics'". Even there you are on very shaky ground. Based on surveys of climate scientists, at most 15% and more likely << 10% of climate scientists hold a "skeptical" position on AGW. Among publishing climate scientists, by self assessment only 2.4% of climate scientists thought there published work rejected AGW (see Table 4). So, at best, a very small minority of climates scientists are "skeptics" - sufficiently small that their views cannot be taken as representative of climate science.
And even among the small number of climate scientists who are "skeptics", in most cases there exist clear evidence that suggests they are biased, ie, that they hold their "scientific" opinions for reasons that are primarilly political or religious. A significant proportion of them, for instance, are employed by right wing political think tanks, or have published for or spoken at conferences for such think tanks. Indeed, one of the most noteworthy "skeptical" climate scientists has declared that, "I view my job a little like a legislator, supported by the taxpayer, to protect the interests of the taxpayer and to minimize the role of government", a declaration tantamount to saying that as a matter of principle he will distort the science for political ends.
"However, we must recognize that, as far as science is concerned, there is an asymmetric relation between someone who offers an hypothesis and someone who critiques it. The burden of proof is on the person offering the theory, not the critic."
My criticism of the "skeptic's" discussion of the "pause" was that they incorrectly stated the predictions of AGW, and that the responses that you considered to be akin to cherry picking merely established what AGW actually predicted over the relevant interval, and thereby showed that the actual temperature records followed what was expected from the theory. Given that I am flabberghasted by your response. Do you really intend to assert that critics of a theory may assert any phenomenon to be contrary to the predictions of the theory they criticize with no burden of intellectual rigour placed on them to establish that fact? Seriously? If so, your use of a "burden of proof" argument amounts to intellectual legerdemain - a piece of rhetorical prestidigitation that allows you to declare circles are squares and darkness to be light. Even if the " ...burden of proof is on the person offering the theory", that would be completely irrelevant to the case under discussion.
As it happens, even in more general contexts, your principle is useless. That is because, logically, the claim that "GMST did not follow the predicted path given AGW" is also a theory. If a burden of proof applies to those proposing theories, than a proponent of this view has a burden of proof to demonstrate to things, ie, the predicted GMST temperature trend given AGW; and that GMST did not follow that path.
You attempt to support your dictum with a quote @90 from comuter scientist, Stephen Minhinnick. Event there, however, you go awry. Stephin Minhinnick's argume (which I do not accept in any event) specifically relates to the proposition of entities, and the ontologies of climate scientists and (at least well informed) "skeptics" is the same, at least as regards the climate. Neither proposes a distinct set of entities, be it form of radiation, or unusual subatomic particles, or whatever. The only way that you can take Minhinnick's argument to be relevant is if we count abstractions such as trends as being entities. But if we do that, it is the AGW "skeptics" who are proposing an additional entitity. Specifically, AGW proponents propose an underlying linear trend over the period 1975-1997 which continues thereafter, while the "skeptics" propose the existence of a new trend from 1998 onwards. And on that basis, they have singularly failed the burden of proof of showing a new underlyng trend.
"To be perfectly clear: the theory in question is the theory that CO2 emissions due to the burning of fossil fuels have been warming the earth steadily over a long time period and as a result placing the world in grave danger. The so-called "hiatus" is an attempt to refute this theory by calling attention to a certain body of data that seems inconsistent with it. Promoters of the hiatus need not offer a counter-theory. All they need to do is demonstrate a serious inconsistency in the "climate change" theory."
(My emphasis)
And now, apparently, we are in aggreement, except you exempt the "skeptics" from actually having to make the demonstration of inconsistency, which requires not only demonstrating the post 1998 temperature record, but also demonstrating the actual prediction of AGW (not just the projections). And once again, demonstrating that the "skeptics" have not undertaken their task with any intellectual rigour is not akin to cherry picking.
"The most recent "pause buster," by Karl et al., adjusted the data in such a way as to render literally all these studies superfluous, which should have been a huge embarrassment to the mainstream climate science world, but has on the contraty been accepted with enthusiasm simply because it appears to do the job more convincingly."
First, and most obviously, Karl et al discusses just one temperature data set, and therefore cannot render analyses of other datasets superfluos. Second, you are not entitled to assume that a reworking of (for example), Foster and Rahmstorf using the latest temperature products would not show an accelerating temperature trend. All you can say from the update of the temperature series is that the former studies are not dated, not that they are superfluos (ie, that repeating the studies would not impact our understanding, or demonstrate any underlying trend greater than the revised temperature trends from Karl et al). Again your argument suggest to me rhetorical legerdemain. You appear to imply that because the "skeptic" rhetoric regarding the purported "pause" has been refuted multiple times, and in several different ways, that of itself refutes the multiple refutations. It is only conspiracy theorests and pseudoscientists who think there theory is confirmed by the mounting of evidence against it.
- Climate Bet for Charity, 2016 Update
Tom Curtis at 09:25 AM on 4 August, 2016Rob Honeycutt @9, the data used is the average of the RSS TLT (anomaly interval of 1979-1998) and UAH TLT (anomaly interval of 1981-2010). Because of the recent anomaly intervals, negative values are still possible with a strong enough La Nina (as happened in 2008) or volcano. Moreover, it is not clear that KT is projecting negative values, as five to six months of near zero values would bring about a cross over with the red line.
I think it is fairer to say that his comment is likely to be optimistic because it is consistent with his global warming skepticism. A La Nina as strong as that in 2008 would now result in a slowly rising trend rather than a flat or negative trend due to the increased underlying temperature in the interval.
On a side note, I presume the use of the most recent version of UAH (v6 Beta) is consistent with the terms of the bet. In that case the likely update of the RSS TLT inline with current update of the TTT and TMT products to version 4 will also be required by the terms of the bet before the bet is due. As that update resulted in a significant increase in the warming trend in the TTT and TMT products, it is also likely to do so in the TLT product, thereby increasing the overall trend (just as the update to UAH v6 will have decreased it). Given that, and given the decrease in the 2001-2010 cumulative sum in 2008 makes the "skeptic" side of the bet a poor one from the current outlook.
- These are the best arguments from the 3% of climate scientist 'skeptics.' Really.
MA Rodger at 09:06 AM on 26 July, 2016A very short way into reading 'A Guide to UnderstandingGlobal Temperature Data' by Roy W. Spencer, Ph.D. I start to question whether Roy Warren Spencer, Ph.D. is truly the author. I know the second page has a paragraph titled "About the Author" which provides a biog for Roy Spencer but, thinks, the rest of this booklet is so well packed with dubious nonsense, should we not ask whether the authorship it ascribes to itself is also dubious nonsense.
My actual reason for questioning the authorship is based simply on a quick reading of a couple of the sections. As such my conclusion is prelimenary. My initial take on this booklet is that, as I have read a lot of drivel from Spencer in the past, the content of this booklet, the narrative, its structure, its argumentation, its vocabulary - it does not read like the same Roy Spencer!!
Anybody else having similar thoughts?
- Over 31,000 scientists signed the OISM Petition Project
jmcookie at 11:42 AM on 13 July, 2016I've been following the climate change issue for some time and although This petition does not hide their academic degree list of signatories or their fundamental argument against AGW. They do have peer reviewed research papers giving details if anyone that reads this site is actually interested. I'm not a climate scientist I watch a lot of the skeptics like Dr Roy Spencer and John Christy who seem very well informed. I've never watched a NASA climate scientist speak out so I checked and I found that NASA is a executive government agency and the climate scientists are told to NOT discuss their views publicly (so we actually don't know how many NASA scientists are skeptics). I've also watched a lot of deceit and data manipulation from major players like IPCC (Climategate) and NAOO (2015 data manipulation). I’ve read these reports and I think all this is common knowledge as these events are in Wikipedia if references are necessary.
- Venus doesn't have a runaway greenhouse effect
scaddenp at 07:32 AM on 17 June, 2016Gee, I am surprised this rubbish keeps coming up, when it was laughed at even in "skeptic" circles. You might like to read what Roy Spencer has to say on the subject as I suspect you would trust that source rather than "warmistas" here or say physics textbooks. This has come up here before and even our friend Camburn wouldnt buy it. If you think this is plausible, then I think he has a bridge he would like to sell you.
- It's cooling
sam at 17:33 PM on 21 May, 2016You mentioned SE asia earlier and according to your source, 'on the average, hot record broke, etc.' I will take your sources with a grain of salt if you don't mind but that's irrelivant. Mini-ice age conditions like 1816 are characterized by winter conditions that arrive when they are not supposed to be there, like May or September, and it is in that way that they ravage crop production. You mentioned SE Asia earlier and that there were hot records broke and a high average etc. But if you look up at my list:
March 2016: Vietnam had 1 foot of snow 300km south of hanoi.
This is interesting because March,April is SE asia's summer-it is when the sun is directly over that region, so that is 1 foot of snow-in the summer-in the tropics,deep in the tropics.. Thailand was also hit by that cold spell leaving everyone scratching their heads as to what was going on.
We do not have an accurate record of exact specific temps from the previous MIA period, we just know from the history books what the weather patterns were.. maybe some records were broke or are these averages or records being influenced by localized heat island effect from human activity..that's your ongoing debate with skeptic scientists- Roy Spencer [
http://www.foxnews.com/science/2013/01/10/hottest-year-ever-skeptics-question-revisions-to-climate-data/ ] or whoever, WUWT people..admittedly that debate is beyond me, to study and pik that stuff apart is beyond my comprehension.. admittedly maybe you are right about that but anyone who has looked at this issue even in passing; can see that endless debate; i think its your comfort zone to make that argument; but that's not my argument.. Is it normal to have snow in the middle of May snow in the tropics etc. of cource thats not normal! since about 2010 those incidents are increasing as the solar minimus preogress.
- How to inoculate people against Donald Trump's fact bending claims
ryland at 19:42 PM on 24 March, 2016Dr Death @8. Not unsurprisingly despite your comment "I will look at scientific facts and the reasons for it and then I look at the debunking side of it as to why people believe that part is not true" none of those responding to your post have provided you with any sites where "debunking" occurs on a regular basis.
Some of those sites are Wattsupwiththat run by an American "meteorologist" but probably more accurately a TV and radio weather presenter; Jonova run by the Australian Joanne Nova who has an Honours degree majoring in Microbiology and Molecular Biology from the University of Western Australia; ClimateAudit run by Steve McIntyre a Canadian with a Bachelor's degree im Mathematics from the University of Toronto and a degree in politics, philosophy and economics from the Unversity of Oxford; Climate Etc run by the American Dr. Judith Curry who is a climatologist with many peer reviewed publications in the field of climate science; Global Warming Policyh Foundation started by the Englishman Nigel Lawson (aka Lord Lawson) who was the Chancellor of the Exchequer in Mrs thatcher's government. Others you might like to look up are the American Dr. Richard Lindzen an atmospheric physicist educated at Harvard, the American meteorologist Dr Roy Spencer and the American climate scientist Dr john Christy who, with Roy Spencer monitors the global climate using information from satellites
All of those who I have mentioned are persona non grata at this site but as your stated aim is to examine the views from the "debunking side" it seems remiss not to point you in the direction of some, but by no means all, of those who frequently comment on the 'debunking side" of the climate debate
- Ted Cruz's favorite temperature data just got a lot hotter
Tom Dayton at 02:36 AM on 9 March, 2016Carl Mears has responded to criticisms (mostly Roy Spencer's) of the RSS 4.0 update. (Hat tip to barry at Open Mind)
- Ted Cruz's favorite temperature data just got a lot hotter
One Planet Only Forever at 02:44 AM on 7 March, 2016While TMT and TTT are scientifically interesting things to better understand, it is clearly the trend in TLT (the values below more of the excess CO2 known to be the result of burning fossil fuels and deforestation to grow commodities that already fortunate people can profit and benefit more from), that would be more relevant as a comparison to the trend of global average surface temperatures (which is clearly the more relevant surface temperature data, particularly the surface data evaluations that include the polar regions since satellite evaluations do not include the polar regions).
It is also interesting, but not really relevant to the evaluation of the impact of excess CO2 from human burning of fossil fuels, that UAH (Spencer and Christy) have recently presented their evaluation of the RSS update (on Dr. Roy Spencer's website), but chose to first report their evaluation of TMT. They have pointed out a couple of reasons they would consider UAH TMT more 'accurate' than RSS TMT. And it appears they wish to imply that their cherry-picked points of critcism in the TMT evaluation by RSS should be the basis for deciding which method of 'guessing how to manipulate the satellite data to represent temperature values' is the better one (with the default claim being that the interpretation of satellite data that UAH is currently on version 6 of is somehow the only valid measure of the human impacts - which isn't really their claim because their presentations to date appear to be based on the fundamental position that the burning of fossil fuels is not a matter of concern and their job is to develop and deliver the 'best possible information in support of that preferred belief').
Clearly, a major impediment to the advancement of humanity continues to be the potential for people who have little interest in advancing humanity to a lasting better future for all to knowingly abuse deliberately deceptive marketing to drum up unjustifiable popular support for irresponsible, unsustainable and damaging economic and political actions. The wealthiest and most influential among these people understand that the required changes to advance humanity would include stopping 'their callous greedy pursuits of personal reward any way they can get away with'. Their motivation is clarly to try anything they think they can get away with to delay the advancement of human understanding and development of a lasting better future for all, including trying to focus the discussion heard about by the general population on the trends of a selective method of determining TMT from satellite data. The objective is to create the impression that the less reliable and less relevant satellite TMT evaluations are strong evidence that any trend in the global average surface temperature data is wrong (it is also an attempt to distract attention from the other clear indications of the unacceptable results of the massive burning of fossil fuels and deforestation being gotten away with for the benefit of already fortunate people to the detriment of the future of humanity).
- Explainer: how surface and satellite temperature records compare
Tom Curtis at 08:30 AM on 2 March, 2016To save clicking on Tom Dayton's link (unless you want the detailed discussion):
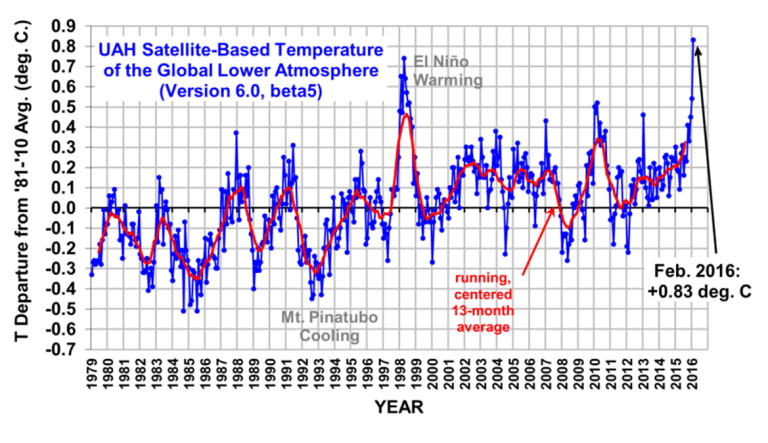
In that detailed discussion, Roy Spencer draws attention to the fact that the new monthly record is not entirely due to El Nino, given that it was not a record for the tropical anomaly. Rather, the El Nino warmth was boosted by some other (unnamed by Spencer) factor, which boosted the NH extratropical land temperatures to unprecedented values:
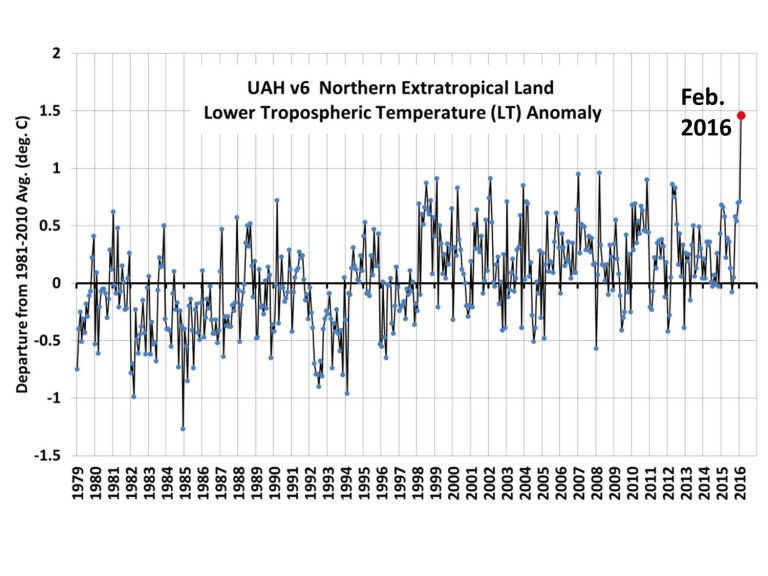
- Explainer: how surface and satellite temperature records compare
Tom Dayton at 05:21 AM on 2 March, 2016UAH 6 for Feb. 2016 is available. Whoops.
- Ted Cruz fact check: which temperature data are the best?
knaugle at 05:03 AM on 21 January, 2016Here is an interesting article that addresses questions I've had for a while. How accurate are satellite measured temperatures of the troposphere? What are the issues with satellite indirect temperature measurements.
http://www.accuweather.com/en/weather-blogs/climatechange/some-of-the-issues-with-satell/54879902
Now that NOAA is out with its 2015 Annual SOTC report, you can bet many will be parading out Dr. Roy Spencer's results that show 2015 "only" 3rd warmest by UAH 6.0 satellite data. It's nice to understand the limits of his claim.
- Surface Temperature or Satellite Brightness?
Tom Curtis at 13:43 PM on 16 January, 2016Some of you are undoubtedly already aware of the excellent video on satellite temperatures recently released by Peter Sinclair:
There is now some denier pushback against that video, led by the infamous James Delingpole, ;at Breitbart.
Some of the pushback (typically of Delingpole) is breathtaking in its dishonesty. For instance, he claims:
"This accuracy [of the satellite record] was acknowledged 25 years ago by NASA, which said that “satellite analysis of the upper atmosphere is more accurate, and should be adopted as the standard way to monitor temperature change.”
It turns out the basis of this claim, is not, however, a NASA report. Rather it was a report in the The Canberra Times on April 1st, 1990. Desite the date, it appears to be a serious account, but mistaken. That is because the only information published on the satellite record to that date was not a NASA report, but "Precise Monitoring of Global Temperature Trends" by Spencer and Christy, published, March 30th, 1990. That paper claims that:
"Our data suggest that high-precision atmospheric temperature monitoring is possible from satellite microwave radiometers. Because of their demonstrated stability and the global
coverage they provide, these radiometers should be made the standard for the monitoring of global atmospheric temperature anomalies since 1979."A scientific paper is not a "NASA report", and two scientists bignoting their own research does not constitute an endorsement by NASA. Citing that erronious newspaper column does, however, effectively launder the fact that Delingpole is merely citing Spencer and Christy to endorse Spencer and Christy.
Given the history of found inaccurracies in the UAH record since 1990 (see below), even if the newspaper column had been accurate, the "endorsement" would be tragically out of date. Indeed, given that history, the original claim by Spencer and Christy is shown to be mere hubris, and wildly in error.
Delingpole goes on to speak of "the alarmists’ preference for the land- and sea-based temperature datasets which do show a warming trend – especially after the raw data has been adjusted in the right direction". What he carefully glosses over is that the combined land-ocean temperature adjustments reduce the trend relative to the raw data, and have minimal effect on the 1979 to current trend.
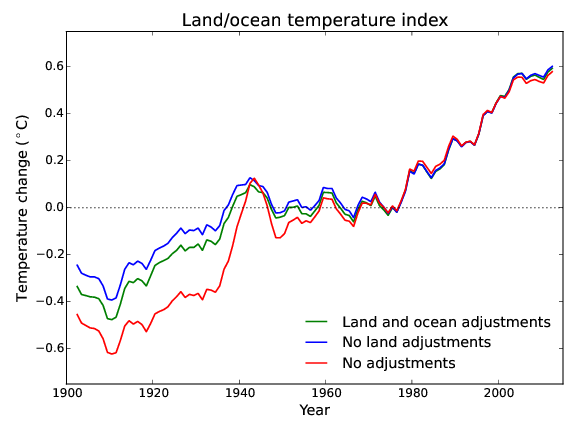
He then accuses the video of taking the line that "...the satellite records too have been subject to dishonest adjustments and that the satellites have given a misleading impression of global temperature because of the way their orbital position changes over time." That is odd given that the final, and longest say in the video is given to satellite temperature specialist Carl Mears, author of the RSS satellite temperature series, whose concluding point is that we should not ignore the satellite data, nor the surface data, but rather look at all the evidence (Not just at satellite data from 1998 onwards). With regard to Spencer and Christy, Andrew Dessler says (4:00):
"I don't want to bash them because everybody makes mistakes, and I presume everybody is being honest..."
Yet Delingpole finds contrary to this direct statement that the attempt is to portray the adjutments as dishonest.
Delingpoles claim is a bit like saying silent movies depict the keystone cops as being corrupt. The history of adjustments at UAH show Spencer and Christy to be often overconfident in their product, and to have made a series of errors in their calculations, but not to be dishonest.
The nest cannard is that satellites are confirmed by independent data, in balloons - a claim effectively punctured by Tamino:

Finally, Delingpole gives an extensive quote from John Christy:
"There are too many problems with the video on which to comment, but here are a few.
First, the satellite problems mentioned here were dealt with 10 to 20 years ago. Second, the main product we use now for greenhouse model validation is the temperature of the Mid-Troposphere (TMT) which was not erroneously impacted by these problems.
The vertical “fall” and east-west “drift” of the spacecraft are two aspects of the same phenomenon – orbital decay.
The real confirmation bias brought up by these folks to smear us is held by them. They are the ones ignoring information to suit their world view. Do they ever say that, unlike the surface data, the satellite datasets can be checked by a completely independent system – balloons? Do they ever say that one of the main corrections for time-of-day (east-west) drift is to remove spurious WARMING after 2000? Do they ever say that the important adjustment to address the variations caused by solar-shadowing effects on the spacecraft is to remove a spurious WARMING? Do they ever say that the adjustments were within the margin of error?"
Here is the history of UAH satellite temperature adjustments to 2005:
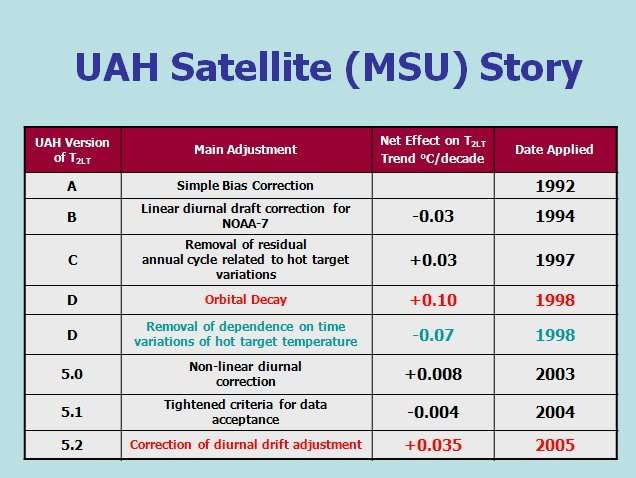
Since then we have had additional corrections:
- 5.2: Eliminate NOAA 16 data, +0.01 C/decade; Dec 2006
- 5.2: Discovered previous correction eliminated NOAA 15 by mistake, unknown amount; Dec 2006
- 5.2 Switch from annual to monthly anomaly period baseline, +0.002 C/decade; July 2009
- 5.5 Eliminate AQUA data, + 0.001 C/decade
There were also changes from version 5.2 to 5.3, 5.3 to 5.4 and 5.5 to 5.6 which did not effect the trend. Finally we have the (currently provisional) change from 5.6 to 6.0:
- 6.0, Adjust channels used in determining TLT, -0.026 C/decade; April, 2015
Against that record we can check Christy's claims. First, he claims the problems were dealt with 10-20 years ago. That, of course, assumes the corrections made fixed the problem, ie, that the adjustments were accurate. As he vehemently denies the possibility that surface temperature records are accurate, he is hardly entitled to that assumption. Further, given that it took three tries to correct the diurnal drift problem, and a further diurnal drift adjustment was made in 2007 (not trend effect mentioned), that hardly inspires confidence. (The 2007 adjustment did not represent a change in method, but rather reflects a change in the behaviour of the satellites, so it does not falsify the claim about when the problem was dealt with.)
Second, while they may now do model validation against TMT, comparisons with the surface product are done with TLT - so that represents an evasion.
Third, satellite decay and diurnal drift may be closely related problems but that is how they are consistently portrayed in the video. Moreover, given that they are so closely related it begs the question as to why a correction for the first (Version D above) was not made until four years after the first correction for the second.
Moving into his Gish gallop we have balloons (see link to, and image from Tamino above). Next he mentions two adjustments that reduce the trend (remove spurious warming), with the suggestion that the failure to mention that the adjustments reduce the trend somehow invalidates the criticism. I'm not sure I follow his logic in making a point of adjustments in the direction that suites his biases. I do note the massive irony given the repeated portrayal of adjustments to the global land ocean temperture record as increasing the trend relative to raw data when in fact it does the reverse.
Finally, he mentions that the adjustments fall within the margin of error (0.05 C per decade). First, that is not true of all adjustments, with two adjustments (both implimented in version D) exceding the margin of error. Second, the accumulative adjustment to date, including version 6.0, results in a 0.056 C/decade increase in the trend. That is, accumulative adjustments to date exceed the margin of error. Excluding the version 6 adjustments (which really change the product by using a different profile of the atmosphere), they exceeded the margin of error by 38% for version 5.2 and by 64% for version 5.6 (as best as I can figure). If the suggestion is that adjustments have not significantly altered the estimated trend, it is simply wrong. Given that Christy is responsible (with Spencer) for this product, there is not excuse for such a mistatement.
To summarize, the pushback against the video consists of a smorgazbord of innacurate statements, strawman presentations of the contents of the video, and misdirection. Standard Delingpole (and unfortunately, Christy) fare.
- Surface Temperature or Satellite Brightness?
Bart at 01:00 AM on 13 January, 2016But what about UAH?
Version 6 is a strongly adapted version that shows less warming than before, especially in the past 20 years. The LT trend, according to Spencer, is only 0.11 degrees per decade since 1979, which result in a large gap with 2m observation and also RSS.
I found a comment here, that says, among others, "They [Spencer and Christy] have continued this lack of transparency with the latest TLT (version 6), which Spencer briefly described on his blog, but which has not been published after peer review." and also with respect to TMT: "I think it's rather damning that Christy used the TMT in his committee presentation on 13 May this year. He appears to be completely ignoring the contamination due to stratospheric cooling."
I am interested in you view on this.
Bart S
- The best of climate science and humanity come together at AGU
ryland at 23:57 PM on 22 December, 2015PeterH Can you advise how the 100% of global warming is attributable to humans has been arrived at? Are you saying that computer programs devised by humans, who not only freely admit to not knowing the precise details of how the various factors affecting the climate interact but also that there are almost certainly unknown contributing factors, are reliable prognosticators of global warming? And please don't bring Arrhenius 1896 into your argument a syou are dealing with a scientist with a lot of experience in vetting all sorts of claims. And just to finish I do know climate change is occurring and that humans are responsible at least in part but I don't accept Gavin Schmidt's 110%. Also I accept that a 2C increase means the end of the world as we know it for as Roy Spencer has recently pointed out we are already at 1.5C increase
- Satellites show no warming in the troposphere
Tom Dayton at 12:33 PM on 15 December, 2015Sorry, JoeT, I haven't tried to understand Roy Spencer's admission of the satellite-based estimate of tropospheric temperature being not usable as a proxy for surface temperature. I don't have time right now, since I'd have to spend a lot of time to research it. I posted that just because it's informative that even Spencer has admitted it.
- Satellites show no warming in the troposphere
Tom Dayton at 03:38 AM on 12 December, 2015Even Roy Spencer now admits that satellite "measurements" of tropospheric temperature cannot and must not be used as proxies for surface temperature measurements, due to major unresolved issues in the assumptions used in the complex conversions of the microwave measurements into estimates of temperatures. (Spencer is one of the two main people responsible for the "UAH" satellite-based troposphere temperature estimations.)
- Satellites show no warming in the troposphere
gregcharles at 09:47 AM on 19 November, 2015Something I'm having trouble reconciling is the comparison of UAH and RSS datasets. The article states, "Throughout the history of Tropospheric temperature measurement, the UAH analysis has always been lower than RSS for all temperature products." However, as Knaugle pointed at #51, it's RSS that's been the outlier, or at least it was until UAH 6.0 brought UAH into line with it. Spencer (of UAH) talks about the discrepancy in a blog post from a few years back, promising he's not been "bought off by Greenpeace", and even going so far as to say that in his boss's (John Christy) opinion, "RSS data is undergoing spurious cooling."
- Satellites show no warming in the troposphere
knaugle at 02:18 AM on 3 November, 2015I find it interesting that Dr. Roy Spencer gets a lot of (mostly deserved) criticism here for his interpretation of temperature data, and all the corrections to the UAH temperature data. Yet what really puzzles me is that when I visited Dr. Cowtan's Temperature trends site
http://www.ysbl.york.ac.uk/~cowtan/applets/trend/trend.html
ALL the global, land/ocean, satellite data sets show about +1.4°C ± 0.2°C/decade warming for the past 20 years, EXCEPT for RSS, which is only +0.04°C per decade in that time frame. Similarly, at 30 years, the average warming is about 0.175°C/decade and RSS remains noticably lower than the other sets. So it seems all the agjustments to UAH have brought it more in agreement with the surface data, but it does beg the question what's with RSS?
- A Rough Guide to the Jet Stream: what it is, how it works and how it is responding to enhanced Arctic warming
Tom Curtis at 17:18 PM on 28 October, 2015Chuck Wiese, former TV weatherman, (snip)
As Glenn knows quite well, I am not the Thomas Curtis employed by Deutsche Bank. Rather, I am this Tom Curtis. You will no doubt now riddle my qualifications (only a BA, and that only in philosophy), but when you do you will miss the point. The point is that by ending every communication you make on the subject of climate science with the title, "Metereorologist" you are implicitly claiming that what you say ought to be accepted based on your expertise alone. That is particularly the case given that you do not cite sources, and in this instance presented no data. Well, I am prepared to accept that some people are entitled to so ponitificate. Those people, however, are restriced exclusively to those with an extensive publication history on the topic in hand, and who are in agreement with the scientific consensus on the particular issue on which they discuss. Put another way, even the most qualifed loose their right to pontificate once the detailed topic of discussion is contentious within the scientific community.
You do not fit that category.
What is more absurd is that you are implicitly claiming that your authority as Chuck Wiese BSc, and sometime TV weatherman is superior to that of Jennifer Francis PhD in atmospheric sciences, with her thesis focussing on the Arctic, and with 40 odd recent publications on related topics. Not to mention the more then ten similarly or better qualified people who have reviewed and or discussed her thesis in the peer reviewed literature without noting the "killer argument" against it you claim to have found.
In that context, and given your implicit claim to authority, rebutting that claim does not constitute a personal attack. When you claim authority on a topic, the reality of that authority becomes relevant to disussion - and when yours is discussed it is found to be worse than non-existent.
That is demonstrate hilariously when you defend yourself against accusations of pseudoscience by apealing to Miskolczi.
On to more substantive matters:
1) The ice core record shows that rises(and falls) in CO2 generally (but not always) lags the rise(and fall) in SH temperatures, but precedes rises in NH and global temperatures. This record is consistently misrepresented by deniers who refuse to acknowledge that sometimes CO2 rises precede even SH temperatures, and insist on treating the purely regional SH temperature record as a global record. The facts as revealed by all of the data are fully consistent with a strong enhanced greenhouse effect with the initial rise in CO2 triggered by milankovitch forcing.
2) On Miskolczi's humidity thesis, even the well known AGW skeptic Roy Spencer can only bring himself to say:
"... his additional finding of a relatively constant greenhouse effect from 60 years of radiosonde data (because humidity decreases have offset CO2 increases) is indeed tantalizing. But few people believe long-term trends in radiosonde humidities. His result depends upon the reality of unusually high humidities in the 1950s and 1960s. Without those, there is no cancellation between decreasing humidity and increasing CO2 as he claims."
So, only if two thoroughly implausible spikes in water vapour from the early days of the radiosonde record, when instruments are known to have been unreliable, are not artifacts is there even a basis for the claim - but it would remain without theoretical basis of any substance.
3) The temperature trend over the last 18 years exactly, using the most recent update from GISS is 0.118 +/- 0.104 C/decade. That is, it has a statistically significant trend that distinguishes it from zero, but not from the model predictions. (Determined here, with an initial date of 1997.78) So, even the tired old, mendacious denier trick of pretending a positive trend not statistically distinguishable from zero is "a static global temperature" is now out of date. Time for you to switch to "its only because of the El Nino" while hoping we don't notice how carefully you cherry picked the last very strong El Nino for the start date of the sequence.
4) You mention two textbooks in defence of your claim, not quote no passages. Nor do you explain how their result was derived. In the meantime, Francis and Vavrus also cite a textbook in support of their views:
"When zonal wind speed decreases, the large-scale Rossby waves progress more slowly from west to east, and weaker flow is also associated with higher wave amplitudes [Palmén and Newton, 1969]. Slower progression of upper-level waves causes more persistent weather conditions that can increase the likelihood of certain types of extreme weather, such as drought, prolonged precipitation, cold spells, and heat waves. Previous studies support this idea: weaker zonal-mean, upper-level wind is associated with increased atmospheric blocking events in the northern hemisphere [Barriopedro and Garcia-Herrera, 2006] as well as with cold-air outbreaks in the western U.S. and Europe [Thompson and Wallace, 2001; Vavrus et al., 2006]."
Presumably then, at least one of you have misinterpreted your source, and your appeal to your authority as a BSc to ensure that it is not you really does not cut it, evidence wise. Particularly given your vocal history espousing pseudoscience.
- Models are unreliable
Tom Dayton at 12:44 PM on 19 October, 2015spunkinator99: See also Bart Verheggen's post "John Christy, Richard McNider and Roy Spencer trying to overturn mainstream science by rewriting history and re-baselining graphs." And a new comment I just posted on the satellites SkS post.
- Models are unreliable
Tom Dayton at 02:01 AM on 19 October, 2015spunkinator99: Be sure to read the comments on that satellites post, especially the ones in 2015, and follow my comments' links to Tamino's blog that examines balloon radiosonde temperature measurements and their curiously increasing discrepancy from satellite measurements beginning around the year 2000. And read Glenn Tamblyn's comment on Spencer's blog.
- Models are unreliable
Tom Dayton at 01:09 AM on 19 October, 2015spunkinator99: Among other problems with that graph, it is baselined improperly so that the UAH and RSS lines begin near the model mean and diverge over time. Spencer used the same deceptive tactic in later constructing a graph of 90 model runs, as Sou explains at Hotwhopper. Tom Curtis pointed out why 1983 was such an obvious choice for Spencer's distortion.
Ed Hawkins at Climate Lab Book updates his comparison graph frequently. John Abraham's recent article's graph is bigger and so easier to read, and shows the earlier (CMIP3) model runs as well as CMIP5.
None of those shows the correct model lines, because those model lines were for surface air temperature despite observations being of surface sea temperature where not ice covered. The correct model lines are shown in an SkS post.
- Models are unreliable
spunkinator99 at 00:04 AM on 19 October, 2015Hi,
I was wondering if anyone could help me here. I've been inundated by this chart and others like it from my skeptic friends. It compares computer models to observed temperature only using UAH and RSS. Obviously it's cherry-picking since there are other temperature sets but does anyone have a chart similar to this that shows all the major data sets?
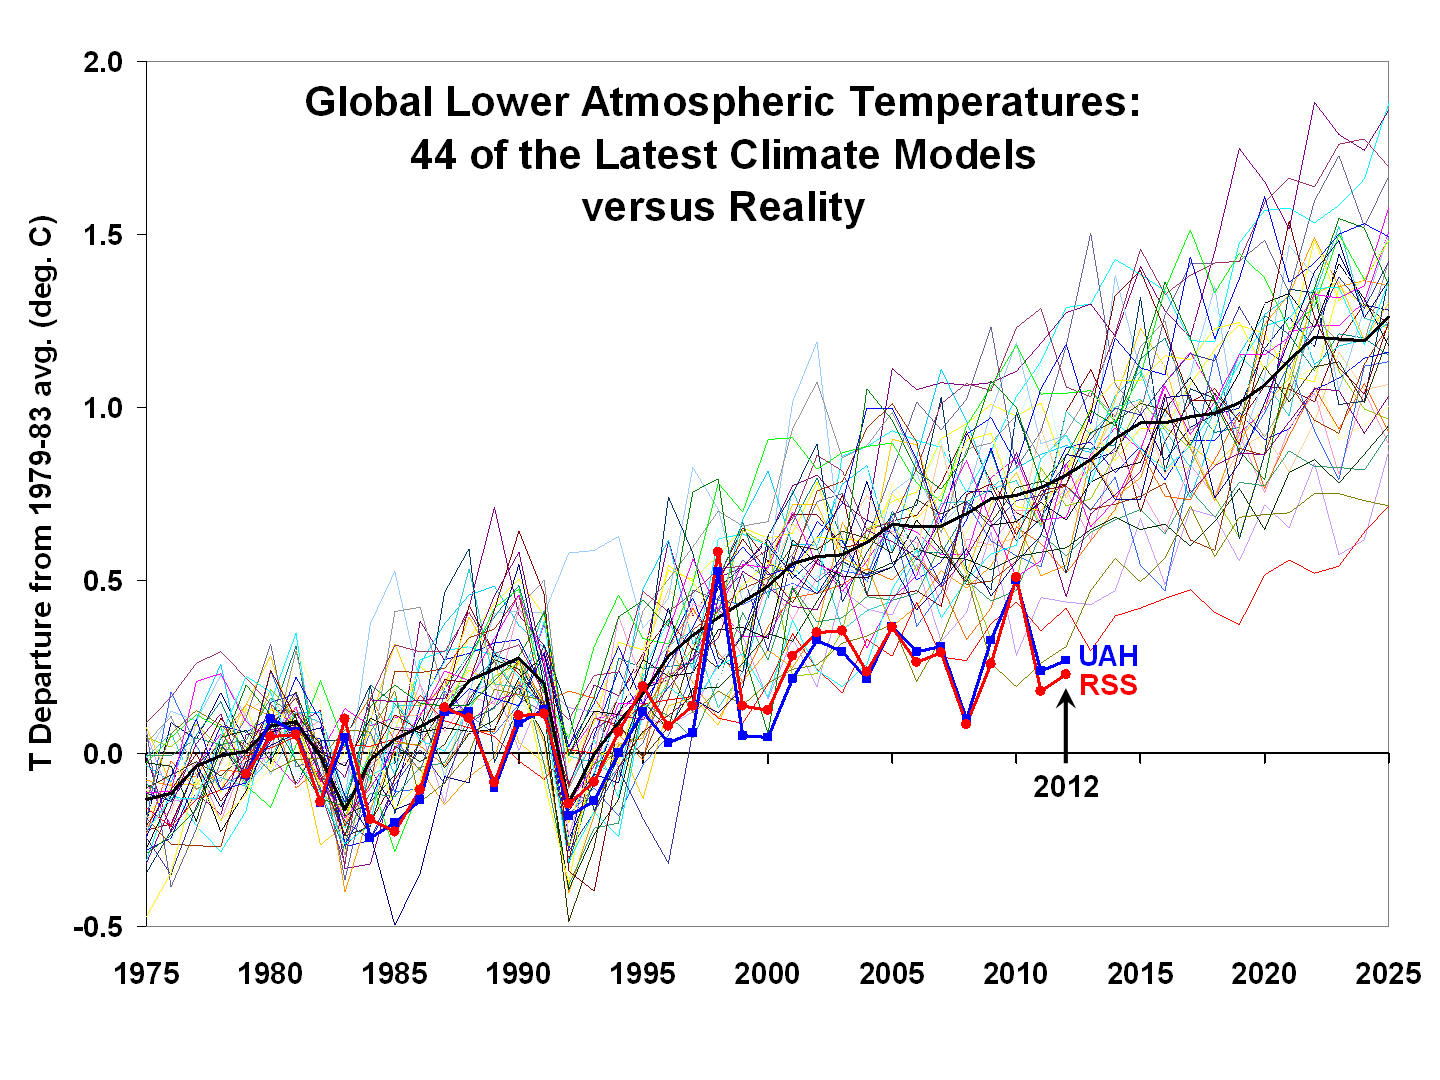
- Hockey stick is broken
Tom Dayton at 11:51 AM on 31 August, 2015Jim Milks compiled a list of three dozen replications of the hockey stick, and that's only up through 2013.
Hat tip to Jack Dale via David Appell.
- Climate denial linked to conspiratorial thinking in new study
ryland at 07:49 AM on 10 July, 2015Philippe Chantreau. If you're going to attack something i wrote, attack what I actually did write rather than what you think I actually wrote' You start off with this comment of mine:
"There may be a 97% consensus of climate scientists that humans are responsible for climate change and certainly I consider that humans have contributed and do contribute to climate change but there are a lot of other scientists who are less convinced."
You then say:
It matters very little that there are "a lot" of scientists who are less convinced. They're still only 3%.
Can you not see i didn't say 97% of scientists but 97% of climate scientists. You then follow up by saying it matters very little as they're still only 3%
Who are still only 3%? All the other scientists who are not climate scientists? Geologists? Meteorologists? Physicists? Surely you recall the survey by the American Meteorological Society that showed only 52 % of its members were convinced oof AGW. The survey did make it plain that meteorologists were at odds with the majority of scientific research on climate change. I was careful to distinguish between climate scientists and other scientists, a distinction you appear not to have noticed. After that introductory bit of stunning misapprehension I didn't bother to read the rest as its late
scaddenp what I can't get from the daily mail I make up. And as for the media The Guardian in which dana frequently writes is a useful source as is RealClimate. So is Roy spencer and judith Curry and Jo Nova and Grant Foster
More than 100 comments found. Only the most recent 100 have been displayed.
More than 100 comments found. Only the most recent 100 have been displayed.


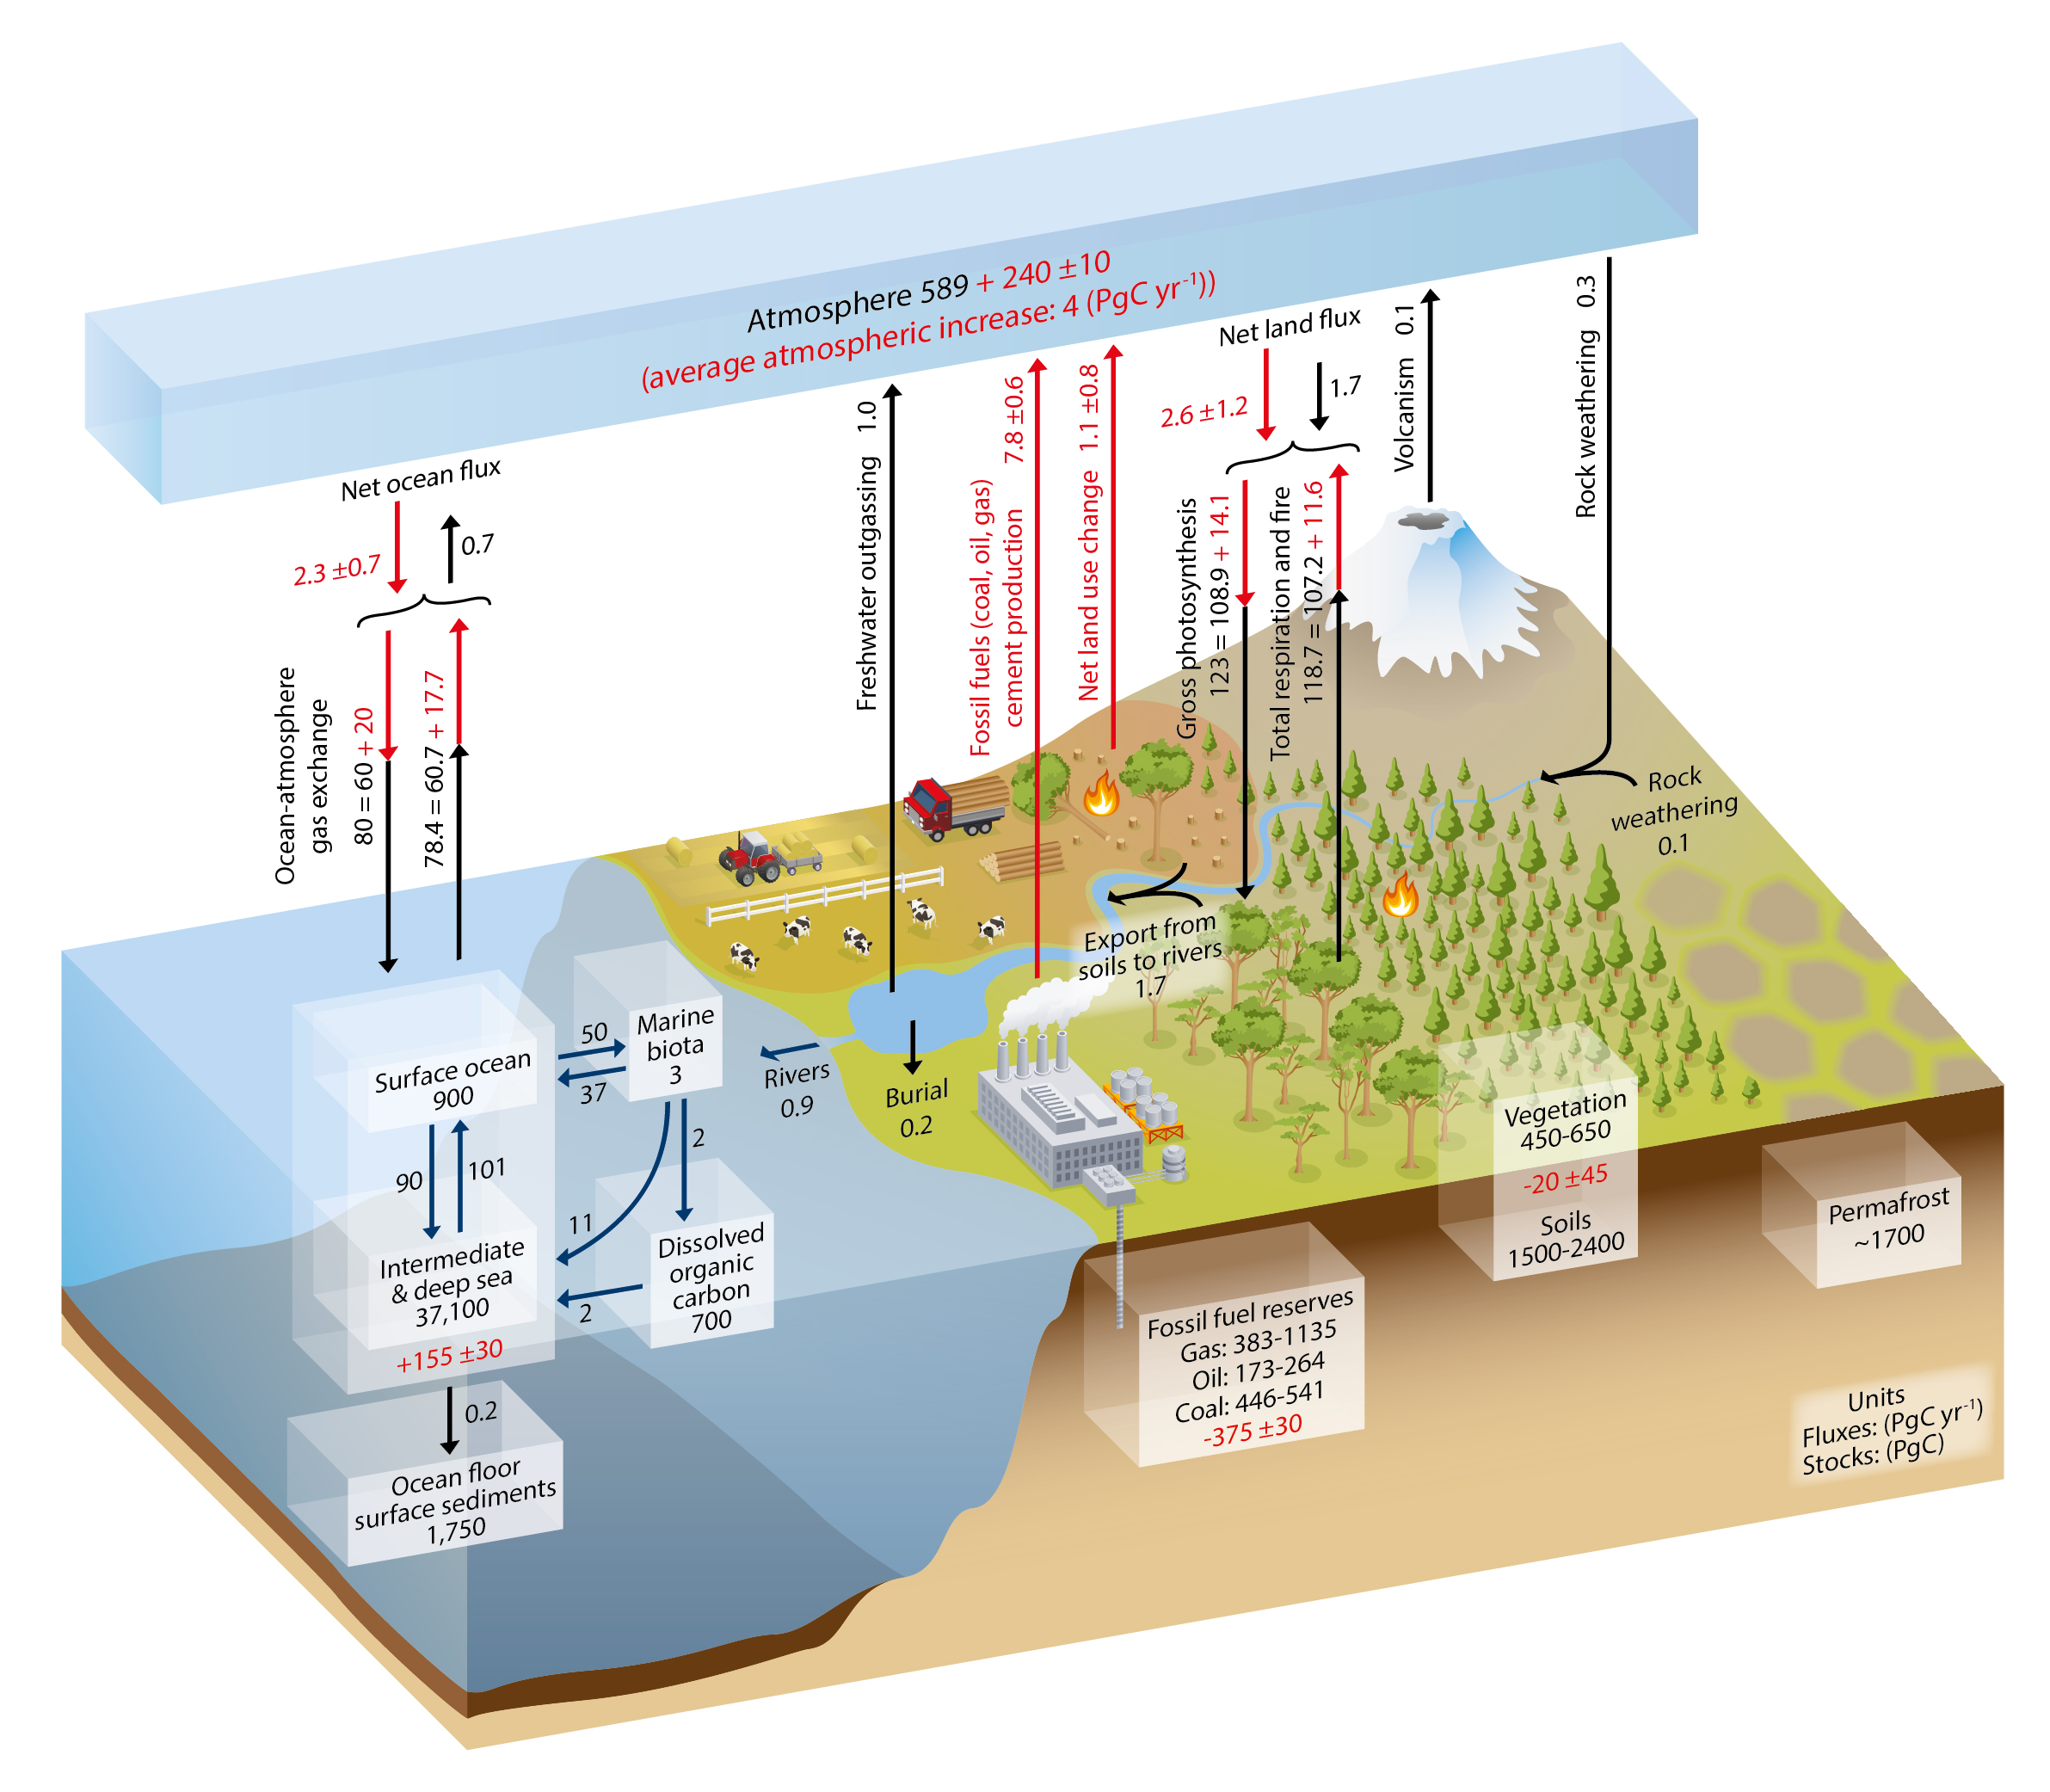
THE ESCALATOR

(free to republish)