Climate Science Glossary

Term Lookup

Enter a term in the search box to find its definition.

Settings

Use the controls in the far right panel to increase or decrease the number of terms automatically displayed (or to completely turn that feature off).

Term Lookup

Settings


All IPCC definitions taken from Climate Change 2007: The Physical Science Basis. Working Group I Contribution to the Fourth Assessment Report of the Intergovernmental Panel on Climate Change, Annex I, Glossary, pp. 941-954. Cambridge University Press.

Home Arguments Software Resources Comments The Consensus Project Translations About Support

Twitter Facebook YouTube Mastodon MeWe

RSS Posts RSS Comments Email Subscribe


Climate's changed before
It's the sun
It's not bad
There is no consensus
It's cooling
Models are unreliable
Temp record is unreliable
Animals and plants can adapt
It hasn't warmed since 1998
Antarctica is gaining ice
View All Arguments...


Username
Password
New? Register here
Forgot your password?

Latest Posts

Archives

What has global warming done since 1998?

What the science says...

Select a level... Basic Intermediate

Every part of the Earth's climate system has continued warming since 1998, with the ten record temperature years all occurring since 2010.

Climate Myth...

It hasn't warmed since 1998

For the years 1998-2005, temperature did not increase. This period coincides with society's continued pumping of more CO2 into the atmosphere. (Bob Carter)

At a glance

This date-specific talking-point is now something of a historical curiosity, but we'll leave it in the database for now because it's such a good illustration of the simplistic yet reckless mindset of the serial climate change misinformer. And indeed, we could (out of sheer mischief) have revised this myth by replacing "1998" with "2016". In fact, that's what we started to see in the climate change misinformation stream, © the Usual Suspects. But 2023's record temperatures put a stop to that.

Anyway, as first predicted over a century ago, Earth's surface, oceans and atmosphere are all heating up. That's due to our increasing greenhouse gas emissions, but over the years the warming has occurred at varying rates. This should in no way come as a surprise. Other physical phenomena periodically act either to suppress or enhance temperatures.

A prime example of such a phenomenon is the effects of La Nina and El Nino. This natural climatic oscillation features variations in winds and sea surface temperatures over the tropical eastern Pacific Ocean. The cycle can at times strongly influence temperature and rainfall patterns right around the world.

In a La Nina year, temperatures are suppressed, whereas an El Nino year sees them enhanced. This is noise on the long-term upward trend. That's why climatologists work with multiple decades, not just a few years in isolation, in order to get a grasp on what is going on.

The year 1998 featured a massive El Nino. The temperature spike it caused was a huge outlier, like a pinnacle towering over the landscape of the temperature record. In the following years there was a return to more typical conditions, with an erratic but upward warming pattern. That sequence of events gave deniers a brief opportunity to insist that global warming had “paused” or had even stopped.

You only need to remember one thing here. Those who create and spread misinformation about climate change don't care about reality. Public confusion is their aim. In this instance, the misinformation exercise involved deliberately selecting a limited block of years starting with the massive El Nino of 1998 and using that very warm starting-point to insist that global warming had stopped. They knew this would likely work for a few years and that the public would quickly forget why that was the case. Mother Nature had handed them a gift. It was an irresistible bunch of low-hanging fruit to exploit: little wonder the tactic is known as 'cherry-picking'.

Talking about reality, what actually happened? Well, as of 2024, a couple of decades down the line, the top ten warmest years have all been since 2010, whatever observation-based dataset you choose, with eight of them being in the 2015-2023 period. 1998 is nowhere to be seen any more. By modern standards, it simply wasn't warm enough.

Please use this form to provide feedback about this new "At a glance" section, which was updated on May 27, 2023 to improve its readability. Read a more technical version below or dig deeper via the tabs above!


Further details

Even if we ignore long term trends (something deniers often do in order to make a point) and just look at the record-breakers, as of early 2024 the top ten warmest years have all been since 2010, whatever dataset you choose, with eight of them being in the 2015-2023 period. In this top ten grouping, 1998 is nowhere to be seen any more. It was not warm enough.

The myth of no warming since 1998 was largely based on the satellite record estimates of the temperature of the atmosphere.  However, as discussed in the video below by Peter Sinclair, even that argument is no longer accurate.  The satellites show warming since 1998 too.

There's also a tendency for some people just to concentrate on atmospheric or surface air temperatures when there are other, more useful, indicators that can give us a better idea how rapidly the world is warming. More than 90% of global warming heat goes into warming the oceans, while less than 3% goes into increasing the atmospheric and surface air temperature.  Records show that the Earth has been warming at a steady rate before and since 1998 and there is no sign of it slowing any time soon (Figure 1). 

Fig 1

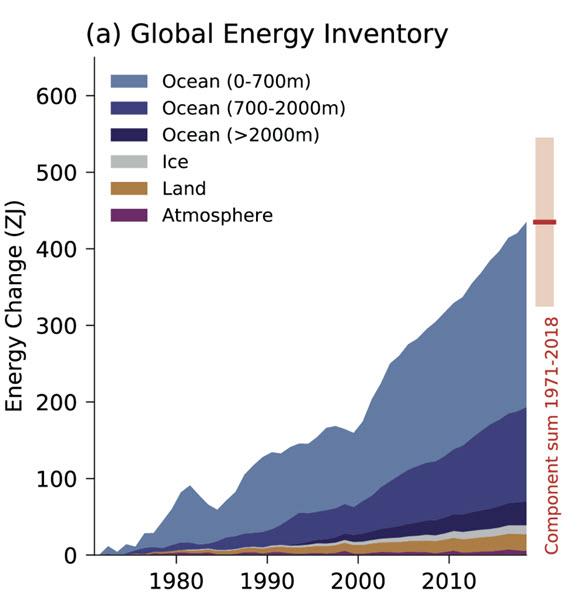
Figure 1:  Global Energy Inventory: observed changes in the global energy inventory for 1971–2018 (shaded time series) with component contributions as indicated in the figure legend. Cross-Chapter Box 9.1 Figure 1 (part a) - From IPCC AR6 WGI Chapter 9.

Even if we focus exclusively on global surface temperatures, Cowtan & Way (2013) shows that when we account for temperatures across the entire globe (including the Arctic, which is the part of the planet warming fastest), the global surface warming trend for 1997–2015 is approximately 0.14°C per decade.

Ultimately, every part of the Earth's climate system is warming, and has continued warming since 1998.

Last updated on 8 March 2024 by John Mason. View Archives

Printable Version  |  Offline PDF Version  |  Link to this page

Argument Feedback

Please use this form to let us know about suggested updates to this rebuttal.

Further reading

Tamino further explores the warming trend since 1998 in Garbage is Forever and Wiggles.

I've kept my original treatment of the subject as other websites hotlink to the images. My original treatment uses similar arguments to Fawcett and Jones 2008 although their analysis is much more rigorous (as you'd expect in a peer-reviewed paper).

Further viewing

Comments

Prev  1  2  3  4  5  6  7  8  9  10  11  12  13  14  15  16  17  Next

Comments 176 to 200 out of 415:

  1. I'm sure you'll do a blog entry on this in due course, but in the meantime here is a link to a report on the update to HadCRUT, which now has 2010 as the hottest year on record, rather than 1998, bringing it into line with NASA and NOAA
  2. Phil wrote: "...here is a link to a report on the update to HadCRUT, which now has 2010 as the hottest year on record" Cue 'skeptic' cries of 'conspiracy and fraud!' in 3, 2, 1...
  3. Not that a sign of increasing temperature proves that humans are causing it, but just dealing with the argument.. The article starts with a straw man logical fallacy "No, it hasn't been cooling since 1998." implying that was Carter's position. No warming doesn't imply cooling. According to the latest HadCRUT4 data, there is no statistically significant increase in temperature (0.083C/dec +/-0.172C/dec). It is also stressed in the HadCRUT4 report that it cannot be said yet whether 2005 or 2010 are the hottest on record.
  4. hutch44uk given that such a short trend does not give as an answer, try to ask yourself the question the other way around, do we have reason to belive that the trend has stopped or even slowed down? The answer is no, both statistically and climatologically.
  5. hutch44uk @178:
    "Remembering that the radiative effects of extra carbon dioxide occur at the speed of light, and that both the ocean and the atmosphere are currently cooling, just where is this 0.5°C. of "pipeline" heat supposed to be hiding?)."
    (Bob Carter, The Drum, 19th Dec 2011, my emphasis). There is no strawman. Just a misrepresentation of the facts by Carter.
  6. hutch#178: "there is no statistically significant increase..." Since you do not specify a time frame, this statement has no meaning. However, it is one that is heard a lot in these parts. Given the generally intended meaning is that 1998 was warmer than xxxx, we have a very good explanation here. If nothing else, that exercise will help you learn how to connect the dots more appropriately.
  7. Hutch44UK "no statistically significant warming" doesn't mean that there is no warming. It means that the trend is too small in magnitude relative to the noise that we can't rule out the possibility that it isn't warming. If you want to use a lack of statistical significance to establish that it hasn't been warming then you would need to show that the statistical power of the test was sufficiently high that a statistically insignificant result would be a surprise if the trend actually was of continuing warming at the same rate as before. Alternatively you could try to show that the change in trend since (say) 1998 was statistically significant. Needless to say, skeptics generally don't do this and instead are happy to misuse statistical tests.
  8. My apologies muoncounter, you're right. The period was 1998-2010. By the way this is a misrepresentation of my position: "Given the generally intended meaning is that 1998 was warmer than xxxx". You are all "moving the goal post". I do not need answer further questions when my first claim has not been refuted. I have already shown that there is no significant trend since 1998. Dikran, they are not my statistics, but those of the trend calculator on this site from Foster and Rahmstorf, 2011. I suggest you take it up with them.
  9. hutch44uk#183: "I do not need answer further questions... " Since your 'first claim' was that this article starts with a strawman - and that is incorrect - you do indeed need answer no questions (none were asked of you). As to your subsequent claim of 'no statistically significant increase in temperature,' take out the ENSO noise and you're once again incorrect. Since you reference Foster and Rahmstorf 2011, perhaps you should note their very clear statement: there is no indication of any slowdown or acceleration of global warming, beyond the variability induced by these known natural factors. Then check Nielsen-Gammon, who also shows a consistent increase in temperatures. Apples to apples comparisons make sense, don't they? But if you insist on comparing el Nino years with la Nina years, why have recent la Ninas been warmer than the prior el Ninos?
  10. hutch44uk I am not questioning what the trend calculator says. I am pointing out that a particular intepretation often used by skeptics is incorrect. A lack of statistically significant warming does not mean it is not warming, just that you cannot rule out that possibility. If you have a two headed coin and flip it four times and get a head each time (oddly enough) then the usual test for the coin being biased gives the result "no significant". Does that mean the coin is fair? No, of course it doesn't, the coin has a head on both sides! The reason you get a result of "not significant" is that there have been too few coin flips observed to rule out the possibility that the coin is fair (at the usual 95% significance level). BTW if you adopt a statistic to make an argument, then they are your statistics, if only by adoption. You need to be able to defend your use of them, whether you calculated them or not.
  11. hutch, one of the things you are apparently not understanding is the difference between 'true' and 'meaningful'. It is true that there has been no statistically significant trend since 1998... it just isn't at all meaningful. There have been 13 years since 1998. If you look at the entire temperature anomaly record you will find very few (possibly zero) cases where a statistically significant trend occurred over a period of just 13 years. You are citing a period too short to achieve statistical significance as if it told us something about the trend. It does not. Essentially, you are pressing your nose up against a tree (i.e. the statistically insignificant past 13 years) so hard that you cannot see the surrounding forest (i.e. the rising temperature trend) and thus are 'free' to continue pretending it does not exist... [snip]
    Response: [Dikran Marsupial] Inflamatory snipped.
  12. hutch44uk: Surface temperatures are but a small portion of the global warming picture. Over 90% of global warming goes into the oceans (amply documented on this website). In addition global warming is itself but the result of a radiative energy imbalance whereby the Earth retains more energy than it emits - the Earth climate system is then forced to warm up to increase emissions to match, as per (as far as I know) undisputed principles of thermodynamics. As long as one can demonstrate the following: (1) There remains a measured top-of-atmosphere energy imbalance (conventionally measured as a forcing in Watts per square metre), and (2) The oceans continue to build up heat energy (conventionally measured as ocean heat content, in Joules), then there is simply no basis to conclude that global warming has in any way stalled or stopped, whatever variations show up in short-term surface temperature data. If you have sources showing both (1) and (2) are no longer operative, please feel free to share. Finally, I should address your accusation of Skeptical Science "moving the goalposts". From a logic standpoint, the fact of the matter is that the "global warming stopped in 1998" claim, whether asserted baldly or on the basis of no satistically-significant warming, is a cherry-pick. As such, dismantling the cherry-pick by including additional relevant information does not IMO constitute a shifting of goalposts.
  13. muoncounter, "take out the ENSO noise, and you're once again incorrect". The argument wasn't about warming purely from non-ENSO sources. Stop changing my position please! Dikran, no they're not my statistics. Foster and Rahmstorf chose a 2-sigma error band for statistical signficance, not me. CBDunkerson, it seems you agree with me by admitting it's true. I agree with you too.. this whole argument isn't at all meaningful, as it doesn't prove that CO2 is causing the warming anyway (for another thread)! Thanks for the discussions.
  14. hutch, your first claim (Carter did not claim cooling) has been refuted by Tom @ 180. Do you acknowledge this? Your second point has been amply responded to: within a specific set of dates, no significant warming (which, as you point out, doesn't mean cooling) can be demonstrated when using a chosen data set for a specific part of the atmospheric system (more specifically the part that doesn't store the greater part of the energy) and using a particular type of analysis that doesn't account for particular types of forcings. What you could possibly use this result for, I can't imagine. Well, I can imagine, but I'd rather give your integrity the benefit of the doubt before going there.
  15. hutch44k, 1) Do you agree that the trend shown by HadCRUT4 from 1970 to current is 0.172 ±0.033 °C/decade (2σ)? 2) Do you agree that that is a statistically significant warming? 3) Do you agree that the HadCRUT$ trend from 1998 to current is 0.083 ±0.172 °C/decade (2σ)? 4) Do you agree that the 1998 to current temperature trend shows no statistically significant difference from the 1970 to current trend? 5) Do you agree that the 1998 to current trend shows no statistically significant difference from the IPCC prediction for the current decade of 0.2 °C/decade? 6) Do you agree it is incorrect to interpret "no statistically significant warming" as meaning "no warming" given your answers to the above questions? 7) Do you agree that choosing 1998 (or any point in the half decade before 1998) as a start point for a temperature trend, by including a very strong El Nino in the early part of the record, and a sequence of moderate to strong La Nina's in the later part of the record, maximizes the noise relative to the signal and hence constitutes a "cherry pick" if you attempt to draw a conclusion of "no warming" from that data? Given the propensity of fake "skeptics" to simply go silent when their meme is refuted, readers can reasonably interpret your failure to answer the above questions as showing that you have been attempting to sow confusion on this thread.
  16. DSL @189, I have not strictly refuted the contention of a strawman argument. It is logically conceivable that when Carter claims the atmosphere is cooling in the quote I provided that he refers only to the period from early 2010 to 2011, ie, to a period featuring a transition from a moderate El Nino to a strong La Nina. What I do show is that Carter has said things which do imply a cooling atmosphere. Without referencing the original article, it is impossible to say whether or not Carter claimed that it was cooling from 1998 to 2006. Of course, without referencing that article, hutch44k has no basis to claim that the OP argues a straw man. Fortunately I have now found Carter's original article, and find that he wrote that "[T]here was actually a slight decrease [in temperature recorded by the HadCRUT3 index], though not at a rate that differs significantly from zero". On the purely technical point, Carter's claim about HadCRUT3 appears to have been wrong in 2006. The warming shown on the trend calculator from 1998-2005 is 0.065 ±0.482 °C/decade (2σ). Of course, that used HadCRUT3v, while Carter refers to HadCRUT3 (which differs slightly), but it appears unlikely that his claim was even technically correct. Even if it where, it shows the extreme nature of his cherry pick, relying not just on a particular temperature index but on a particular version of that index. It also shows he is using an interval in which the error range in calculating the trend is 2.4 times the IPCC predicted trend. No scientist cannot know that such extreme cherry picking, and that data with such large error margins cannot be used to make any valid scientific point.
  17. Tom, I stand corrected to the extent that Carter is being honest and open with regards to the intent of the publication (such as it was) of his analysis. If his dodgy methodology was an honest mistake and not an attempt to force the data into a politically palatable message for his target audience, well I humbly apologize to all involved.
  18. hutch44uk: "The argument wasn't about warming purely from non-ENSO sources." The argument is about determining whether or not there is continued warming. You choose to start your analysis from an anomaly and that artificial selection allows you to declare there is no statistically significant trend. A more objective analysis would look at all the data. A more informed and thorough analysis would process the data as FR2011 did or separate the signals as Nielsen-Gammon did, in order to detect the underlying trend. To ignore these analytical methods is to focus on the noise rather than the signal. But focusing on noise is the key component of denial these days, isn't it?
  19. I have recently been in an online discussion on another board with a contributor who tells me he has been crunching NCDC statistics. As a result he believes the 1940s were as warm as today. I've shown him GISS graphs and he's waved them away as based upon extrapolated data. He's been kind enough to post his graphs and charts on science20. In response to the recent news of May11-Apr12 being the warmest 12 months, as recently reported, he has posted http://www.science20.com/comments/107815/John_Samuel_%C2%B7_Says. And, in response to my pointing him to GISStemp data showing an increase from 1940-2010 he posted this, http://www.science20.com/virtual_worlds/blog/2011_5th_warmest_year_decades-87380, I've encouraged him to post himself to see if his findings bear scrutiny. He's demurred. Do any of the gentle readers have any comments?
  20. jsam: I would suggest posting direct links to the NCDC online and asking the contributor to explain why the information provided by agency that actually publishes the information he is using stands in such stark contrast to his conclusions. He should be able to explain how his number-crunching is methodologically superior to the NCDC if he expects his conclusions to be persuasive.
  21. John, I would invite Mike to examine the BEST data (land-only) available: [Source] 1940, in context, doesn't look all that warm compared to present temps {snip}. I caution you not to expect too much as he's a known ideologue who has bought heavily into that promulgated by the fake-skeptic blogs.
    Response: TC: Ad hominen snipped.
  22. Composer99 & Daniel - thank you both for your responses. I'd pointed him to other data sources and he dismissed them out of hand with comments such as "extrapolation is just guessing". So I've now simply disengaged. He expected me to trawl through is dataset and interpolate his method, but he won't acknowledge the peer-reviewed material. Life's too short. Daniel, your comment about Mike's leanings - I did a Google of his name and variants and some likely qualifying terms - and came up with nothing (unless he runs Arizona U). I've missed summat - how did you reach that very possible evaluation.
    Response: [DB] Try Patrick Lockerby's blog, The Chatter Box. Look for Mi Cro in the comments thread here...
  23. Thank you, Daniel. I've seen worse in a thread, for sure. But, yes, agreed, I've also seen much, much better. :-)
  24. The last paragraph of the post from Hutch44uk (#178) below, together with the extensive comment on this thread about evidence and statistical significance, prompts two questions, which hopefully will be discussed by supporters of both sides of the AGW issue. "hutch44uk at 22:02 PM on 30 April, 2012 Not that a sign of increasing temperature proves that humans are causing it, but just dealing with the argument.. The article starts with a straw man logical fallacy 'No, it hasn't been cooling since 1998.' implying that was Carter's position. No warming doesn't imply cooling. According to the latest HadCRUT4 data, there is no statistically significant increase in temperature (0.083C/dec +/-0.172C/dec). It is also stressed in the HadCRUT4 report that it cannot be said yet whether 2005 or 2010 are the hottest on record." Q1. A number of comments emphasise the relevance of a sufficient period of observations, in order to determine trends or stasis. Assuming the HadCRUT4 data referenced above is indeed correct, and assuming the quoted temperature increase and range of error remained constant, after what time would that data become statistically significant? The next question is wider, given the depth of technical discussion on this thread, but I think very relevant to the AGW issue. While most people rely on formal bodies for direction on scientific opinion (in the case of climate change, on the IPCC and national authorities), it is obvious that many contributors to this thread have the technical knowledge to form their own views independently (while obviously drawing on scientific and other published literature). Q2. If you have presently reached the conclusion that there is, or is not, significant anthropological global warming (AGW) occurring at present, whose primary mechanism is through the greenhouse gas effect (GHG), what credible data and information over what period would you require (rather than simply some authoritative opinion), for you to change your mind? I look forward very much to informed comment on these questions, as such will assist me in my own analysis. Thank you.
  25. Re: Peter42's comment #199: what credible data and information over what period would you require (rather than simply some authoritative opinion), for you to change your mind? I'm not sufficiently technically literate to avoid relying on the expert authority. However, as I noted upthread there are two fundamental elements which at the present time unequivocally demonstrate global warming: - the ongoing accumulation of heat in the ocean - the ongoing measured positive energy imbalance at top-of-atmosphere I expect either or both of these would have to be unequivocally trending negative, over a statistically significant period, before I would expect to see a major shift in position.

Prev  1  2  3  4  5  6  7  8  9  10  11  12  13  14  15  16  17  Next

Post a Comment

Political, off-topic or ad hominem comments will be deleted. Comments Policy...

You need to be logged in to post a comment. Login via the left margin or if you're new, register here.

Link to this page


The Consensus Project Website

THE ESCALATOR

(free to republish)


© Copyright 2024 John Cook
Home | Translations | About Us | Privacy | Contact Us