


 Arguments


Recent Comments
Prev 587 588 589 590 591 592 593 594 595 596 597 598 599 600 601 602 Next
Comments 29701 to 29750:
-
MrN9 at 00:23 AM on 26 April 2015Medieval Warm Period was warmer
Glenn Tamblyn and DSL. What my point is that what is being discussed here is the wrong "myth". It's not about people thinking: "The Medieval Warm Period was warmer than current conditions. This means recent warming is not unusual and hence must be natural, not man-made." ... People think something more like... "Oh look, people who talk about global warming pick and choose the data which they tell us about, and omit that which does not support their view so as to make their own view sound more convincing". Exactly how warm or not the MWP may or may not have been is irrelevant. Most will never understand the complexities of the issues, this is about trust...
-
DSL at 23:47 PM on 25 April 2015Medieval Warm Period was warmer
MrN9, it's also going a bit too far to claim that "many in the general public" are concerned about Gore's non-mention of the MWP. I'd guesstimate that less than 2% of the general adult public knows anything about the MWP/MCA, and most of those people could care less one way or the other. I ask my first year students (highly selective university) each semester if they can describe how the greenhouse effect works--just the basics. No more than one or two in 30 gets close.
-
mancan18 at 22:41 PM on 25 April 2015Lomborg: a detailed citation analysis
As well as the h-index, perhaps climate scientist credentials should also be determined by a SCL index, (Safe CO2 Level Index) as well, in which they are required to clearly state, with supporting scientific evidence, the CO2 level that they deem as "safe", while not adversely impacting the planet. Also, as a part of the index, they should be required to justify the economic and political approach needed in order to limit CO2 emissions to the level that they propose.
It seems to me that deniers and skeptics are never challenged to state, in their view, a "safe" level of CO2, and exactly how much more of the known fossil fuel reserves that we should burn. All they do is sow seeds of doubt and create confusion with the projections and evidence. In other words they run interference. Those who claim to be climate scientists should be made to nail their colours to the mast, so to speak. At least then it will be obvious who they are and where they stand. The trouble with Lomborg and his ilk is that they never clearly state what CO2 level they think is "safe". All they suggest is that it'll all be Ok, it's natural, or that there will be negligible warming, all with little real scientific evidence. All the while, we continue to increase our burning of fossil fuels and hence pump even more CO2 into the atmosphere.
In other words deniers and skeptics should always be asked how much, when do we stop, and how? Perhaps, these are also good questions for bona fide climate scientists to answer as well.
-
Glenn Tamblyn at 21:47 PM on 25 April 2015Medieval Warm Period was warmer
MrN9
"Actually I think more the concern that many in the general public have is that the Medieval Warm Period was not mentioned by Al Gore in his inconvenient truth and that the Medieval Warm Period is usually not mentioned by those pushing global warming"
Leaving aside that what Al Gore may have said about something or other, which has no relevence, the premise of you argument is that there was a Medieval Warm Period. Given that the topic is Global Warming, the question is - was there a MWP Globally?
Read the Intermediate rebuttal. Was there actually a MWP? The evidence suggests no.
So what is your point?
-
Tom Curtis at 19:19 PM on 25 April 2015Lomborg: a detailed citation analysis
thomaswfuller3 @12, are we playing a game of selective quotations? Here's my move:
"CUP surely carries an immense responsibility for the misinformation and public confusion that Lomborg’s book generated. Just referring to a standard referee procedure, as CUP’s employee Harrison (2004) does, is inadequate.
Referee procedures once in a while may fail in adequately judging the scientific quality of a manuscript. It is likely that the reviewers of CUP were impressed by the broad perspective, smooth writing style and amount of detail and never bothered to systematically check the latter. The overwhelming collection of unusually critical reviews by experts (as mentioned in this paper) could have been regarded by CUP as
an improved, ex post review procedure, and in response the publication decision might have been rectified. Nevertheless, the book is anyway sure to go down in history as an unreliable source of information and argumentation, being one of the most severely criticized texts issued ever by a prestigious academic publisher. Not particularly something to be proud of, neither by Lomborg or CUP.To close, the following brief statement perhaps best summarizes the Lomborg case:
‘‘The greatest regret I have about it all is the time wasted by scientists correcting the misinformation you created’’ (E.O. Wilson in a letter addressed to Lomborg (Harvey 2002))."J van den Bergh, Journal of Integrated Environmental Sciences, 2010 (Download)
Despite the claim that the Skeptial Environmentalist was peer reviewed, it was not a peer reviewed article, and therefore it should not have been included in Lomborg's h index. It certainly should not have been included multiple times, as must be done to achieve a h index of 21 for Lomborg.
As to claims that CUP are peer reviewed in any sensible way, that is a proposition I have held in doubt since they began publishing Intelligent Design Creationist tracts. Until such time as there is an open review of the CUP review process to ensure that their reviewers were relevantly expert, and were not chosen for a predisposition to pass the book under review, I consider their claims to have properly reviewed such a travesty of a book to be moot.
Moderator Response:Edited to correct line spacing.
-
MrN9 at 18:16 PM on 25 April 2015Medieval Warm Period was warmer
Apparently the myth is "Medieval Warm Period was warmer
The Medieval Warm Period was warmer than current conditions. This means recent warming is not unusual and hence must be natural, not man-made." ...
Actually I think more the concern that many in the general public have is that the Medieval Warm Period was not mentioned by Al Gore in his inconvenient truth and that the Medieval Warm Period is usually not mentioned by those pushing global warming. I think people see this as selective reasoning or confirmation bias and therfore find it difficult to trust what they are being told.
-
rkrolph at 18:12 PM on 25 April 2015Changes in water vapor and clouds are amplifying global warming
Glenn Tamblyn
Thanks for putting some numbers to this. Since clouds do have a cooling effect (although less in a warmer world), would it be possible that if cloud cover was underestimated for the future, then you could still get a net cooling effect. For example, using your numbers, if equivalent cloud cover was 20% greater, then you would have 66 watts/M2 cooling, and 44.4 watts heating, giving a delta of 21.6 watts/M2 net cooling, which would be greater than the current IPCC value of 20 watts/M2, and therefore a cooling feedback. It's not that I think this may be a likely scenario, but am just wondering if I am understanding this correctly.
I guess a simpler way of putting this would be asking if in the future we were to somehow artificially induce more clouds, would that help cool the planet, with everything else being equal?
-
thomaswfuller3 at 16:58 PM on 25 April 2015Lomborg: a detailed citation analysis
"we were surprised and disappointed to see the critics' letter being quoted in an issue of Time magazine (2 September 2002)... in which the authors repeated their charge that the book had not been peer-reviewed despite the assurances to the contrary that they had by then received by the press... It has become part of the anti-Lomborg folklore that this book bypassed the usual Cambridge peer-review process... This is a charge that is repeated in many of the public and private attacks in the press, and it is unfounded."
http://en.wikipedia.org/wiki/The_Skeptical_Environmentalist
-
chriskoz at 15:24 PM on 25 April 2015Lomborg: a detailed citation analysis
Thanks Corey for your good explanation of h-index.
Is said index realy representative of one's academic credentials? How about quality of cited work? We certainly have plainty of contararians whose work has been 'discredited'. However in order to discredit an article, you need to right another article where you have to cite the non-credible piece. Does such 'discrediting' citation count towards h-index? If so, h-index is not a good credibility measure.
-
Andy Skuce at 11:00 AM on 25 April 2015Lomborg: a detailed citation analysis
It's worth noting also that Dana wrote his papers in his spare time, not as part of his employment.
-
Tom Curtis at 09:47 AM on 25 April 2015Lomborg: a detailed citation analysis
Rob Honeycutt @7, why restrict it to very well known scientists. From the SkS crew we have Gavin Cawley with 26, Kevin Cowtan with 22, John Abraham with 17. Obviously the list is not exhaustive. Of particular interest, it excludes John Cook with 7 and he hasn't even completed his PhD yet. We even have Dana Nuccutelli who matches Lomborg's H index of 4, albeit with more papers (15 vs 7) , more citations (228 vs 190), is more active (h index of 4 since 2010 vs 0 for Lomborg), and walks all over Lomborg in number and quality of popular articles. Perhaps he should apply for 4 million dollars from the aussie government for his own consensus center? He certainly deserves it more than Lomborg.
-
Tom Curtis at 09:31 AM on 25 April 2015There's no empirical evidence
MA Rodger @280:
"This strongly suggests that the marked trashing of eco-systems over that period has not altered "ecosystem services" to any significant extent on a global scale."
Exactly!
Indeed, RedBaron's thesis is intrinsically implausible in that it requires biosphere sequestration of CO2 (by an unaltered biosphere) would go from just matching preindustrial LUC (at best) to matching industrial era emissions with a few years lag at most. It is thoroughly implausible that so sensitive a feedback mechanism would not either act as an inexorable pump of CO2 levels down to far below preindustrial levels, or result in wild fluctuations in CO2 levels on an annual and decadal basis. As neither has happened, presumably the feedback mechanism is slow, as is indicated by all the data.
Indeed, that is what we should expect. In principle, the Net Ecosystem Productivity (ie, the rate of Carbon sequestration) of an undisturbed forest will approximate to the rate of formation of coal. That is, it will be effectively zero. Immediately after it is massively disturbed, as by clear felling, it will become a carbon source, but will then become a large carbon sink with regrowth. However, within a few years or decades (depending on the rate of growth of the trees), it will decline as a sink, and approach the rate of sequestration of the formation of coal over time (if completely undisturbed). (See here, and also here.)
This pattern also applies to grasslands, with a possible (but not demonstrated by RedBaron) ongoing and slightly higher rate of sequestration due to the accumulation of soil carbon. Even there, however, carbon accumulation in soil is dependent on the rate of bioturbation, which implies such carbon soil carbon is outgassed at some rate depending on the rate of bioturbation at a given level. From that in turn it follows that even soil carbon will reach net zero sequestration given mature conditions, with a slight excess of sequestration if the soil is buried by sediment, and a slight excess of emission if it is eroded.
This pattern also means you cannot project high rates of initial sequestration in ecosystem reclamation projects (as in his linked article @278) forward as an expected sustainable rate. It will peter out rapidly for grasslands (excluding sequestration in soil), and over a few decades for forest. Soil sequestration will peter out more slowly, but will itself reach equilibrium over time.
The upshot is that the high rate of biosphere sequestration we see now is a consequence of prior degredations. Absent the regrowth of northern forests (particularly in the USA), it would be much smaller.
-
michael sweet at 09:30 AM on 25 April 2015Lomborg: a detailed citation analysis
For interest, the author of the OP has an h index of about 48 (obtained by counting the papers in his link above).
Obviously as you get a higher h index it is harder to get enough citations to raise your score.
-
Rob Honeycutt at 09:01 AM on 25 April 2015Lomborg: a detailed citation analysis
Andy... Ah, gotcha. I was tripping myself up because I kept trying to look up RB Alley, who also doesn't have a profile on Google Scholar. But I found Kerry Emanuel who, though he's 10 years older, has an h-index of 74. Or there's Jason Box, who is younger than Lomborg (not sure exactly how much), and has an h-index of 35.
That puts it more into perspective.
-
Tom Curtis at 08:58 AM on 25 April 2015It hasn't warmed since 1998
DarylLynch @338:
1) The upper ocean is heated by short wave radiation (visible light) from the sun. It cools by evaporation and by radiation of IR energy. Obviously the rate of cooling depends primarilly on its ability to transfer net energy from its skin layer to the atmosphere (which absorbs most of that IR energy). If you warm the atmosphere, you restrict the rate at which it can cool. Ergo it must warm to gain a new balance between incoming solar energy and outgoing (IR and evaporative) energy.
2) Cold water sinks because it is more dense. But salty water is more dense as well. When ice forms in the arctic (or antarctic) winter, the water becomes more dense due to the excess salt left behind by the freezing process, and sinks. (The arctic and antarctic water is already unusually salty because of evaporation as it travels from the equator). Further, winds over the ocean can generate substantial force. They act in some ways to drive surface waters to depth. I am, however, very unfamiliar with that process, so you are better of asking Rob Painting for details.
-
Tom Curtis at 08:49 AM on 25 April 2015Lomborg: a detailed citation analysis
For convenience, I redid Bradshaw's analysis. Here then are all of Bjorn Lomborg's academic papers, in reverse order of citation numbers:
- Nucleus and Shield (Game Theory) 141
- Game Theory vs Multiple Agents (Game Theory) 26
- Need for Economists to Set Global Priorities (Economics/ Environment) 9
- Environmental Sociology and Its Future (Economics/ Environment) 7
- Limits to Growth (Economics/ Environment) 4
- Simulating Multiparty Systems (Game Theory) 3
- Response to Yohe et al (Economics/ Environment) 0
Given that his first paper (Game Theory vs Multiple Agents) was published in 1995, that is a lamentable publication record. Two things to note. First, all of his game theory publications preceded 2000, when he clearly switched track from an academic career that was rapidly going nowhere. The second is that if we exclude his game theory articles, his Google Scholar h-index is zero. So, he has been given 4 million dollars without any competitive application process (ie, as a purely political decision) to set up an academic center in a field in which his h-index is zero, and in which he has only 4 academic papers.
-
DarylLynch at 08:28 AM on 25 April 2015It hasn't warmed since 1998
If its true that air heats up easier than water and heated air expands and rises , why would the Oceans store the heat and not the air ? What is the flaw in my logic ?, Does not heated water also expand and evaporate ?, Is the oceans heating up begin at the surface where the sun and the air have 1st contact ? If true then why is the heated water sinking down ?, is heated water heavier than cooler water ?, in my bath tub , the cooler water is at the bottom when it sits for a while before i get in, if i don't disturb the water and cause the warm and cold water to mix , i can let the cold water drain out , i'm not trying to prove anything, this is what i observe and what i was taught, i would like to be corrected any where i'm wrong, i have no desired comclusion , i desire only the facts and truth
Moderator Response:[Rob P] - The thermohaline circulation (partially explained by Tom Curtis) also has a wind-driven component to it. In areas of surface water convergence (the subtropical ocean gyres) the water cannot go anywhere else but down into the ocean interior. This is known as Ekman pumping and is a consequence of the fact that we live on a rapidly rotating sphere - something known as the Coriolis Effect. There is no magic taking place in the subtropical ocean gyres, the warmest water is still at the surface.
Much of this can be understood by watching simple lab experiments of water in tanks on a rotating platter - such as these conducted by researchers at MIT.
-
Andy Skuce at 07:50 AM on 25 April 2015Lomborg: a detailed citation analysis
Rob H: It would be interesting to know the h-index of some other prominent climate researchers that are somewhat close to Lomborg's age.
There are quite a few regular contributors to Skeptical Science who have H-scores above Lomborg's, some considerably higher. You can check out most scientists' H scores on Google Scholar. As the article notes, Lomborg doesn't have a profile there.
Considering that Lomborg is 50 and has been in some kind of academic or quasi-academic research job for twenty years, his peer-reviewed publication record is really quite mediocre.
-
Rob Honeycutt at 07:35 AM on 25 April 2015Lomborg: a detailed citation analysis
The idea that we can emit another 500 billion tons of carbon and still avoid catastrophe is absolutely insane.
I don't think it's as insane as you might think. It's certainly not going to be painless, that's for sure, but I believe it's widely accepted that this can be accomplished and keep us at least near the 2C limit.
See the Deep Decarbonization Pathways Project. These are definitely not insane folks.
-
TomR at 06:59 AM on 25 April 2015Lomborg: a detailed citation analysis
Thank you for an excellent article. I wish that there was some solid evidence that the tide was turning against the fossil fuel industry and their paid deniers. Reading the science, global warming is guaranteed to be extremely dangerous and yet the vast majority of the lay public don't realize what's coming. Our country and many others like Australia are doing very little. Even Europe is making much less progress than it appears on the surface. According to a University of Leeds study, the UK has lowered its carbon footprint only 7% below 1990, not the 29% claimed by government due primarily to the embodied footprint of imported goods. It's so discouraging. We all need to be carbon neutral now or as soon as humanly possible. The idea that we can emit another 500 billion tons of carbon and still avoid catastrophe is absolutely insane. I'm a retired psychiatrist, so I can diagnose insanity when I see it.
-
Rob Honeycutt at 06:22 AM on 25 April 2015Lomborg: a detailed citation analysis
It would be interesting to know the h-index of some other prominent climate researchers that are somewhat close to Lomborg's age.
-
ubrew12 at 04:40 AM on 25 April 2015Lomborg: a detailed citation analysis
British Petroleum has a 'Statistical Review of World Energy' which lists current oil reserves at 1.7 trillion barrels. At todays reduced price ($56/barrel), that is worth almost 100 trillion US dollars. And all of it under existential threat by websites such as this one. One has to wonder if some of that 'cheddar' doesn't find its way into bogus appointments such as Lomborgs.
-
Tristan at 01:42 AM on 25 April 2015University of Queensland offering free online course to demolish climate denial
I think If someone wishes to argue from religion, it requires you frame your response in that context.
Hence, I can think of two responses: God's covenant was that He would never again use a divine downpour to destroy life on Earth (Gen 9:15). He didn't say that the sea level won't rise at all due to the free will exercised by humans.
2 Corinthians 9:6 says "whoever sows sparingly will also reap sparingly, and whoever sows bountifully will also reap bountifully." If you do not tend your field, don't expect God to grace you with a fine harvest. If you don't look after the geosphere, don't expect the world's food supply to feed everyone.
-
John Hartz at 00:27 AM on 25 April 2015Changes in water vapor and clouds are amplifying global warming
Recommended supplemental reading:
The return of the iris effect? by Andrew Dressler, Real Climate, Apr 24, 2015
-
wili at 00:03 AM on 25 April 2015University of Queensland offering free online course to demolish climate denial
('her' not 'here')
-
wili at 00:02 AM on 25 April 2015University of Queensland offering free online course to demolish climate denial
Will it help me communicate with my students who claim that the promise God made to Noah proves that CC can't get that bad (without throttling here '-))?
-
MA Rodger at 22:14 PM on 24 April 2015There's no empirical evidence
Tom Curtis @277.
For a second time we use slightly different forms of analysis (I was assuming %(CO2 emissions), you %(drawn-down CO2) using Law Dome data) but I haven't before considered using ice core data to extend analysis of atmospheric levels back before the Keeling curve.
While the Law Dome data does show some curious wobbles, it does allow a calculation of sorts for the Atmospheric Fraction back into the 1800s. There is no evidence from such a calculation that there was some grand absorbing sink of CO2 existing back then. (There's even an SKS post from 2010 that does a similar analysis with the same outcome.) This strongly suggests that the marked trashing of eco-systems over that period has not altered "ecosystem services" to any significant extent on a global scale.
-
Glenn Tamblyn at 19:28 PM on 24 April 2015Changes in water vapor and clouds are amplifying global warming
rkrolph
Actually they aren't contradictory. There is a difference bewteen the net effect clouds have when the climate is in one state and the impact a change in their conribution has.
I am going on memory here but I think from the last IPCC report the contribution from clouds as 50 watts/m2 of cooling and 30 watts/m2 of warming for a net effect of 20 watts/M2 of cooling.
Now hypothetically, if in a warmer world the cooling aspect increased to 55 watts/M2 and the warming aspect to 37 watts/M2, the net cooling is now 18 watts/M2. A change of +2 watts/M2. So they have acted as a warming feedback because they now contribute less cooling.
-
rkrolph at 18:47 PM on 24 April 2015Changes in water vapor and clouds are amplifying global warming
Some statements in this article seem contradictory. It states "We know that clouds have a net cooling effect on the planet", but then says scientists describe clouds as "positive feedback". How can clouds have a net cooling effect yet be considered positive feedback? It seems like this study is saying clouds actually have a net heating effect.
-
Tristan at 14:43 PM on 24 April 2015Changes in water vapor and clouds are amplifying global warming
Here's what I wonder:
If the TLT measurements turn out to be underestimating warming (which seems likely), how does that impact the conclusions of the study?
-
barry at 11:41 AM on 24 April 2015Changes in water vapor and clouds are amplifying global warming
Interesting development on a thorny issue.
"This new work confirms the opposite; it turns out Dr. Dessler was correct after all."
Confirms? Wouldn't "corroborates" be more appropriate? This paper is one more step towards understanding. How does John Abraham know it is definitive? -
Thomas Huld at 08:08 AM on 24 April 2015Changes in water vapor and clouds are amplifying global warming
The links to the works of Dr. Dressler don't work here (they are active in the Guardian article). Some way to fix it?
Moderator Response:[JH] Link inserted.
-
Glenn Tamblyn at 07:20 AM on 24 April 2015University of Queensland offering free online course to demolish climate denial
ryland
Yes, the course will be strongly forum based. Participation in the forums is part of the assessment. And yes we will be moderating firmly.
-
michael sweet at 05:04 AM on 24 April 2015There's no empirical evidence
Red Baron,
You are not being silenced. If you want to continue the discussion you only have to cite peer reviewed papers that support your position. You must also address the data others have presented that argue against your position. In science you cannot continue to make unsupported claims and expect people to listen to you forever.
-
RedBaron at 04:32 AM on 24 April 2015There's no empirical evidence
Apparently I am being silenced now. Fair enough. I suspected it would eventually happen. As much as I would hope that science was free of politics, it isn't. I'll leave you with some empirical evidence and it will be up to you to figure out why it shows the flaw in your numbers without commentary from me. Because quite frankly I am not interested in debating on a forum where discussing different interpretations of the same evidence is not allowed.
Good luck
-
Andy Skuce at 03:10 AM on 24 April 2015Permafrost feedback update 2015: is it good or bad news?
Thank you, HK. I was looking for permafrost in the "north" of that figure and couldn't see it. It makes sense now.
Apologies to everyone for any confusion caused by me not seeing what's in front of my nose.
I have now updated my previous comment.
-
Permafrost feedback update 2015: is it good or bad news?
Andy:
Your figure from IPCC has the permafrost carbon in a separate box to the right of the vegetation/soils box and is estimated as ~1700 Gt. That brings the total soil + permafrost carbon up to 3200-4100 Gt, or very roughly 4-5 times the present reservoir in the atmosphere (~850 Gt), not very different from saileshrao’s calculation. It also implies that the permafrost contains between 41% and 53% of all soil carbon. -
Tristan at 01:15 AM on 24 April 2015University of Queensland offering free online course to demolish climate denial
I wouldn't be surprised if the discussion forums contained some robust (yet moderated) debate. That's usually the case with MOOC's that deal with any public policy area, regardless of what the content actually advances.
-
ryland at 23:20 PM on 23 April 2015University of Queensland offering free online course to demolish climate denial
In many university courses free discussion is encouraged where opposing views can be aired and debated. As there are many who are not entirely convinced of all aspects of AGW will that be the case with this MOOC?
-
Tom Curtis at 19:32 PM on 23 April 2015There's no empirical evidence
MA Rodger @276, I suggest you reread the first paragraph RedBaron's post @262, which I believe clearly indicates that he thinks anthropogenic emissions from LUC have followed a hockey stick. He can, of course clarrify this for himself.
I think he is furhter arguing that by reversing the degradation of the biosphere, it can absorb more than current FF + LUC emissions, thereby reversing global warming, but that that is for him a seperate but related thesis.
With regard to the biosphere in general, assuming that the biosphere is constantly fifty percent of the total sink, then the biosphere first becomes a net sink from 1942-1950. It returns to being a net sink again in 1960, and except for 1961, '67 and '68, remains so thereafter. I calculated this using CO2 concentration data from Law Dome. Using the same data and assumptions, the biosphere peaks as a source in the late 19th century, and follows a more or less linear trend downward since about the 1940s. Potentially it could be fitted to a quadratic after 1850, and presumably linear before 1850, making it an inverted hockey stick. If we take this seriously, that again contradicts either version of RedBaron's hypothesis. That is, LUC emissions have been an inverted hockey stick, not a hockey stick as required by the version you do not believe he holds; but also the biospheres capability to act as a sink has increased over time, contrary to that part of the theory we both think he holds.
Having said that, I do not think the assumption of a constant ratio of biosphere to oceanic sink is safe.
Moderator Response:[DB] RedBaron's response to you was moderated out due to repetitive sloganeering (multiple simple assertions lacking any credible support).
-
uncletimrob at 17:41 PM on 23 April 20152015 SkS Weekly News Roundup #17A
The practice of either shutting down or hobbling an organisation that doesn't agree with your political agenda of appointing a stooge into a potentially influential position are the hallmarks of several state and federal administrations here in Oz.
Abbot has never reacanted his rant "The climate change argument is absolute crap, however the politics are tough for us because 80 per cent of people believe climate change is a real and present danger" , so I can only believe that he is still the scientific ignoramus that he was back then in 2010.
-
MA Rodger at 17:38 PM on 23 April 2015There's no empirical evidence
Tom Curtis @275.
I think the term "hockey stick" used by RedBaron refers to the NH millenial temperature reconstructions and so means AGW. I don't think he refers to the atmospheric CO2 record.
My reading of what is being said @274 is that the levels of climate forcing from CO2 would be greatly reduced had not mankind done such damage to the biosphere around the world. Thus, "the ecological sink is far too small to actually counter Fossil Fuel emissions in its current degraded state."
The transition from the net LUC emissions & biosphere absorption being a source to becoming a sink depends on the ratio of chopping trees to burning FF. It is also dependent on the levels of absorption into the biosphere as CO2 levels rise. If we adopt a value of 25% for the proportion of our emissions currently absorbed by the biosphere, we can calculate a rough date for the biosphere becoming a net sink by using FF+cement emissions & LUC emissions - 1971.
I read RedBaron @274 arguing that the 25% value would be far higher had mankind not reduced the size of the biosphere by chopping it down or whatever. If the biosphere were, say, twice the size of its present diminished state, would it not absorb twice the CO2? With double the absorption, a the date of transition from source to sink occurs in 1930, even without adjustment to the LUC figures. Under such assumptions, if the biosphere were absorbing twice the amount of our emissions, the rise in atmospheric CO2 would be halved and atmospheric CO2 today would only be 337ppm.
Thus RedBaron concludes "the principle of the effect ecosystem services being capable of moderating atmospheric CO2 is proven by the very thing you mentioned." While this does amply demonstrate the influence of the biosphere on atmospheric CO2 levels, that is something I don't think is in dispute. And beyond that point, I don't see it supporting the various argument from RedBaron scattered down this thread.
-
Tom Curtis at 15:47 PM on 23 April 2015There's no empirical evidence
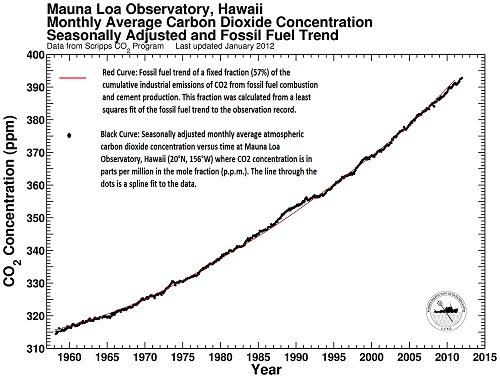
RedBaron @274, if, as you suggest, LUC was responsible for the hockey stick in CO2 emissions, except for the last two decades when LUC plus land absorption became a net sink, there would have been a marked decrease in the rate of increase of CO2 concentration over those last two decades. You, however, take evidence that over the last two decades LUC plus land absorption was a net sink as proof that LUC plus land absorption was a net source that overwhelmed fossil fuel emissions in preceding decades, and then seemlessly converted to a sink with no alteration in the trend in CO2 concentration. Such a large change from source to sink should also be visible in the isotope data, and also in the relationship between CO2 concentrations and the integral of fossil fuel emissions:
Evidently your "rebutal" of the O2 evidence depends entirely on ignoring the other available evidence. This is on top of your startling rebutal of the isotope evidence of "I just won't look at it, and will not accept anybody who does look at it has sufficient knowledge to determine that the evidence rebuts my theory". I think at this stage we can appropriately call your theory the invisible gardener theory of global warming. We can also appropriately note that there is no point discussing evidence with anybody who conspicuously refuses to note any evidence contrary to his theory (which has been shown to not be supported by your sources, to contradict isotope evidence extending back to well before the preindustrial, and to contradict exact evidence from the last two decades).
-
RedBaron at 14:23 PM on 23 April 2015There's no empirical evidence
@Tom,
You said, "it is known with certainty that the net effect of land interaction with CO2, including land uptake plus CO2 emissions from Land Use Change is a reduction in the amount of CO2 in the atmosphere, at least over recent decades."
I am glad you mentioned that actually. It in fact is the evidence of your error, but doubtful you are knowledgeable enough of other fields to understand this.
Temperate rainforests used to exist on almost every continent in the world, but today only 50 percent — 75 million acres — of these forests remain worldwide. Originally, 6 million square miles of tropical rainforest existed worldwide. But as a result of deforestation, only 2.4 million square miles remain. Between 2000 and 2012, 0.9 million square miles of forests around the world were cut down. That's roughly the size of all of the states in the U.S. east of the Mississippi River. Only 0.3 million square miles were replanted. There are only only four remaining intact temperate grasslands in the world and they are greatly reduced in size. For example the North American tallgrass prairie for all practical purposes is completely gone. About 5,000 years ago the great northern grasslands died out when humans exterminated the majority of the megafauna in the northern hemisphere, replaced now with boreal forest with shallow roots due to the thin soils. (luckily they can form peat at least) Most the grasslands of Austrailia that started desertifying 50,000 years ago due to the human eradication of Australia's megafauna were surveyed in the 1840's with many still containing deep A-horizons of 6%-20% SOM are now almost completely finished desertifying and contain usually around <1% SOM. The farmers of Australia now farm on sub-soil (B-horizon) as excepting a small band of tropical rainforest remaining, nearly all the top soil is now gone. China's Leoss plateau was completely destroyed (although now part of the largest ecosystem restorion project in the world) Green revolution agriculture is a carbon emissions source.
With all this and more ecosystem destruction world wide, the very few reminant functioning ecosystems left were still capable of making the entire terrestrial biosphere taken as a whole a net sink, at least over recent decades. Exactly like you said. But of course the ecological sink is far too small to actually counter Fossil Fuel emissions in its current degraded state. However the principle of the effect ecosystem services being capable of moderating atmospheric CO2 is proven by the very thing you mentioned. And inversly, the fact that human impact has largely destroyed that capability worldwide explains the hockey stick.
-
bozzza at 14:11 PM on 23 April 20152015 SkS Weekly News Roundup #17A
It is quite apparent the majority of Australia is appalled that the good name of UWA is now mud. The 'talking points' UWA have delivered to staff reveal this was a known quantity to have to deal with... given W.A. delivered the mining boom it will not be forgotten and will in my opinion be the continuing saga of what was always a global joke !
-
chriskoz at 13:45 PM on 23 April 20152015 SkS Weekly News Roundup #17A
Addendum to my @1. The news is developping fast:
Prime Minister Tony Abbott's office the origin for controversial Bjorn Lomborg centre decision
and confirms my opinion that our current PM should by default be blamed for all contrarian/science denying decisions.
PS: I appologise for mistyping Stephan Lewandowsky's surname @1. And would be happy if a mod could correct it.
-
chriskoz at 12:47 PM on 23 April 20152015 SkS Weekly News Roundup #17A
Signifficant story is developping on mitigation denial front:
Bjorn Lomborg, Abbott's Four Million Dollar 'Climate Contrarian'
also in smh: Bjorn Lomborg centre or the University of Western Australia
If I was affiliated with UWA, I would be outraged by Tony Abbott's efforts to introduce the climate change mitigation denialism into australian education system, and further force my uni to finance 2/3 of the cost.
John Cook, or Stephen, if you guys read it, can you explain what is the position of UWA on that story? Does UWA board really not mind bringing Lomborg's disinformation to their own classrooms at their own funding?
-
Tom Curtis at 08:46 AM on 23 April 2015There's no empirical evidence
RedBaron continues to make his discussion uninteresting by his refusal to grapple with the evidence. This is noteworthy in his dismissal of the isotope evidence (which is sufficient to refute his thesis) on the grounds that he has not examined the issue and he will have to wait till "somebody expert" examines the issue. Given that clearly unscientific attitude, there is little point of any discussion with him. Despite that, I will add yet another distinct line of evidence refuting his claims.
Specifically, consider the reduction in atmospheric oxygen concentration over time in relation to the increase in CO2 concentration over time:

As we would expect, combustion of fossil fuels results in Carbon combining with Oxygen to produce Carbon Dioxide, thereby decreasing the O2 and increasing the CO2. Naively we might expect O2 to decline equally with the increase in CO2 when we burn fossil fuels. While that is true enough for Coal, however, natural gas (CH4) and petrol also produce water as combustion products, decreasing the oxygen concentration further. In general, for each molecule of CO2 produced by combustion, two molecules of H2O will be produced from methane, and slightly over one molecule of H2O will be produced by the combustion of oil products. Because these ratios are known, and the consumpton of various fossil fuels are also well known, it is possible to calculate the expect loss of O2 relative to the expected gain in CO2 with relative accuracy.
Further, the ocean uptake of CO2 is also relatively well known, both by direct measurements of increases in Dissolved Inorganic Carbon, and by changes in the C13/C12 isotope ratios. Ocean uptake, of course, involves no reduction in atmospheric oxygen.
Finally, the actual decrease in O2 and increase in CO2 is well known from observations.
Having constrained the well known values, we then place severe constraints on the poorly known values. Of these, Oxygen outgassing by the ocean involves no change in CO2 concentration, and is very small. So small it is often neglected. The last value, net land uptake combines the effects of both photosynthesis (producing one O2 for each CO2 drawn from the atmosphere) or respiration/combustion which reverses the process. The important thing is that because the other constraints are well known (or near negligible), it is known with certainty that the net effect of land interaction with CO2, including land uptake plus CO2 emissions from Land Use Change is a reduction in the amount of CO2 in the atmosphere, at least over recent decades.
It follows for RedBaron's thesis that any underestimate of LUC emissions such as he is arguing for must be matched by an increase in photosynthesis compensating for the underestimte almost exactly. Ergo, whatever the merits of RedBaron's thesis that CO2 emissions from LUC are greater than current estimates, it has no consequence at all for net emissions, because the O2 evidence shows that CO2 fertilization, increased rainfall, NH reforestation and the green revolution combined result in the fixing of more CO2 than is emitted by LUC, whatever the estimate of LUC emmissions happens to be.
-
Tom Curtis at 08:05 AM on 23 April 2015New Video: The Trouble at Totten Glacier
michael sweet @3, there exists a geothermal hot spot under the West Antarctic Ice Sheet (WAIS) that generates heat flows as high as 0.08 W/m^2, and even hotter spots just off shore of the Antarctic Peninsula, where the heat flows may be as high as 0.095 W/m^2 (See fig 8 of Shapiro and Ritzwoller 2004). There has been subice volcanism associated with the hotspot under the WAIS as recently as 200 BC (Corr and Vaughan 2008). Because of that volcanism, the geothermal heat flow under the WAIS cannot be considered constant, and will peak at higher values in the case of volcanic erruptions. I am not aware of evidence of recent erruptions, however. Such erruptions would have been detected from associated earthquakes. Consequently, absent specific evidence to the contrary, there is no reason to believe that there has been a recent increase in geothermal heat flow at that location.
Even if there had been, of course, it would be almost irrelevant. Specifically, the topography is such that water melted by volcanism at that location will potentially lubricate the flow of the Pine Island Glacier, but that although:
"Pine Island Glacier lies in a deep subglacial trough, and this will isolate its subglacial hydrological system from neighbouring glaciers (Thwaites, Smith and Kohler). Therefore, even if continuous or episodic production of melt water from HMSV affects Pine Island Glacier, there is little likelihood that it could affect these neighbouring glaciers. It is thus possible that volcanic activity over HMSV contributed to some of the recent changes in velocity of Pine Island Glacier, but it cannot explain the widespread thinning that has been observed across these glacier basins in recent decades. We follow previous authors in favouring an oceanic driver as the likely cause for these changes."
(Corr and Vaughan)
In addition, there have been recently discovered (Schroeder et al, 2014) geothermal hotspots associated with Mount Takahe, and underlying the Thwaites glacier. The average inferred flux is 0.114 W/m^2, with hotspots exceeding 0.2 W/m^2. Given the association with Mount Takahe, whose last known eruption was in 5550 BC, it is unlikely though possible that that heat flow has increased recently. Certainly the rate of change of the heat flow has not been measured.
More generally, and of necessity, all ice sheets are "heated from below", although that heating may not rise above 0.02 W/m^2, and changes in the heating are likely to be a tenth or less of that. What is more, basic physics indicates that reduction of the thickness of the ice is likely to result in a lower heat flow at the base of the ice (although the rate of change is, if you will forgive the pun, glacial). The exception is where reduction in ice mass triggers volcanism, which is an interesting potential feedback ;)
Paisleg appears to have made the standard denier jump from "there has been newly discovered geothermal heat flow under the ice" to "the geothermal heat flow under the ice has suddenly increased"; and from "there exists a heating source in addition to that from global warming" to "the heating from global warming is irrelevant to what is going on". But are non sequiturs, and in addition extremely unlikely to be valid inferences. He will also be entirely unable to provide any evidence that either inference is justified.
Indeed, he goes even further and assumes that because some ice is heated by geothermal sources, it follows that that ice is not heated by global warming (even though there is clear evidence for both the Pine Island Glacier and the Thwaites Glacier that they are). The final clause of his post, therefore, is certainly absurd. I am unsure whether you are reacting to just that clause (which is simply false, and absurd) or the the whole sentence, the first clause of which is not false. Hence my discussion.
-
michael sweet at 05:18 AM on 23 April 2015New Video: The Trouble at Totten Glacier
Paisleg,
While the Antarctic sea ice is high, according to the NSIDC, it is currently lower than it was in 2014 so it cannot be record high. It is close to the record.
Since this post is about land based ice, and land ice is reponding to AGW differently than sea based ice I do not see your point. The land ice raises the sea level while the sea ice does not affect sea level.
Your claim about heating from below is simply false. Please provide a citation to support your absurd claim. Why do you believe such transparently false information? Think to yourself: why do you read material from people who deliberately mislead you with false information?
Prev 587 588 589 590 591 592 593 594 595 596 597 598 599 600 601 602 Next


