Climate Science Glossary

Term Lookup

Enter a term in the search box to find its definition.

Settings

Use the controls in the far right panel to increase or decrease the number of terms automatically displayed (or to completely turn that feature off).

Term Lookup

Settings


All IPCC definitions taken from Climate Change 2007: The Physical Science Basis. Working Group I Contribution to the Fourth Assessment Report of the Intergovernmental Panel on Climate Change, Annex I, Glossary, pp. 941-954. Cambridge University Press.

Home Arguments Software Resources Comments The Consensus Project Translations About Support

Twitter Facebook YouTube Mastodon MeWe

RSS Posts RSS Comments Email Subscribe


Climate's changed before
It's the sun
It's not bad
There is no consensus
It's cooling
Models are unreliable
Temp record is unreliable
Animals and plants can adapt
It hasn't warmed since 1998
Antarctica is gaining ice
View All Arguments...


Username
Password
New? Register here
Forgot your password?

Latest Posts

Archives

10 Indicators of a Human Fingerprint on Climate Change

Posted on 30 July 2010 by John Cook

The NOAA State of the Climate 2009 report is an excellent summary of the many lines of evidence that global warming is happening. Acknowledging the fact that the planet is warming leads to the all important question - what's causing global warming? To answer this, here is a summary of the empirical evidence that answer this question. Many different observations find a distinct human fingerprint on climate change:
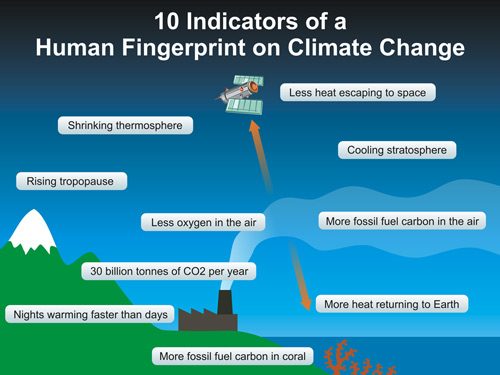
10 Indicators of a Human Fingerprint on Climate Change

To get a closer look, click on the pic above to get a high-rez 1024x768 version (you're all welcome to use this graphic in your Powerpoint presentations). Or to dig even deeper, here's more info on each indicator (including links to the original data or peer-reviewed research):

  1. Humans are currently emitting around 30 billion tonnes of CO2 into the atmosphere every year (CDIAC). Of course, it could be coincidence that CO2 levels are rising so sharply at the same time so let's look at more evidence that we're responsible for the rise in CO2 levels.
  2. When we measure the type of carbon accumulating in the atmosphere, we observe more of the type of carbon that comes from fossil fuels (Manning 2006).
  3. This is corroborated by measurements of oxygen in the atmosphere. Oxygen levels are falling in line with the amount of carbon dioxide rising, just as you'd expect from fossil fuel burning which takes oxygen out of the air to create carbon dioxide (Manning 2006).
  4. Further independent evidence that humans are raising CO2 levels comes from measurements of carbon found in coral records going back several centuries. These find a recent sharp rise in the type of carbon that comes from fossil fuels (Pelejero 2005).
  5. So we know humans are raising CO2 levels. What's the effect? Satellites measure less heat escaping out to space, at the particular wavelengths that CO2 absorbs heat, thus finding "direct experimental evidence for a significant increase in the Earth's greenhouse effect". (Harries 2001, Griggs 2004, Chen 2007).
  6. If less heat is escaping to space, where is it going? Back to the Earth's surface. Surface measurements confirm this, observing more downward infrared radiation (Philipona 2004, Wang 2009). A closer look at the downward radiation finds more heat returning at CO2 wavelengths, leading to the conclusion that "this experimental data should effectively end the argument by skeptics that no experimental evidence exists for the connection between greenhouse gas increases in the atmosphere and global warming." (Evans 2006).
  7. If an increased greenhouse effect is causing global warming, we should see certain patterns in the warming. For example, the planet should warm faster at night than during the day. This is indeed being observed (Braganza 2004, Alexander 2006).
  8. Another distinctive pattern of greenhouse warming is cooling in the upper atmosphere, otherwise known as the stratosphere. This is exactly what's happening (Jones 2003).
  9. With the lower atmosphere (the troposphere) warming and the upper atmosphere (the stratosphere) cooling, another consequence is the boundary between the troposphere and stratosphere, otherwise known as the tropopause, should rise as a consequence of greenhouse warming. This has been observed (Santer 2003).
  10. An even higher layer of the atmosphere, the ionosphere, is expected to cool and contract in response to greenhouse warming. This has been observed by satellites (Laštovi?ka 2006).

Science isn't a house of cards, ready to topple if you remove one line of evidence. Instead, it's like a jigsaw puzzle. As the body of evidence builds, we get a clearer picture of what's driving our climate. We now have many lines of evidence all pointing to a single, consistent answer - the main driver of global warming is rising carbon dioxide levels from our fossil fuel burning.

0 0

Printable Version  |  Link to this page

Comments

1  2  3  Next

Comments 1 to 50 out of 103:

  1. Thanks, John, that's the other half of the story that needs to be told (and it answers many of the questions that came up as a result of the NOAA report). I will, indeed, use your graphic in a powerpoint slide! :-D
    0 0
  2. "many lines of evidence all pointing to a single, consistent answer - the main driver of global warming is rising carbon dioxide levels from our fossil fuel burning" Many solar scientists I have read state that we don't know enough about the sun to make that conclusion. Solar radiation, on all levels and cycles, and its effects on Earth, are multiple and diverse, and poorly understood. This means one can't definitely distinguish between these two processes relating to global warming -greenhouse gases and solar variables, and therefore all of your above fingerprints could still be correct and yet greenhouse gases may still not be the main driver of global warming in the last several decades. I didn't say this, solar scientists are saying it.
    0 0
    Response: When I was putting together the various human fingerprints on climate change, I came up with nearly 20 different fingerprints. I ended up choosing the ones that were distinct to fossil fuels and greenhouse warming. For example, if the sun was causing global warming, we would see days warming faster than nights. We see the opposite - nights warming faster than days - a characteristic of greenhouse warming. Similarly, if the sun was causing global warming, we would see the upper atmosphere warming as well as the lower atmosphere. Instead, we see the upper atmosphere cooling as the lower atmosphere warms. Again, a distinct signature of greenhouse warming. The unique signatures we'd expect from solar warming are strikingly absent.

    I must confess, it still surprises me that people cling to the "sun is causing global warming" hypothesis. The fact that the sun has been cooling in recent decades coupled with the observations of all this heat trapped by greenhouse gases puts the matter beyond any doubt in my mind.
  3. Just another random query from me in regards to the graphic in the article... how is the shrinking thermosphere related to greenhouse warming? I would assume this would far more likely be due to variable space "weather"(variable UV through solar cycle etc) What is the proposed mechanism through co2?
    0 0
  4. thingadonta- There is another problem with your claim: it is "hearsay evidence". WHAT "solar scientists" are saying this? I haven't heard any. And there are certainly enough of them who agree with the conclusions of the IPCC and ALL the Science Academies of ALL the major developed nations: global warming aka "climate change" is real, and manmade CO2 is the major cause of it.
    0 0
  5. You're dead right Matt. Claiming that you've read "solar scientists" making these claims-without attribution-just doesn't wash. John has been kind enough to cite about a dozen references which all essentially say the same thing-current warming *cannot* be explained by changes in the heliosphere.
    0 0
  6. Great summary, John, many thanks! This is very interesting because the A in AGW is usually the crux of the social debate (there's no scientific debate). I guess that models should also be added as another evidence: models are able to replicate recent climate if anthropogenic forcings are included. Excellent inline answer in #2 too. I would add that, in any case, if the judge is to condemn a suspect, he doesn't need evidence that no other person could have possibly done it. He just needs enough evidence that this specific subject did it. The demand to show that no other thing could have done it is always unachievable (you never know whether we live in The Matrix and tomorroy the machines will just change the code of physic laws). The demand to show that everithing else didn't do it is just an inquisitorial probatio diabolica.
    0 0
  7. Joe Blog @3 - the increased Greenhouse Effect should trap more heat in the lower layers of the Earth's atmosphere, meaning less is reaching the upper atmosphere. This cooling effect in the upper layers causes the Thermosphere to contract. Some climate models predict quite severe cooling in the Thermosphere for a doubling of CO2 (40-60k)
    0 0
  8. re: Response to #2: "The fact that the sun has been cooling in recent decades coupled with the observations of all this heat trapped by greenhouse gases puts the matter beyond any doubt in my mind." Solar irradiance/solar heat output is almost certainly not the only solar variable that effects earth temperature. 1) We already have the idea about the increased solar wind, less cosmic rays reaching the earth, and lower cloud formation. Even if the theory is wrong, the concept itself is valid: less clouds due to solar effects other than heat, would mean higher earth temperatures. It would be difficult to distinguish this effect without longer term data on clouds, which is not available. So how could the issue be beyond doubt? 2) Another idea relates to the Sun's magnetic field, which has increased substantially over the 20th century (perhaps doubled). We don't know what effect this has had on Earth climate dynamics. (The Earth's magnetic field is also slowly declining, and is expected to once again flip poles in a geologically relatively short time-within the next few hundred thousand years, or so, apparently). 3) Recently, is was also widely reported that the earth's upper atmosphere had shrunk markedly more than was expected, associated with the last few years decrease in solar output. This suggests that perhaps the effects of solar variation is greater than we know, and also within current climate modelling. #4 and #5 The scientists who are stating this can be found on the net. Here is one: http://opinion.financialpost.com/2010/05/19/lawrence-solomon-solar-scientists-worldwide-working-to-counter-global-warming-hypothesis/. Another: "The sun is currently at its most active for 300 years. That, say scientists in Philadelphia, could be a more significant cause of global warming than the emissions of greenhouse gases that are most often blamed." http://anhonestclimatedebate.wordpress.com/2009/05/30/scientists-blame-sun-for-global-warming/ Of course, one can cherry pick the net to say anything, but I'm not personally convinced we know enough about the sun to draw the conclusions of J.Cook above.
    0 0
  9. #8 thingadonta, I think that all solar parameters vary in phase with solar activity (at least cosmic rays do), so we can say that there's no significant solar trend in the last 50 years. In any case, I find your points are pure speculation without any real evidence. You cannot base a hypothesis on what we don't know. What we know shows that the sun hasn't done it. I compare evidence in John's article and evidence in your comment and my conclusion is that that it is highly unlikely that the sun played a role and it is highly likely that the greenhouse gases have. Cheers
    0 0
  10. Dappledwater at 18:05 Thanks for the response, i did follow the link in the article on it, and it has the same reason stated as for the stratospheric cooling. Which is basically that co2 acts as an emitter at those molecular densities. It just seemed counter intuitive in the extreme upper atmosphere, because co2 is a relatively heavy molecule, and this is basically talking space, where i would have thought we would be looking more at atomic N and O. And i did read a something on the thermosphere, not that long ago, from nasa... and they had a different hypothesis. These things have a way o sorting themselves out with time though.
    0 0
  11. thingadonta wrote : "The Earth's magnetic field is also slowly declining, and is expected to once again flip poles in a geologically relatively short time-within the next few hundred thousand years, or so, apparently." They come at irregular intervals averaging about 300,000 years; the last one was 780,000 years ago. Are we overdue for another? No one knows.
    0 0
  12. #8 thingadonta Why not read the peer review? Papers on minor role of the Sun in recent climate change
    0 0
  13. #12 Hoskibui Thanks, this is a good resource of solar science. Thinking laterally, I would say if you want to convince the skeptics that it isn't the sun causing recent global warming, do more research on the sun. It's easy to get a research grant to see how c02 might affect marmots or lizards, but get a grant on how solar magnetics affect cosmic rays and the skeptics will be more easily convinced.
    0 0
  14. #13 thingadonta AGW observer also has a good resource on the non-significant role of cosmic rays in climate. It's actually a very good resource on many aspects of climate science - highly reccomended.
    0 0
  15. John: Great job as always, and on all fronts.
    0 0
  16. I have a query about number 6.
    If less heat is escaping to space, where is it going? Back to the Earth's surface. Surface measurements confirm this, observing more downward infrared radiation (Philipona 2004, Wang 2009). A closer look at the downward radiation finds more heat returning at CO2 wavelengths, leading to the conclusion that "this experimental data should effectively end the argument by skeptics that no experimental evidence exists for the connection between greenhouse gas increases in the atmosphere and global warming." (Evans 2006).
    In the picture, there is a caption, "Less heat escaping to space." But:
    "...the Earth must, on average, radiate the same amount of energy back to space."
    AR4 Ch 1, p 115 I may be in error to equate heat with energy in this case, but if I'm not wrong... the Earth is radiating the same amount of heat back to space, but it is happening at a higher level in the atmosphere. It's not that less heat is escaping to space, but that the relatively constant temperature lapse rate through the atmosphere means that the surface warms if heat loss occurs at a higher altitude. Have I got this right?
    0 0
  17. Solar radiation, on all levels and cycles, and its effects on Earth, are multiple and diverse, and poorly understood. This means one can't definitely distinguish between these two processes relating to global warming -greenhouse gases and solar variables, and therefore all of your above fingerprints could still be correct and yet greenhouse gases may still not be the main driver of global warming in the last several decades. I didn't say this, solar scientists are saying it.
    Have they postulated a mechanism whereby the sun cools the stratosphere as it warms the troposphere? Stratospheric cooling is one of the main rebuttals to 'it's the sun.' The whole atmosphere should heat if the sun gets hotter.
    0 0
  18. I would have been better quoting number 5, where a qualification has got me thinking.
    Satellites measure less heat escaping out to space, at the particular wavelengths that CO2 absorbs heat
    0 0
  19. Thinking laterally, I would say if you want to convince the skeptics that it isn't the sun causing recent global warming, do more research on the sun.
    Note how thingadonta reverses the normal burden of proof from the so-called skeptic to the mainstream scientific community. I can just as easily say "skyfairies are causing warming, though I have no evidence, no proposed mechanism that has withstood scrutiny, and there is no increasing trend of observed skyfairies. In order to convince me that skyfairies are *not* the cause of recent observed warming, *you* must get a grant to study skyfairies and prove that they are not the cause". And thingadonta wonders why "skeptical" blog "science" gets no respect ...
    0 0
  20. John, this was a great post and should get more coverage. I wish there were more posts like this addressing these issues at real climate and climate progress. It would be nice for a news article to step up to the plate and really discuss each of these issues and why we know that certain things are signatures of human effects. It would also be interesting to see if there is a difference between early 20th century warming versus late in terms of days warming faster than nights in the early parts if it was indeed caused by increased solar irradience and the AMO.
    0 0
  21. I think it'd be great if someone could find this paper http://www.opticsinfobase.org/abstract.cfm?URI=FTS-2009-FWA4 Observations of Climate Radiative Forcing from Ground and Space Wayne F. Evans Abstract The observation and monitoring of the radiative forcing of climate from greenhouse gases at the top of the atmosphere and at the surface by FTS is presented. but my library doesn't have the rights to it. would be interesting for this sort of discussion.
    0 0
  22. Robert Way, the Evans paper appears to be a conference proceeding, and might be no more than an abstract. Not peer reviewed.
    0 0
  23. While working on the German translation for John's neat graphic, I became unsure of what "30 billion" stands for. Is that 30,000,000,000 (as in the US) or 30.000.000.000.000 (as in Germany)? At a guess it's the number with "only" 9 zeroes, but I'd like to make sure as it either translates to "Milliarde" or "Billion".
    0 0
    Response: 9 zeroes
  24. BaerbelW - that 30 billion should be 30*10^9. 30,000,000,000,000 would be 30*10^12, or in English/American usage 30 trillion.
    0 0
  25. Great resource for a climate change presentation. Thanks John.
    0 0
  26. BaerbelW - 30 billion tonnes = 30*10^9 = 30 Gt = 30 milliarde Tonnen
    0 0
  27. Thanks, KR and Alexandre! I had checked the German Wikipedia-entry for Billion and it calls this term a "false friend" because it has different interpretations depending on where it is used (no mention of Australia and ambigious information for the UK). Unfortunately, there wasn't a direct link to an English article, so thanks much for your link, KR.
    0 0
  28. Re: Barry @ 16 Yes, the radiation equation must be in balance. In the case of increasing CO2 concentrations, that balance occurs at the TOA (Top Of Atmosphere) at increasing height relative to lower concentrations. Chris Colose has many useful things to say about this at his blog Climate Change. Posts are available for varying levels of comprehension. Even I can understand some of them. :) The Yooper
    0 0
  29. thingadonta at 18:07 PM on 30 July, 2010: The last link you provide (http://anhonestclimatedebate.wordpress.com/2009/05/30/scientists-blame-sun-for-global-warming/) is a 2009 blog that uses as evidence an old BBC article dragged up from Feb 1998. That article refers to 'scientists at a meeting' of the American Association for the Advancement of Science but gives no details of who they are. I think you'll have to do better than that if you want to persuade anyone.
    0 0
  30. Barry: The Earth is currently in energy imbalance. Less heat is emitted than received from the sun. To restore the balance, the Earth must heat up so that the same amount of energy is emitted as received (the Earth emits more heat when it is warmer). This heating up is Global Warming. Since we measure an energy imbalance at the top of the atmosphere (TOA), this is strong evidence of global warming.
    0 0
  31. #30: "This heating up is Global Warming. Since we measure an energy imbalance at the top of the atmosphere (TOA), this is strong evidence of global warming." Here is additional direct evidence of global warming (and I must thank BP in the prior thread for his remarks about snow cover (comment #91) for reminding me about that dataset. Look at the NH snow cover for winter vs. the NH snow cover for spring While I'm not a fan of straight line trends through such data, let's accept them as is for the sake of discussion. The winter snow extent is thus virtually constant; the spring decreases significantly. Hence for any given melt season, the difference (spring min areal extent - previous year's winter max areal extent) is increasingly negative from year to year. Similarly, for any given snow season, the corresponding difference (winter max areal extent - same year spring min areal extent) is increasingly positive. We have just described an oscillating system (winter max to spring min to winter max) with increasing amplitude. In such systems, increasing amplitude requires a gain in system energy. This begs the question: What supplies the additional energy, especially during a 50 year period of declining solar radiation? This figure was discussed at length here. Answer: As less energy is available from the sun, an increasing percentage of that energy must be stored in the atmosphere/oceans from year to year and thus they are getting warmer. None of those 'questionable' temperature records needed! Oh but wait a bit, the temperatures say the same thing.
    0 0
  32. #30 michael sweet at 12:29 PM on 31 July, 2010 Since we measure an energy imbalance at the top of the atmosphere (TOA), this is strong evidence of global warming. Come on. We do not measure it in any meaningful sense of the word. Why disseminating misinformation? AMERICAN METEOROLOGICAL SOCIETY March 2009 BAMS | 311 EARTH’S GLOBAL ENERGY BUDGET by Kevin E. Trenberth, John T. Fasullo, and Jeffrey Kiehl "There is a TOA imbalance of 6.4 W/m2 from CERES data and this is outside of the realm of current estimates of global imbalances" That is, energy imbalance at the top of the atmosphere (TOA) is measured to be 6.4 W/m2, but that's impossible. Therefore accuracy of measurement is so low, that imbalance is not measured at all. Precision is a bit better, but that only gives temporal changes of TOA imbalance, not its absolute value. As far as radiation measurments are concerned, imbalance can even be negative, that is, Earth would lose heat instead of gaining it. It's only computational climate models that tell us otherwise, not measurements. OHC (Ocean Heat Content) measurements are also consistent with a negative energy balance.
    0 0
  33. muoncounter #31 michael sweet #30 BP is correct about the TOA imbalance not being 'measured' - but implied by models. Dr Trenberth's 0.9W/sq.m is a net of several theoretical warming and cooling forcings and feedbacks including radiative cooling from the 0.75 DegC warming of the Earth since preindustrial times when the CO2 concentration was about 280ppmv. Your Temperature vs. Solar Activity chart could be looked at this way: The integral of a constant energy flux is a linear rise in total energy. If temperature is roughly proportional to energy input (which is so with specific heats of materials) then a rising temperature curve is no surprise. Assume your baseline 11 year moving average TSI is 1365.5W/sq.m. Ignore the 11 year solar cyclic variation. It rises to about 1366W/sq.m from 1920 to 1950 and flatlines on a slightly falling trend up to date. The integral of the area under this curve (divided by 4) is roughly the total Solar energy added to the Earth system since 1920. A TSI difference of 0.5W/sq.m divided by 4 = 0.125W/sq.m which equals about 20E20Joules/year. For the 1920-1950 period this sums to about 300E20 Joules. For the 1950 - 2005 period this sums to about 1100E20 Joules. Total - roughly 1400E20 Joules. Dr Trenberth estimates that in the 2004-08 period total energy absorbed by warming land is 2E20 Joules/year, and melting total land ice is 2E20 Joules/year and Arctic Sea Ice is 1E20Joules/year. Total for all three: 5E20 Joules/year. OHC increase is highly uncertain however let's use his estimate of 20-95E20 Joules/year. Using an average of say 58E20 for OHC plus 5E20 for all other sources - we get 63E20Joules/year of energy absorbed by OHC increase and all the ice melt and land warming. We have Solar imbalance energy input since 1920 of roughly 1400E20 Joules divided by 63E20 Joules/year (at 2004-08 rates) = 22 years equivalent. The majority of the warming has occurred over the last 30 years, so 22 years equivalent solely attributable to Solar at the 2004-08 rate is highly significant.
    0 0
  34. Worth noting, temporal changes of TOA flux could tell us something useful. The integral of a constant energy flux is a linear rise in total energy. If temperature is roughly proportional to energy input (which is so with specific heats of materials) then a rising temperature curve is no surprise. Needs to take into account radiation; for an object radiating IR temperature will not be directly proportional to energy input. So a constant energy flux will not produce a linear rise in total energy, not for Earth anyway.
    0 0
  35. #33: "The integral of [area under] this curve (divided by 4) is roughly the total Solar energy added to the Earth system since 1920." Isn't a significant fraction of TSI (30% as shown below) reflected back into space? The papers cited at Argument #1 give significantly different conclusions from yours.
    0 0
  36. muoncounter #35 You are right about the 30% of TSI reflected out to space. I realized the error after posting and shutting dowm for the night. The figures I quoted should reduce from 1400 E20 Joules to approx 1000 E20 Joules, and the time from 22 years to about 15 years. Still significant I would have thought.
    0 0
  37. I find it interesting that water vapour and clouds are not mentioned as being measured fingerprints. Irrespective of what CO2 levels are currently doing, AGW depends on the amplifying effect of water vapour. Is their absence acknowledgment that perhaps water vapour and clouds may not be part of the human fingerprint? With regards to solar activity perhaps the most relevant measure is the AA index which tracks the solar coronal magnetic field strength.
    0 0
    Response: I could only fit 10 fingerprints in that picture. I'm now planning a sequel, "10 more human fingerprints on climate change".
  38. Thanks for the replies. Let's see if I have this right... There is currently an imbalance between the amount of energy coming from the sun, and the amount of energy being radiated by the Earth/atmosphere, because CO2 increase has prevented some long-wave radiation escaping to space. If we were to freeze all CO2 emissions today, global temperatures would increase for a while until the atmosphere was in radiative balance with the incoming solar energy. With photons zipping in every direction at the speed of light, being absorbed and re-emitted by gas molecules in the atmosphere, why isn't equilibrium established quickly? Is it that the surface is slower to warm, thus keeping the atmosphere cooler and out of radiative balance with solar energy?
    0 0
    Response: You've pretty much got it right. The reason why the climate takes a little while to return to equilibrium is because the oceans have a great deal of thermal inertia - as our climate is accumulating heat due to the energy imbalance, it takes a while for the oceans to warm up to the point where our planet is once again radiating enough energy to match the incoming sunlight.
  39. johnd #37 The carbon fingerprinting in parts relates to the proportion of C14 isotope in the atmosphere showing that the increase in carbon content of the atmosphere is caused by the burning of fossil fuel (which is C14 depleted due to its age). The second part of the "fingerprinting" which is more a model prediction borne out by observation, is that the increase in night time temperatures should be greater than the increase in day time temperature (solar effects would be opoposite to this). These are long term measurable things. We don't have the same radioisotope measurement capability for the water cycle, and the water cycle is probably more complex than the carbon cycle.
    0 0
  40. I find it ironic that BP says we should discard Trenberth's careful, professional, peer reviewed estimate when he (BP) frequently says we should accept his amateur, back of the envelope, unreviewed calculations in the interest of advancing knowledge. In this case I think we should go with the peer reviewed estimates rather than throw up our hands and say our measurements have too much error, we know nothing. As better data becomes available we will have less error. One of the purposes of making such estimates is determining where to put effort at measuring the heat flux. While it is not possible for me to evaluate Trenberth's error, in my experience the first estimates of data often turn out close to the final estimates. When I look at past climate data estimates they are almost always conservative (they error on the cooling side, not the warming side). I expect this to be the case here also.
    0 0
  41. Excellent post, but I have one reservation. A skeptic could accept all of the above, but argue that a doubling of CO2 would only cause 1.1-1.2C of warming, which is the basic figure if you just consider the effect of the extra CO2 without any feedbacks. It's the feedbacks that magnify a merely worrying 1.1C rise to a possibly catastrophic 3C (with a considerable degree of uncertainty, admittedly). So I'd like to see more explanation about the evidence we have for positive feedbacks, which is discussed elsewhere on this site.
    0 0
  42. #41: "a doubling of CO2 would only cause 1.1-1.2C of warming," CO2 has been increasing at an average of approx 1.5 ppm/year for the last 50+ years. Keeping that constant you'd expect to double (say from 330ppm to 660ppm) in 220 years. Some people argue for locally higher rates of global temperature increase, but one figure you often see is 0.13C per decade. So 22 decades gets you 2.9C hotter. Unfortunately, the rate of CO2 increase is edging up towards 2ppm/yr.
    0 0
  43. @Bern I live near a major astronomical observatory, on La Palma, in the Canary Islands. I asked the head of one of the solar telescopes here (the Dutch Open Telescope http://en.wikipedia.org/wiki/Dutch_Open_Telescope) for his opinion on global warming. He said that he's not qualified to say what's causing it, but it's certainly not the sun. The sun has been unusually cool for the last 50 years or so. He must know what he's talking about.
    0 0
  44. One doesn't need to be very sceptical to require an answer to topqquark's question at #41 : evidence for positive feedbacks.
    0 0
  45. Re #41, the effect of water vapor can be calculated as for any other GHG. After that, you need to look for increased water vapor, and of course confirmation is good to have. Increases in middle atmospheric water vapor as observed by the Halogen Occultation Experiment and the ground-based Water Vapor Millimeter-wave Spectrometer from 1991 to 1997 Increase in lower-stratospheric water vapour at a mid-latitude Northern Hemisphere site from 1981 to 1994 Radiosonde-Based Northern Hemisphere Tropospheric Water Vapor Trends Tropospheric Water Vapor Climatology and Trends over North America: 1973–93 Trends and variability in column-integrated atmospheric water vapor Atmospheric Water Vapor over China Positive water vapour feedback in climate models confirmed by satellite data Global Cooling After the Eruption of Mount Pinatubo: A Test of Climate Feedback by Water Vapor
    0 0
  46. So CO2 continues to rise and water vapour rises to magnify the warming. Unless there's a cloud on the horizon, it can't be long before temperatures rise to statistically significant levels.
    0 0
  47. There are many results indicating statistically significant temperature change, Alan. Global observed changes in daily climate extremes of temperature and precipitation Global Trends of Measured Surface Air Temperature Global rural temperature trends Maximum and Minimum Temperature Trends for the Globe Global temperature change and its uncertainties since 1861 Trends in global temperature Global temperature change Global Warming Trend of Mean Tropospheric Temperature Observed by Satellites Quite a few not mentioned. What's interesting is how old many of these findings are yet a lot of people are not aware of them, even so-called skeptics who ought to be the first to go find out what the facts are. A well-armed skeptic should look at everything before making assertions.
    0 0
  48. Doug I think you are right. It would be good to see the cloud issue settled before high confidence is declared. IPCC. Clouds, which cover about 60% of the Earth’s surface, are responsible for up to two-thirds of the planetary albedo, which is about 30%. An albedo decrease of only 1%, bringing the Earth’s albedo from 30% to 29%, would cause an increase in the black-body radiative equilibrium temperature of about 1°C, a highly significant value, roughly equivalent to the direct radiative effect of a doubling of the atmospheric CO2 concentration
    0 0
  49. Well, so far clouds don't seem to be doing the job for us. I hope water vapor makes up its mind soon whether or not to condense and where, heh! Thinking on clouds seems to have converged on the notion that altitude counts for a lot, w/high altitude clouds being a net positive forcing agent versus low altitude clouds, and that longwave vs. shortwave cloud forcing works in opposition, w/net effects sometimes canceling and sometimes not. Optical depth is important. Here are a few papers on the topic: The Influence of the 1998 El Niño upon Cloud-Radiative Forcing over the Pacific Warm Pool Cloud Radiative Forcing of the Arctic Surface: The Influence of Cloud Properties, Surface Albedo, and Solar Zenith Angle Altitude dependence of surface radiation fluxes and cloud forcing in the alps: results from the alpine surface radiation budget network Sea Surface Temperature and Large-Scale Circulation Influences on Tropical Greenhouse Effect and Cloud Radiative Forcing Interestingly, altitude effects are sufficient that aircraft contrails become an matter for examination w/regard to minimizing their formation: The impact of cruise altitude on contrails and related radiative forcing
    0 0
  50. Yes. Hard to say what has damped the CO2 and vapour effect for the last fifteen years. I'm not sure if ACO2 behaves itself either. Unlike natural CO2, of course. The oceans cheerfully exchange 90 gigatons natural CO2 each year though they appear to miss half the ACO2. IPCC: In current models, the uptake of anthropogenic CO2 is controlled mainly by physical transport and surface carbon chemistry, whereas the natural carbon cycle is controlled by physical,chemical and biological processes.
    0 0

1  2  3  Next

You need to be logged in to post a comment. Login via the left margin or if you're new, register here.


The Consensus Project Website

THE ESCALATOR

(free to republish)


© Copyright 2024 John Cook
Home | Translations | About Us | Privacy | Contact Us