


 Arguments


2015: Still No Let Up in Ocean Warming
Posted on 7 October 2015 by Rob Painting
Ocean warming has made up 93% of global warming in the last 5 decades (IPCC AR5 Chapter 3) and the first six months of ocean heat data for 2015 are now available from the National Centers for Environmental Information (NCEI). Armed with the knowledge that increasing industrial greenhouse gas emissions trap ever more heat in the atmosphere and ocean, it will come as no surprise whatsoever to learn that the strong ocean heating of recent years has continued into 2015.
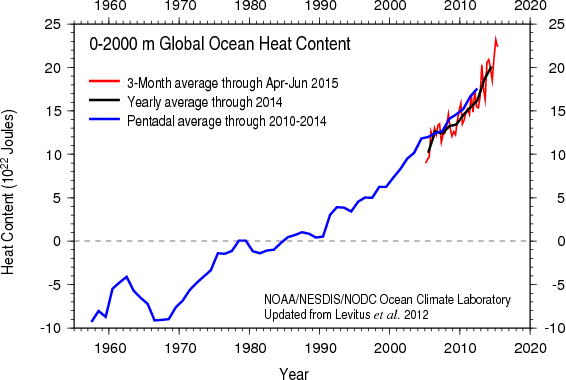
Figure 1 - Ocean heat content data up to June 2015 for the 0-2000 meter layer of the global ocean. Image from NOAA's National Center for Environmental Information.
In contrast to the Northern Hemisphere, the surface area of the Southern Hemisphere is dominated by the ocean and it's therefore the end of Southern Hemisphere summer, when that hemisphere is closest to the sun, that ocean heat uptake is strongest. Loeb et al (2012), however, demonstrated that outgoing longwave radiation (heat loss) from the Earth increases during El Niño, so it will be interesting to see how things pan out over the next 6-8 months given that we have a powerful El Niño still developing in the Pacific Ocean. We may see a temporary reduction in the rate of ocean warming as the El Niño discharges a greater-than-normal amount of tropical ocean heat to the atmosphere. Inevitably, much of this surplus heat will be radiated out to space.
Figure 2 - Variations in top-of-the-atmosphere radiation over 2000-2010 for the tropics (30° North-30°South. The shaded area (MEI) denotes positive (El Niño) & negative (La Niña) ENSO conditions. ASR=absorbed solar radiation, -OLR=negative outgoing longwave radiation & NET=net radiation anomaly. The feature to note is the gain in planetary energy with La Niña and loss with El Niño. Image adapted from Loeb et al (2012).
Also of interest, and directly connected with increasing ocean heat content due to the expansion of seawater as it warms, is global sea level rise - see Figure 3.
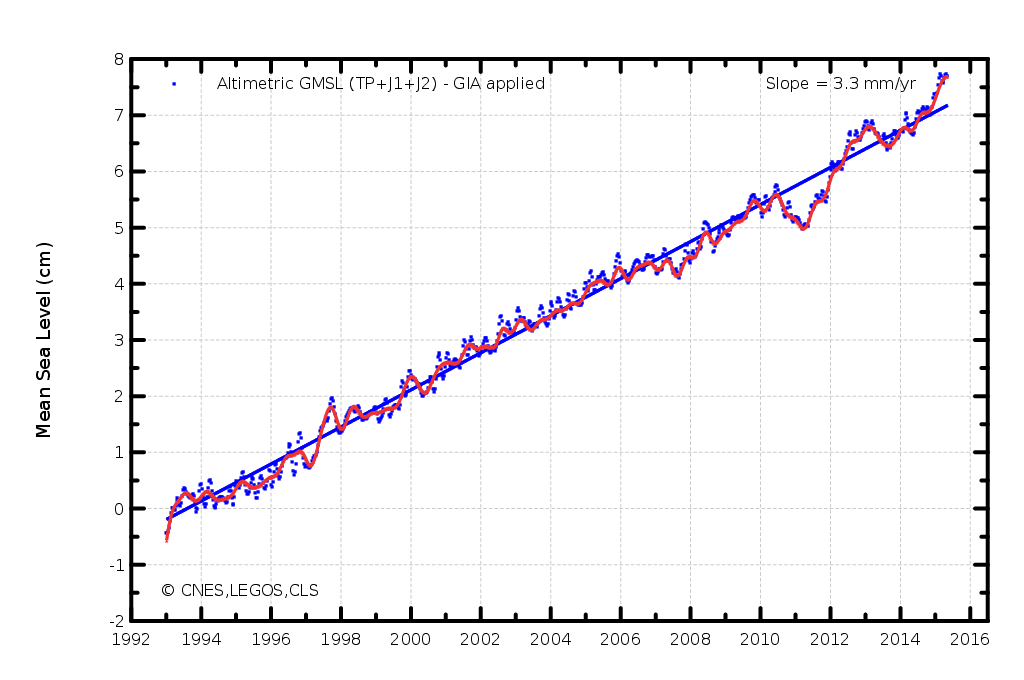
Figure 3 - Sea level rise from 1993-2015 based on satellite altimetry. Image from AVISO.
The large year-to-year fluctuations shown in the graph are caused by short-lived water mass exchanges between the land and ocean. With La Niña anomalous precipitation falls over land, therefore lowering global sea level, and with El Niño this precipitation is concentrated over the oceans, raising sea level as the continental basins dry out and water drains back into the sea.
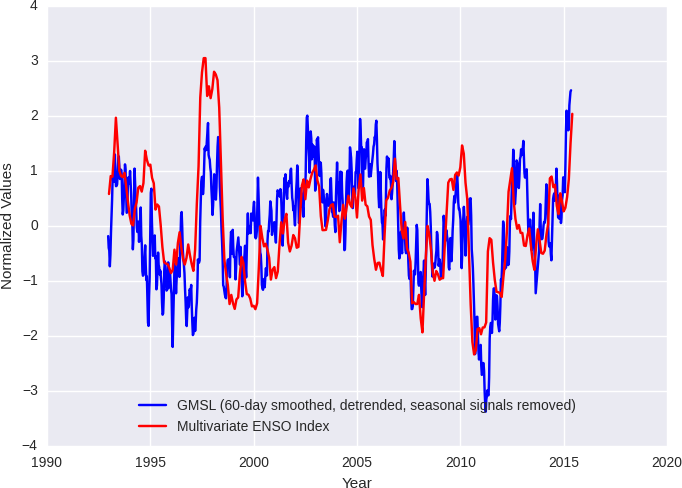
Figure 4 - Detrended global mean sea level and the multivariate ENSO index (a measure of El Niño/La Niña conditions). The short-term sea level fluctuations correlate well ENSO due to the change in spatial patterns of precipitation. Image from the University of Colorado.
Based on scientific understanding of the climate system, it is anticipated that ocean heat content and sea level rise will fluctuate from year-to-year around a long-term increasing trend. So don't expect to see any real let up in ocean warming until humanity takes serious action to drastically reduce the ongoing industrial greenhouse gas emissions that are causing it.


Oh God, I can just see the comments of the contrarians on those graphs! And, I'll bet I can tell anyone which parts of the graphs will be selected to show that "the books have been cooked' or some such rubbish
Anyway back to normality - thanks for an informative post
Tim
There is an asymptote in Figure 1 - which looks incredibly scary. Would any of the experts monitoring this site provide comment?
It is not an asymptote - just an illusion from noisy data. Look at the blue and black lines. Expect to see the vertical scale expand however.
@RobH I've not seen assymptotic behavior used by conrtarians - why did you alert them to it?
uncletimbrob @4, I, on the other hand, have seen deniers use claimed assymptotic behaviour as an argument. There is the claim that Sea Surface Temperatures have an upper limit just over 30oC; and the claim that the greenhouse effect is saturated. They do not use the language of assymptotes, but clearly the idea underlies their thinking. Having said that, I do not think a vertical assymptote in OHC, that forces greater and greater increases in OHC with less and less forcing, will be appealing to deniers. Nor is if physically possible (apparently contrary to RobH @2).
Hi, what does 17*10^22 joules mean in degress C or K?
Thank you.
The OHC is derived from integration of temperature profile which of course means warmer at top. So when you ask for C, then temperature where? Or perhaps more importantly, why do you ask? If you want to how OHC is derived from ocean temperature measurement, then try this. If you want to know how accurately can you determine OHC given accuracy of measurement and float distribution, then try here with more recent discussion here.
Most non scientist live in a degree world, not a joules world. Does that make sense?
found it ..thanks for the links.
Appreciate that but temperature and energy are not same thing. Hence the "hiroshima bombs", Earthquakes, dynamite etc in the heat widget to the right of the screen.
In Levitus et al., 2012 it says in section 3 that the ocean temp has increased 0.09C since 1995. To the layman like myself I look at that number and say “what’s the big deal?” Anyone want to help me understand why it is a big deal?
Ok, I now understand that heat is energy and this small increase in temp means a lot of energy when spread over the entire ocean. The oceans held heat energy before 1985, so why the zero on the y axis and what difference does it make?
That is 0.09C averaged over all oceans down to 2km deep. (That amount of energy stored in the atmosphere instead of ocean would make us a fireball). Now this does not mean that oceans are going to boil anytime soon but then no one said they would. The IPCC reports detail the implications of continued temperature rise.
What is does do is confirm the energy inbalance and that it is at a rate consistent with calculated change in climate forcings. It means that earth will continue to warm till the energy does balance. The measure is interesting too because surface temperatures (where we live) are subject to a lot of internal variability (you dont need to transfer very much heat from ocean to atmosphere to warm up surface temperatures a lot as in say an El Nino) but the ocean heat content is a much better, less variable, indicator of the overall energy balance.
"The oceans held heat energy before 1985, so why the zero on the y axis and what difference does it make?"
The OHC is an anomaly measurement. (An absolute measurement doesnt make a lot of sense). So what is measured is change of temperature since 1985 (or whatever the baseline is - I dont remember),and that is then converted to change in the amount of energy stored. Ie 17E22 Joules isnt the total energy stored in oceans (whatever that would mean), but the amount that has accumulated in the oceans since 1985.
the energy imbalance caused by excessive CO2 production?
Ok to #14...and thank you for your time.
"the energy imbalance caused by excessive CO2 production?"
More precisely, caused by the net change in forcings, natural and anthropogenic, of which GHG, especially CO2, is the biggest component.
See this graph for the detail.
I do not understand the expression "forcings." Would the following expression work too: "More precisely, caused by the net impact of natural and anthropogenic..."
thanks for your time this evening... I will be back reading this site again later this week.
Forcings - if earth system is in equilibrium, (energy in = energy out), then 30-year temperature trend would be flat and the variations you see are those due to the uneven heating of a mostly water-covered planet. Forcings are a way of expressing perturbations to this energy balance - usually expressed as top-of-atmosphere energy fluxes, as if due to change in solar radiance. eg a reduction of the solar output, increased albedo due to land-use change, or volcanic dust sheilding are examples of negative forcings. Increases in GHG are positive forcings . Under the "resources" menu, there is a climate glossary for looking up terms. Here you find the formal definition: viz
"Radiative forcing is the change in the net, downward minus upward, irradiance (expressed in W m–2) at the tropopause due to a change in an external driver of climate change, such as, for example, a change in the concentration of carbon dioxide or the output of the Sun. Radiative forcing is computed with all tropospheric properties held fixed at their unperturbed values, and after allowing for stratospheric temperatures, if perturbed, to readjust to radiative-dynamical equilibrium. Radiative forcing is called instantaneous if no change in stratospheric temperature is accounted for. For the purposes of this report, radiative forcing is further defined as the change relative to the year 1750 and, unless otherwise noted, refers to a global and annual average value. Radiative forcing is not to be confused with cloud radiative forcing, a similar terminology for describing an unrelated measure of the impact of clouds on the irradiance at the top of the atmosphere."
Dacama: science is all about definitions.
In a very real sense science- and thus the whole world- is based on consensus and it is called, "nomenclature".
@ 8,
..look up SI units and you will discover you are incorrect!
Most of bozza's comments strike me as being either meaningless, or nonsensical. As pure noise, obstructing debate rather than aiding it. His latest seams to indicate that:
1) He does not recognize that there is an SI unit for temperature (also measured in degrees); and that
2) He mistakenly thinks that Joules are a unit of temperature.
Or, of course, it may just be pure nonsense where his act of using vagueness to maskerade as profundity is caught out again.