


 Arguments


2015 shatters the temperature record as global warming speeds back up
Posted on 18 November 2015 by dana1981
With just a month and a half left in 2015, it’s clear this year will be by far the hottest on record, easily beating the previous record set just last year. The temporary slowdown in the warming of global surface temperatures (alsomisnamed the “pause”) has ended, as each of the past four years has been hotter than the one before.
El Niño is one reason 2015 has been such an incredibly hot year. During El Niño events, hot water is transported from the deep ocean layers to the surface. Over the past 15 years, we’ve experienced more La Niñas than El Niños, which helped temporarily slow the warming of global surface temperatures.
That changed in 2015, which has seen the third-largest surface temperature warming influence from an El Niño event on record (behind 1998 and 1987). The chart below breaks down global surface temperature data into years with El Niño, La Niña, neutral, and volcanic eruption temperature influences. Click here for additional details and a larger version.
NOAA global surface temperature data (1966–2015) broken into El Niño (red), La Niña (blue), neutral (black), and volcanic eruption (orange) years with linear trends for each category. Created by Dana Nuccitelli.
As the chart shows, 2015 will be more than 0.2°C hotter than 1998, despite having a slightly weaker El Niño warming influence. That temperature difference is the result of human-caused global warming. If we look at the temperature trends just for El Niño years, for La Niña years, and for neutral years, each has a trend of 0.15–0.17°C global surface warming per decade since the 1960s. The years during the mythical “pause” fall right along the long-term trend lines for each category (e.g. the blue points are consistently near the blue trend line).
This tells us that the long-term global warming trend persists, and it was only temporarily slowed because of the prevailing La Niña conditions from 1999 to 2012. In short, La Niña years in the 2000s have been hotter than previous La Niña years because of continued global warming, but they’re cooler at the surface than recent El Niño and neutral years.
We’ve now seen a new global surface temperature record in four of the past 11 years (2005, 2010, 2014, and 2015). This is consistent with a 2011 paper by climate scientists Stefan Rahmstorf and Dim Coumou, who found that as global warming continues, we should expect to set new records about once every four years.
Indeed, if we only use the data of the past 30 y, these show an almost linear trend of 0.017°C/y, yielding an expected 2.5 new record hot temperatures in the last decade [1 per 4 years].
The oceans have continued to accumulate a tremendous amount of heat as well.According to NOAA, in 2015 the oceans have accumulated an amount of heat equivalent to about 400 million atomic bomb detonations (27 zettajoules, or 27 billion trillion Joules). That means the Earth accumulated about 14 atomic bomb detonations of energy per second, on average, throughout 2015. That’s a lot of heat, likewise reaching record levels.
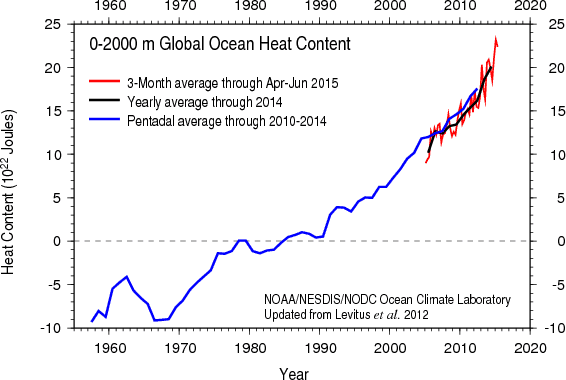
Global ocean heat content estimates from NOAA, 0–2000 meters.
Help us do science! we’ve teamed up with researcher Paige Brown Jarreau to create a survey of Skeptical Science readers. By participating, you’ll be helping me improve SkS and contributing to SCIENCE on blog readership. You will also get FREE science art from Paige's Photography for participating, as well as a chance to win a t-shirt and other perks! It should only take 10-15 minutes to complete. You can find the survey here: http://bit.ly/mysciblogreaders. For completing the survey, readers will be entered into a drawing for a $50.00 Amazon gift card, as well as for other prizes (i.e. t-shirts).


I think it is well worth pointing out that the 'spike' in global temperatures for 1998 and that El Nino event occurred AFTER the El Nino (which started in the winter of 1997).
The current 2015 El Nino is at the same stage the '97-98 event was in 1997, NOT 1998 (where we see the huge temperature spike in the annual temperature record); that anomalous spike is consistently misused to claim 'no warming in the past 15+ years. Thus, comparing temperatures for the global/annual record for 2015 vs 1998 is not apples-to-apples.
As I understand it, El Nino typically has a 3-6 month delayed impact on global temperatures. 2015 can be directly compared to 1997, and once the El Nino effect fully manifests itself, we can then evaluate 2016 to 1998 as a true apples-to-apples comparison.
Please correct me if I am wrong, but the phrase "During El Niño events, hot water is transported from the deep ocean layers to the surface" doesn´t seem accurate. The typical situation in the Pacific Ocean off the Peruvian coast is upwelling of cold, nutrient-rich water that maintains a highly productive ecosystem. El Niño tends to reduce this upwelling and its corresponding cold subsurface water.
[Rob P] The post by Dana Nuccitelli is correct although, as Phil Scadden points out, "deeper ocean layers" would be a better description. The thermocline (the depth where there is a sharp contrast between the warmer well-mixed surface layers and the cooler layers beneath) across the tropical Pacific is 'tilted'; shallower in the eastern Pacific where a lot of upwelling occurs, and deeper in the western tropical Pacific.
The westward tropical trade winds pile up warm water in the west - which is why sea level is higher in the west than in the east. This also drives an accumulation of warm water which extends well below the surface and thus displaces the thermocline to greater depth. This is known as the western Pacific warm pool.
When the trade winds relax, buoyancy and the pressure gradient force (a response to gravity) take over and the warm water travels not only eastward (in pulses known as Kelvin waves), but also surfaces. This greater-than-normal exchange of ocean heat with the overlying atmosphere is why the global surface temperature spikes with El Nino. The other part of the equation, as you point out, is a shutdown of the cold water upwelling as the subtropical gyres spin down temporarily.
Foster Brown - I think that depends on what you mean by "deep". The Peruvian cold upwelling should be say "very deep". I think the article would be more correct if it said "deeper" (<500m) rather than deep.
With all these precise temperature measurements of known El Niño, La Niña events, plus volcanic influences, how far are we away from determining the climate sensitivity for a doubling of CO2?
[AS] Spelling of La Niña corrected
If 2015's high average temperature is in part influenced by a strong El Nino, then it is likely that several of the succeeding years will be cooler (even as the underlying trend remains unequivocally upward). This will surely lead to new claims that global warming has stalled, a cooling trend is upon us, there is no link between warming and CO2 concentrations etc etc And yes, these claims will be repeated in major newspapers, albeit mainly in the 'comment' sections, where scientifically illiterate 'skeptics' are given free rein to spout whatever nonsense they like without any need to reference the facts.
I predict we'll have 20 years of people claiming "global warming stopped in 2015 - now it's for real!"
I think Cooper13 has a good point. Next year, 2016, will be the appropriate year to add to the chart under the category of El Nino years. It should be empahasized that 2015 will be a record, even before the large influence of the strong El Nino is felt.
A little birdy told me government departments expect ice free Arctic summers by 2050. Talk about conservative..
I think we will see a lot of divestment into clean energy for good reason before 2020: the same people admit multi-year sea ice in the Arctic is looking very very ill!!
I would have thought that higher surface temperatures would have resulted in more infra red radiation out to the atmoshpere and space and less accumulation of heat in the oceans. That is, wouldn't there be more accumulation in cooler surface temp /La Nina years and less in El Nino years? Maybe that's why there's a downward turn at the end of the graph, which only goes to June 2015. That downward turn may continue while the El Nino unfolds.
It appears the rise in ocean heat content rate is trending up. Since 1990 (25 years), it appears to have increased ~21x10^22 J (15,668 atom bombs/hr), based on an atom bomb = 17x10^9 watt-hrs. In contrast, since 2008 (7 years), heat content appears to have increased ~8.5x10^22 J (22,650 atom bombs/hr).
Article notes the 2015's El-Nino driven spike in heat content amounting to 50,400 atom bombs/hr (14/sec).
I'm a bit preplexed: I had thought that in El-Nino years that the stored-up ocean heat content was expelled (more than avg rates) to the surface, causing spikes in land & ocean surface temps, and also causing a slight decrease in the rate-of-ocean heat content (compared to avg) due to this more aggressive expulsion of heat from the ocean. ... Opposite effect in La-Nina years, that the rate-of-rise of ocean heat content would be more than average. So, I'm surprised to see OHC rate-of-rise increase in 2015's El-Nino year. I obviously have something wrong here.
[Rob P] This years super El Nino has yet to really leave its mark on ocean heat content. The data for ocean heat content end in September and we're only reaching the peak of El Nino now. The next two quarters of OHC may tell a different story.
sauerj @10.
If you examine NOAA OHC data, you'll see a strong El Nino signal in the 0-100m Pacific record with OHC rising during El Nino. The signal reverses for 0-700m data but becomes far less obvious. So when global 0-2000m OHC data is examined there is nothing really left to see.
BC @9.
The 0-2000m OHC data does indeed record OHC reduced from 2015Q2 to 2015Q3. But the same thing happened in both 2014 and 2013 when it showed even greater reductions but without an El Nino. Indeed, in the post the "400 million atomic bomb detonations (27 zettajoules, or 27 billion trillion Joules)" figure for ΔOHC in 2015 appears to be the annual figure for 2015Q3 - 2014Q3 which is 27.6 Zj. Over the last 8 quarters the annual ΔOHC averages 22 Zj.
One comparison not made in the post but which I consider more interesting that numbers of bomb-equivalents is the global energy imbalance required to add, say, 22 Zj/year to the oceans. That would be 1.37W/m2 or according to IPCC AR5 Table AII.1.2 equal in size to the increase in all the positive human climate forcings 1978-2011 which, with these OHC figures, would thus still be up there warming away despite the level of AGW we have witnessed since that date. That's a rather scary equivalent.
Yet no mention of the satellite data which is not aggreeing with the tone of this article. This particularly since Spencer & Christy rolled out UAH 6.0. Now both RSS and UAH seem to show there is no warming to speak of in the lower troposphere. Right? So long as that is the case deniers see that as confirmation this is a big hoax. I did find the comparison of RSS to RATPAC data in this link interesting:
https://tamino.wordpress.com/2015/09/24/exogenous-redux/
I don't know to what degree it is reliable, however. It does explain a lot to me about what is going one the past 15 years. Satellite vs. Surface temps.
[PS] Fixed link. Please use link button in the editor to do this yourself.