


 Arguments


2023's unexpected and unexplained warming
Posted on 15 January 2024 by Zeke Hausfather
This is a re-post from the Climate Brink
This post is an excerpt from a much more detailed State of the Climate 2023 report that I published over at Carbon Brief today. I thought it would be useful to have a more focused discussion here on why 2023 was so exceptionally warm and what that might entail for our estimates of where 2024 will end up.
Explaining 2023’s unusual heat
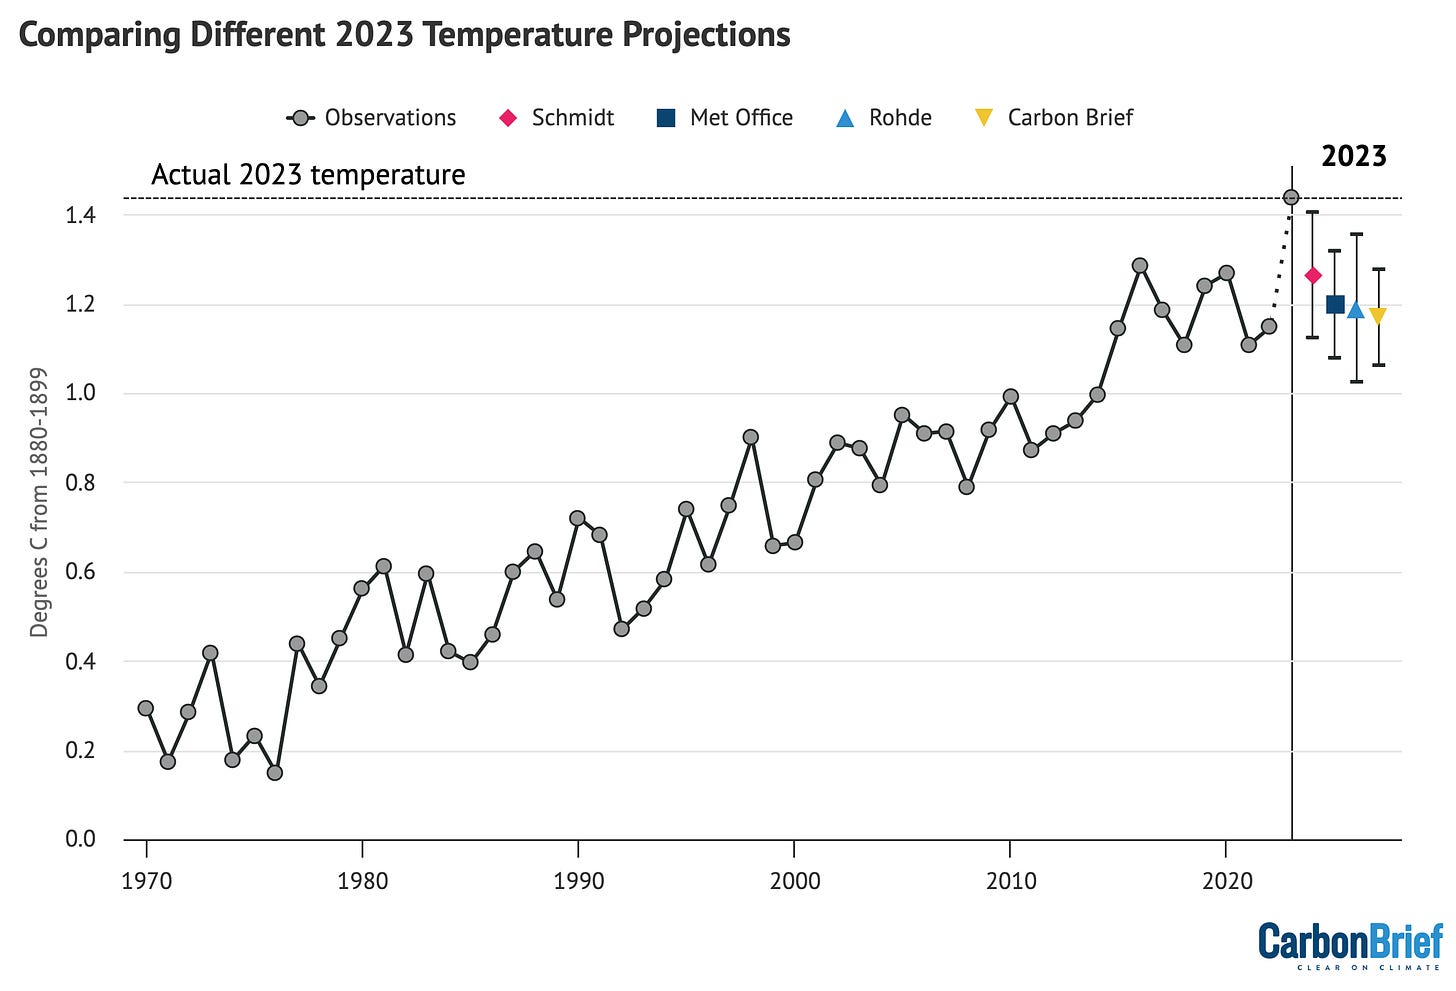
Scientists did not expect 2023 to be all that exceptional at the start of the year. As Carbon Brief reported at the start of 2023, four different groups provided temperature predictions for the year prior to any data being collected – the UK Met Office, NASA’s Dr Gavin Schmidt, Berkeley Earth and Carbon Brief’s own estimate.
As Carbon Brief noted in January 2023:
“La Niña conditions are expected to persist for at least the first three months of 2023. Because there is a lag of a few months between when El Niño or La Niña conditions peak in the tropical Pacific and their impact on global temperatures, these La Niña conditions will likely have a lingering cooling influence on 2023 temperatures.”
Carbon Brief estimated that 2023 was “very likely to be between the third and ninth warmest year on record, with a best estimate of being the fifth warmest on record – similar to 2022”, and suggest that if an El Niño develops in latter half of 2023 it would make it likely that 2024 will set a new record.
This estimate, alongside all the other groups predicting 2023 temperatures, was wrong. Not only did 2023 turn out to be the warmest year on record, but it fell well outside the confidence intervals of any of the estimates. And while there are a number of factors that researchers have proposed to explain 2023’s exceptional warmth, scientists still lack a clear explanation for why global temperatures were so unexpectedly high.
Over the longer-term, human emissions of CO2 and other greenhouse gases alongside planet-cooling aerosols are the main driver of global temperatures. Global temperatures have risen by approximately 1.3C since pre-industrial times as a result of human activity. However, on top of long-term warming, global temperatures vary year to year by up to 0.2C.
These variations are primarily driven by El Niño and La Niña events that redistribute heat between the atmosphere and oceans. However, other factors such as volcanic eruptions, the 11-year solar cycle and changes in short-lived climate forcers can influence year-to-year temperature changes.
The figure below, created by Dr Robert Rohde at Berkeley Earth, explores some of the main drivers of temperature change over the past decade.
These include continued accumulation of greenhouse gases, the evolution of El Niña and La Niña, and the 11-year solar cycle. It also includes two new factors that emerged during the decade: the 2022 eruption of the Hunga Tonga volcano and the 2020 phase-out of sulphur in marine fuels. Both of these are estimated to have relatively modest effects at present – less than 0.05C each – but with large scientific uncertainties.

However, both the Tonga eruption and the phase-out of sulphur in marine fuel are problematic explanations of extreme temperatures in 2023.
There is still a vigorous debate in the scientific literature about whether the eruption cooled or warmed the planet based on estimates of both sulphur dioxide and water vapour in the atmosphere, with some papers arguing for warming and others for cooling. Some modelling suggests that the largest impacts of the eruption would be in winter months, which does not match the timing of extreme summer temperatures experienced in 2023.
Similarly, the phase-out of sulphur in marine fuels occurred in 2020. If it had a large climate impact, it would show up in 2021 and 2022 rather than suddenly affecting the record in 2023. While it definitely has had a climate impact – alongside the broader reduction in aerosol emissions over the past three decades – the timing suggests that its likely not the primary driver of 2023 extremes.
Even El Niño – the usual suspect behind record warm years – does not clearly explain 2023 temperatures. Historically global temperatures have lagged around three months behind El Niño conditions in the tropical Pacific; for example, El Niño developed quite similarly in 1997, 2015 and 2023. But it was the following year – 1998 and 2016 – that saw record high temperatures.
The figure below shows the El Niño (red shading) and La Niña (blue) conditions over the past 40 years (collectively referred to as the El Niño-Southern Oscillation, or “ENSO”). While not unprecedented, the extended La Niña conditions since the latter part of 2020 have extended for an unusually long period of time.

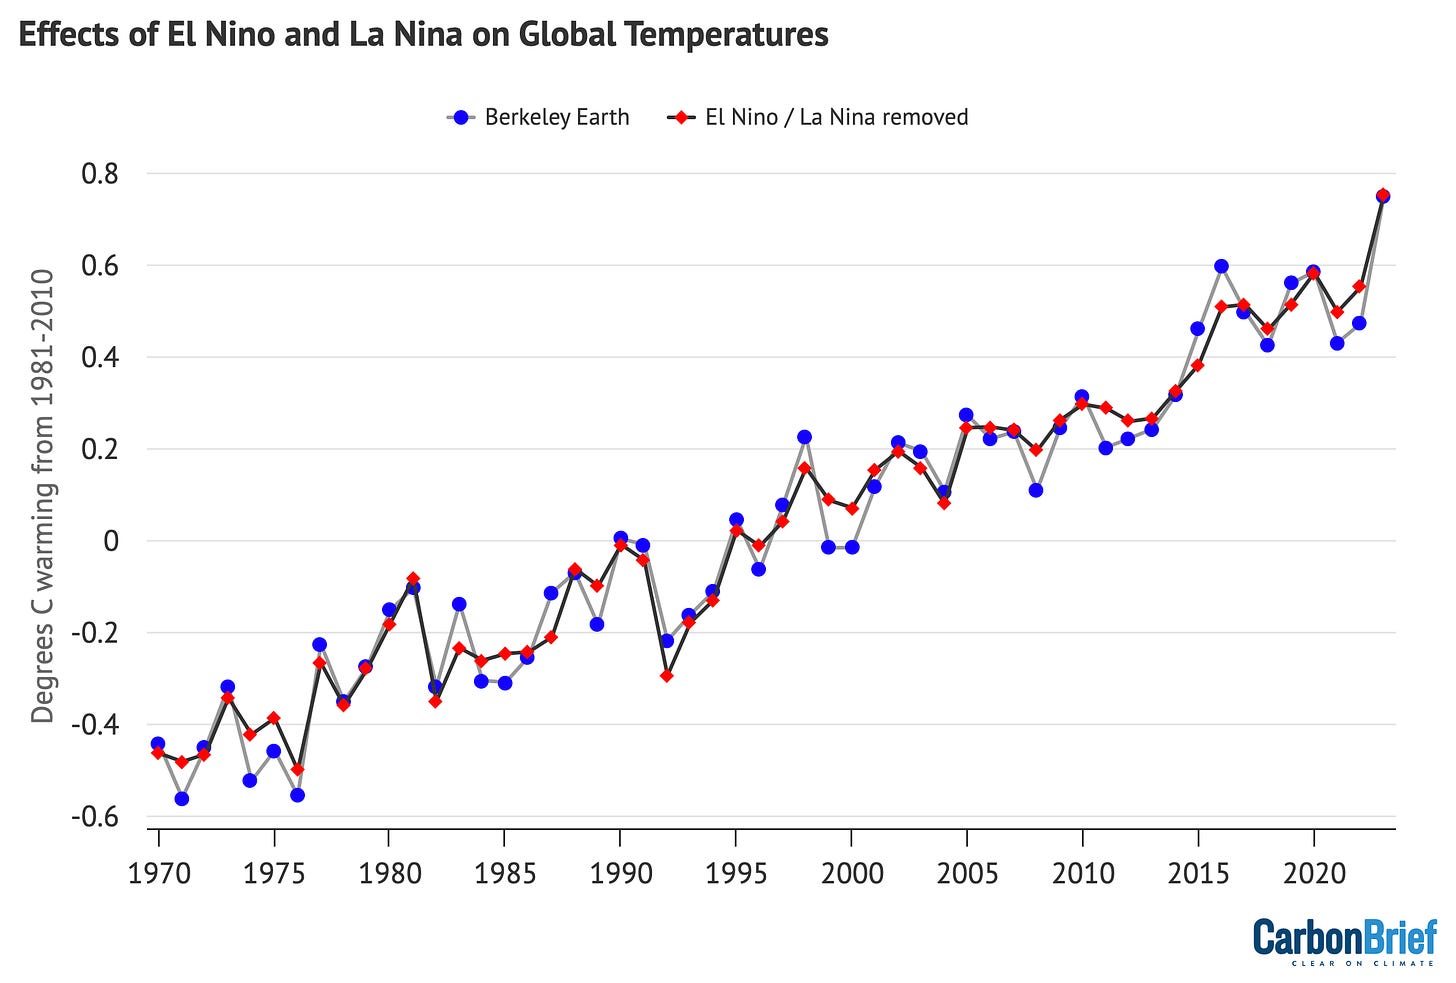
Carbon Brief has used this historical relationship between ENSO conditions and temperature to effectively remove the effects of El Niño and La Niña events from global temperatures, as shown in the figure below.
However, this approach – which has worked well for prior years – indicates that there would be almost no effect of El Niño on temperatures in 2023. This is because the lingering global temperature impact of La Niña conditions on the first half of the year would approximately cancel out the influence of El Niño on the second half. This model would suggest that the current El Niño event would primarily affect 2024 temperatures, analogous to what occurred in 1998 and 2016.
It is possible that this El Niño event is behaving differently and that the rapid switch from a rare and extended triple-dip La Niña event from late 2020 to the start of this year into strong El Niño conditions is resulting in a more rapid global temperature response.
But this remains speculative at this point and researchers are just starting to disentangle the causes of the unexpected extreme global heat the world experienced in 2023.
Looking ahead to 2024
The unusual global temperatures experienced in 2023 makes it more challenging to predict what 2024 might have in store.
If history is any guide here, the year after the development of an El Niño event tends to be considerably warmer than the year in which it develops. For example, strong El Niño events developed over the latter half of both 1997 and 2015 and peaked early the following year, and 1998 and 2016 both set new records by a large margin.
However, 2023 was so exceptionally warm that it suggests that this El Niño might be behaving differently, with global surface temperatures responding more rapidly than in the past. If this is the case, 2024 would not necessarily follow the pattern of past El Niño events and is less likely to be substantially warmer than 2023.
There have been four published predictions – from the UK Met Office, NASA’s Dr Gavin Schmidt, Berkeley Earth and Carbon Brief (in this article) – of what temperatures might look like in 2024.
The figure below shows the four different 2024 predictions compared to the average of six different temperature records (NASA, NOAA, Hadley, Berkeley, Copernicus, and the Japanese JRA-55 reanalysis) used by the World Meteorological Organization (WMO). These have been “normalised” to show 2024 warming relative to 2023 in the WMO dataset. This is to remove any differences in predictions due to divergences in the baselines used by different temperature records.
Carbon Brief’s prediction of likely 2024 temperatures is based on a statistical model using the year, the average temperature of the past year, and projections of El Niño/La Niña conditions over the first three months to predict the temperatures of the year.

The Met Office, Dr Schmidt, Berkeley Earth and Carbon Brief estimates all have 2024 as more likely than not to be warmer than 2023 – but only by a small margin. In all estimates it is close to a coin flip which will end up as the warmer year.
Against a 1880-99 pre-industrial baseline, the central estimate of all four forecasts is just below 1.5C of warming, with ranges suggesting that temperatures could top 1.5C next year.
However, the poor performance by all of these groups in accurately predicting 2023 temperatures mean these should be treated with some caution. Until scientists have a clearer understanding of the drivers of the unusual warmth the world experienced in 2023, it will not be possible to fully predict how temperatures will evolve in 2024 as the current El Niño event peaks and fades away.
Ultimately, what matters for the climate is not the leaderboard of individual years. Rather, it is the long-term upward trend in global temperatures driven by human emissions of greenhouse gases. Until the world reduces emissions down to net-zero, the planet will continue to warm.
As the chart below highlights, if the warming trend over the past 40 years continues, average surface temperatures are likely to pass 1.5C in the early 2030s and 2C by around 2060.


Hello,
Why have NCEP reanalyses been ruled out of the all time record estimate for 2023 in WMO and many others' articles?
Evidently NCEP reanalyses changed the SST source near 2020 which brings some complexity but I do not have more details.
cctpp85, one answer is that it's the difference between theory-based calculations (reanalysis products) and direct observations.
Parker 2016 - Reanalyses and Observations: What’s the Difference?
Atmospheric Reanalysis: Overview & Comparison Tables
Hello,
I know what is a reanalysis. The departure from observation-based analysis is not an argument because reanalyses consider observations as probabilities and are allowed to depart from observations if probabilistic optimization supports it.
Do you know about the details proving that all NCEP probabilistic optimizations are flawed?
In a multi model ensemble analysis, any model which is "often lower quality" but not clearly flawed participates nonetheless to the final probabilities. Otherwise it is not a multi model ensemble strategy and no final probabilities can be given.
Cctpp85 @1 and @3 :
Please clarify the main points that you wish to make. Casual readers - such as myself - like to improve our knowledge about important aspects of climate.
When considering matters of analysis and re-analysis, we like to "cut to the chase" and find out the practical end result of it all.
Somehow, I am reminded of an apocryphal story by David Attenborough, about a man who encountered a tiger in central Asia. And while the man was pondering whether it was a Bengal tiger or a Siberian tiger . . . . he "got et".
[ Excuse the Attenboroughian pronunciation. ]
Hello,
I replied recently to Daniel Bailey because he thought I was a beginner.
My first message was about NCEP "strange" reanalysis outputs and the fact that everyone left them out of recent discussion, which maybe has some link with the "strange" outputs. My natural curiosity leads me to look for more details about that story.
This is just a technical point, of second order importance, but many articles here are also technical points.
Cctpp85 @5 :
Indeed, and thank you. But what are the significances of it all?
It is a technical point of second order importance, whether the tiger is a Bengal or Siberian tiger ~ but what is the conclusion that we should draw, when we see the beast, and what practical action should we take? In other words, what is the central thrust of the underlying message that you were intending to convey to readers?
Re-analysis (or other usage of statistics) has a purpose in science. How would you yourself clarify the situation, in the way that you would wish readers to understand?
Hello,
Considering your political motivation, my request if of secondary importance.
I would be glad anyway if anyone can provide me with the details of the NCEP reanalyses recent story.
[DB] Inflammatory snipped.
Cctpp85 , it seems you are wanting to make a statement of some sort, but you are burying your message "between the lines" (to a large extent).
So much simpler, to plainly put your cards on the table; and explain what you think the problems are, and point those out very clearly. Point out any weaknesses or gross faults ~ and suggest how those may be fixed (if at all fixable, indeed) . . . . or at the very least, you should draw clear and valid inferences which will advance everyone's understanding of the climate situation.
Be boldly candid.
Hello,
I have said several times it is of second order importance regarding your expectations so I am not expecting anything more.
Hoping moderation convinces you better than me.
cctpp85:
It is not clear at all what you are asking. Please re-ask with a straightforward statement.
You appear to me to be asking why the NCEP reanalysis product is not mentioned in the OP and some other reports on the 2023 record setting year. Dr. Hausfather, who wrote the OP, is a specialist who worked on the BEST project. Thus he is most interested in the data from measurements around the globe. The NCEP reanalysis does not compare directly to instrumental measurements.
I Goggled a little and found this article about the ERA5 reanalysis. A quick review of the article indicates to me that the ERA5 reanalysis is the same as the instrumental data reviewed in the OP. I presume the NCEP reanalysis is the same. Dr Hausfather does not have space in the OP to discuss all the data. The reanalysis data do not change any of his conclusions. He discusses what he is expert in. Since the conclusion from reanalysis is the same there is no nefarious intent in leaving their data out.
If the reanalysis data were significantly different it would be interesting to figure out why they were different. Since they are the same it is too time consuming to add more data to the article.
Cctpp85 , your post #9 is even more difficult to comprehend than your earlier posts.
To be charitable, it would appear that English is not your Mother Tongue. In that case ~ let me first compliment you on the degree of fluency you have achieved thus far. English is a language cursed with a rather excessive amount of synonyms having many shades of meanings, and it is all too easy to convey a meaning which is misleading or nonsensical or unintentionally offensive. (But of course, every language has that room for error, to some extent.)
Allow me to respectfully suggest that you enlist the help of a bilingual compatriot who has a very high fluency in English. Alternatively, write out your questions/statements, and then use one (or more) of the on-line automated translator programs to render your comments into English parallel. Post both versions !
Yes, SkepticalScience here is primarily an English-based website, but there are very likely some volunteers here who are expert bilingualists. They can be helpful midwives, in delivering your "brain-child".
Help, moderation!
[BL] As stated by Michael Sweet, below, readers and moderators here have no idea what you are asking for. The comments area is provided to allow discussion of the points made in the original blog post. The blog software does not have a "read commenters mind" function.
Moderators are here to make sure that the Comments Policy is followed. There is a link to it in the "Post a Comment" section that you have been using to post comments. Before posting again, you should probably read it in its entirety.
For example, in comment #7, a moderator removed part of your comment due to it violating a combination of items in the Comments Policy: accusatory tone, politics, and inflammatory tone.
If you are going to make comments here, you also need to be willing to engage in honest, constructive discussion of the points you have made. People have been asking you for clarification, and you have declined to respond - instead dismissing the issue as being of "secondary importance". If your point is not important enough for you to respond to questions, then don't be surprised if people think your point was not important to begin with. You reap what you sow.
Cctpp85:
What do you want the moderator to do? At SkS the moderators delete inappropriate comments or try to explain the comments policy to readers. They do not interpret posts or suggest what others mean. I tried to be helpful.
We do not understand what you are asking. Try to rephrase your question so we can address your concerns.