


 Arguments


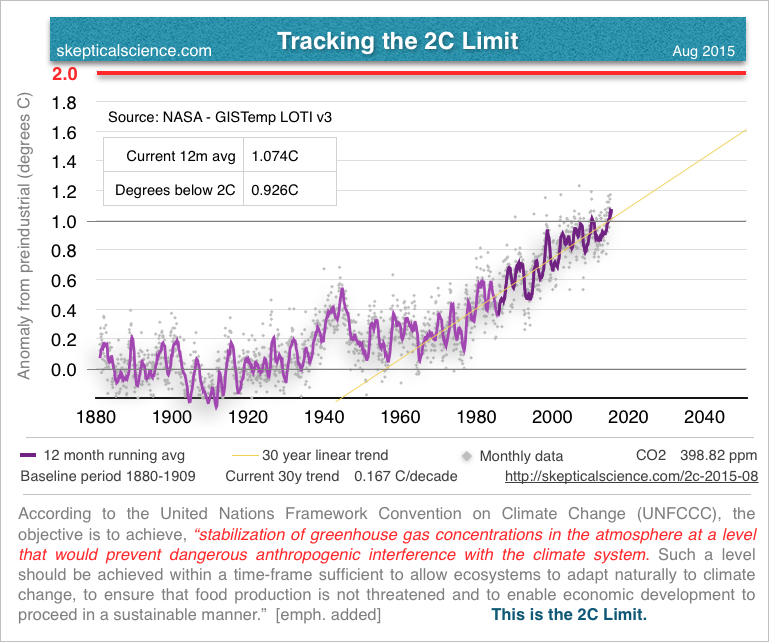
Tracking the 2C Limit - August 2015
Posted on 21 September 2015 by Rob Honeycutt
We ticked up this month over last month on the current 12 month average temperature anomaly in the GISS data. In July we stood at 1.060C and August is now 1.074C. Full size image here.

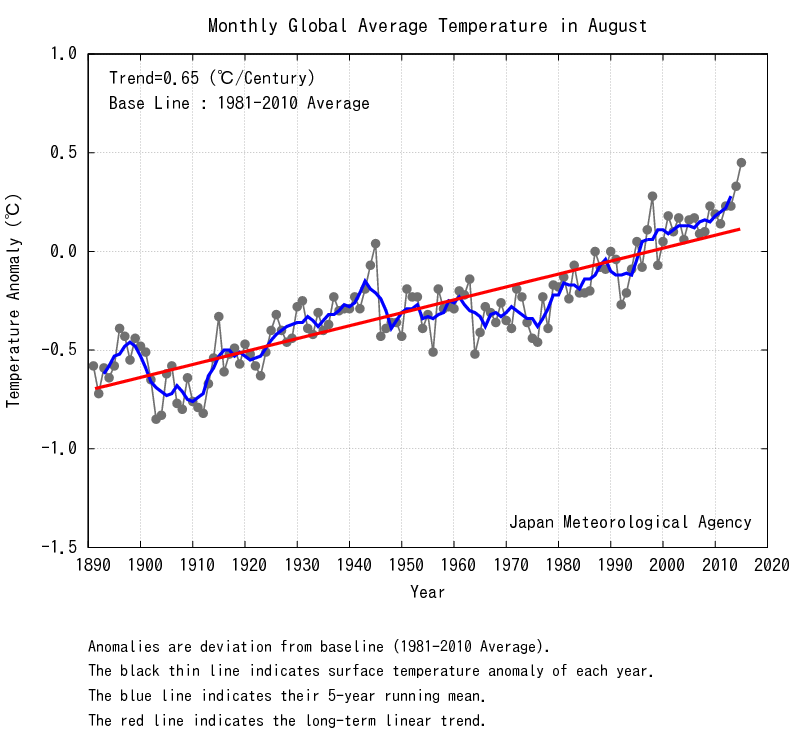
The Japanese Meteorological Agency is showing very strong, rapid warming with August hitting a new high anomaly. This is likely due to the current El Nino starting to express itself in the surface temperature data.
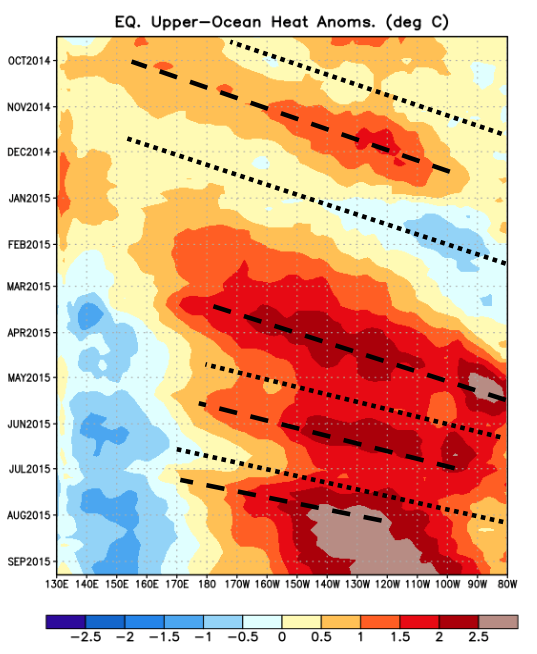
The weekly ENSO report from NOAA shows that the current El Nino is still going strong, but we're about to move into another downwelling phase (dotted line). But that will probably be followed by yet another upwelling phase (dashed line). Overall, you can see quite a lot of heat coming out of the equatorial ocean over the past 6 months.
Model predictions suggest the current El Nino is going to persist through the rest of the year, and on into the Spring before subsiding again. Bear in mind, there's a 4-6 month delay between the El Nino and when that heat gets expressed in the surface temperature data.
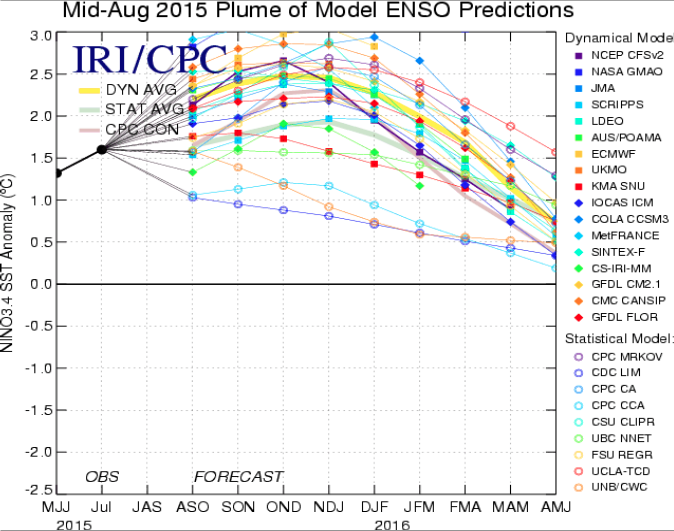
As things stands, it looks like the rest of this year surface temperature will continue to rise with 2015 showing a strong first place for the warmest year on record. Then, we'll have all of 2016 to watch as the the El Nino pulls back, but the warming continues to into the Summer.


You should make certain to put the baseline period for the anomaly just after the size of the anomaly, e.g., 1.074 degrees above the 1880-1909 baseline. It took me a few minutes to find the baseline in the figure. Unfortunately, one of the ways to minimize the temperature change is to move the baseline. It is important to keep the two pieces of information together.
Thanks, mitch. Good point.
Trevor... Sorry about that. I was talking NH Summer. June, July, August 2016.
So we're at 1.074 above just over a century ago (at least for now) but what is the increase above pre-industrial, which seems to be the key base-line. I've seen various estimates but is there one that has a high confidence? If, for example, the warming from 1750 to 1900 was 0.2C, we're already at 1.274 above preindustrial. Hansen thinks anything over 1C is dangerous. It's hard to disagree.
In my humble opinion in June (2014.7 – 2015.6) we stood at 1,060 and in July (2014.8 – 2015.7) at 1,074.
August (2014.9 – 2015.8) is now at 1,073.
Please correct me if I am wrong!
[JH] Please tell us what the numbers you cite are and document their source.
I use GISTEMP LOTI: deviation August 2015 (average of the last twelve months: 2014.9 – 2015.8) of the baseline period 1880-1909 (average).
According to my calculation: August (2014.9 – 2015.8) is now 1.073C warmer than 1880-1909.
I did not use a moving average. My results are the same as in the article. Only the respective month has “slipped”.
Thms... I'm using the exact same data. Not sure why you getting a different answer.
Hi Rob!
We have almost exactly the same.
Your "In July we stood at 1.060C ..." is the "problem".
July means IMHO the current 12 month (July and 11 months back). I take July as starting month and additional the last 11 months.
You take for July the data from June and additinal the last 11 months.
I'm afraid my English is a bit rusty.
Thms... You know, you're absolutely correct. I forgot to pull down the data in my spreadsheet. When I did that I got the same answer as you. I'm still getting used to my own process. :-)