


 Arguments


Tracking the 2C Limit - September 2015
Posted on 23 October 2015 by Rob Honeycutt
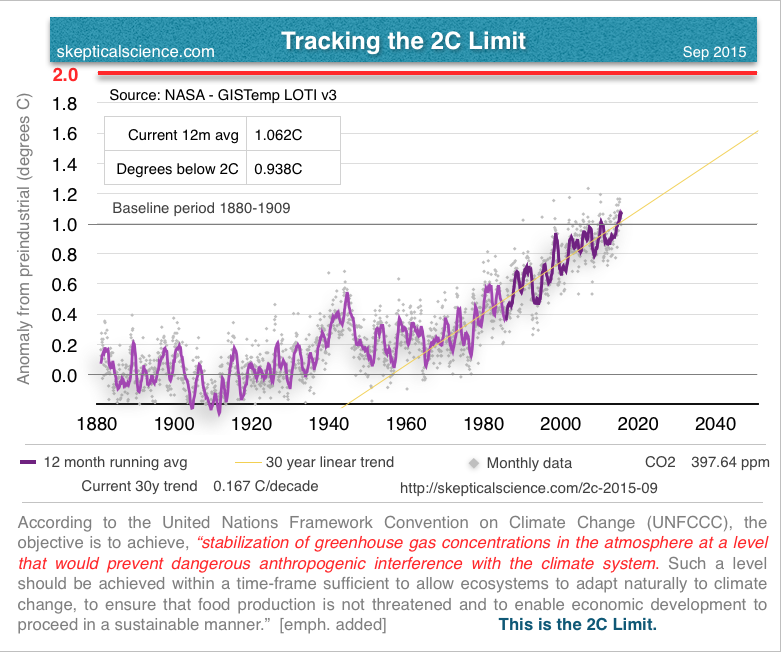
The latest temperature anomaly coming out of GISS is, same as last month, 0.81°C. Adjusting that for our preindustrial baseline we show we're now at 1.062°C over preindustrial times.
The current El Niño continues to grow and is now predicted to have a 95% probability of continuing into the Spring of 2016.
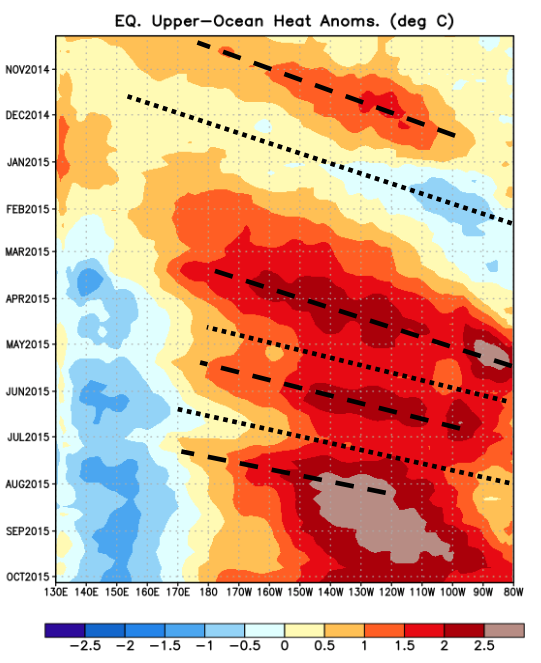
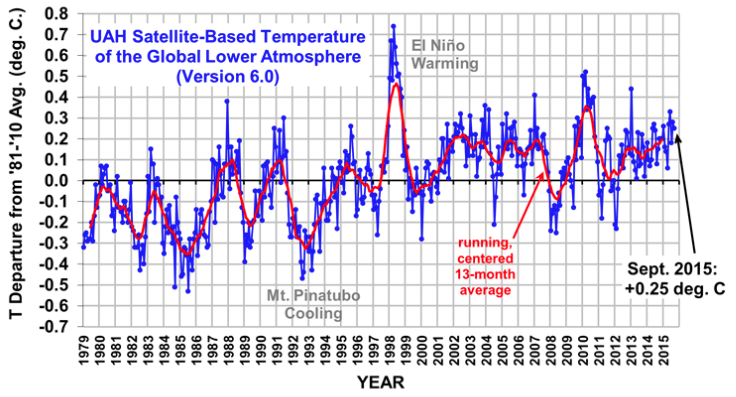
Ironically, the University of Alabama, Huntsville (UAH) satellite temperature data is still showing little sign of warming now 5 months into the warming you see above in the equatorial upper-ocean anomaly. I've asked other more knowledgeable folks about this and everyone is in agreement this is probably about right, but we should start seeing the satellite data begin spiking in the next month or so. With the Pacific "blob" off the coast of California, I would guess much more heat is entering the atmosphere than even during the 1998 el Nino, as such we would expect a similar or greater spike in the satellite data. If not, something must be amiss.
Far more dramatic this month are the figures coming out of the Japanese Meteorological Agency (below). September shows a sharp rise in surface temperature for the month.
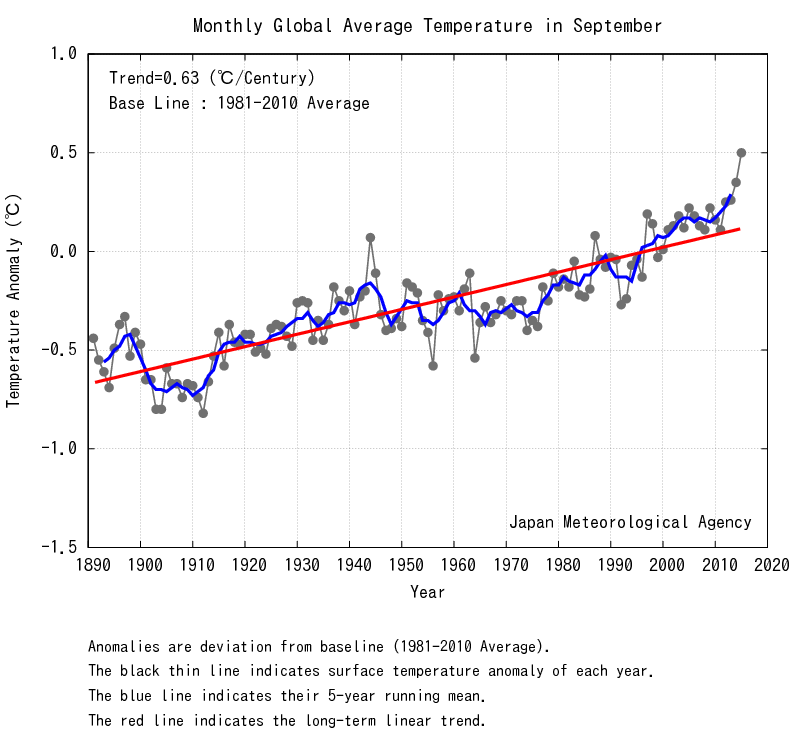
It's going to be very interesting to watch how the next few months pan out with all the various surface station and satellite datasets.
Help us do science! we’ve teamed up with researcher Paige Brown Jarreau to create a survey of Skeptical Science readers. By participating, you’ll be helping me improve SkS and contributing to SCIENCE on blog readership. You will also get FREE science art from Paige's Photography for participating, as well as a chance to win a t-shirt and other perks! It should only take 10-15 minutes to complete. You can find the survey here: http://bit.ly/mysciblogreaders. For completing the survey, readers will be entered into a drawing for a $50.00 Amazon gift card, as well as for other prizes (i.e. t-shirts).


The mechanisms behind ENSO are still not completely understood, but the closely related Quasi-Biennial Oscillation (QBO) of atmospheric winds is showing promise in being solved.
http://ContextEarth.com/2015/10/22/pukites-model-of-the-quasi-biennial-oscillation/
You may think this model is too straightforward to be believable, but you have to remember is that it is replacing the traditional QBO model of the AGW skeptic Richard Lindzen, who has also left a trail of debunked theories (the Iris Cloud hypothesis) and trail of retracted papers. That is not the scientist that you want to lend credence to.
Worth pointing out the observation that we are currently in the same stage of the '97-'98 El Nino per the Fall of 1997 (if I have my dates correct). On the UAH plot, 1997 still shows rather cool overall temperatures, with the El Nino spike delayed by 6-9 months, overall.
That we are already seeing a very significant jump in temperatures already in 2015, a full year ahead of when that spike showed up in the previous 'major' El Nino event, implies that we may destroy the all-time high temperature records, again, in 2016. That is, of course, assuming that we will see the same delayed response with this El Nino (but pretty sure that delay in global temperature response is typical).
[RH] Changed all caps "very" to italics, per commenting policy.
The satellite temperature measurements for El Ninos tend to be strongly biased toward the southern hemisphere summer months. So they spike during the first 6 months of the calendar year, which is normally the second half of an El Nino event.
I don't know why this is the case. It might have something to do with greater amounts of latent heat being released from clouds forming over the southern tropical Pacific during those months. This would occur at an altitude close to the 2-4 km range where the satellite TLT measurements are centred.
As Cooper13 noted the atmospheric heat came on the downside of the '97-'98 el Nino
We are already on track to set an unprecendented global temperature record two years in a row and I submit that 2016 could very well make it 3 straight years or at least the top 3 years all in a row but not necessarily in order
That should quell the "It stopped warming in blah, blah, blah" Myth but likely it won't .... Denial is seldom overcome by facts and Reality
I'm expecting the "no warming since..." to turn into "it's just el nino."
...until we're far enough past the El Nino that they can restart the "it hasn't warmed since 2016..." schtick.
Tamino examined various datasets, including RSS, in this post. It certainly looks as though "something happened" around 2000, to send the RSS data off, relative to actual surface temperature measurements. It would be great to get some serious research into the satellite data sets to see why they diverge from that time. Maybe there is something we don't yet know about the lower troposphere (though Tamino's post also shows radiosonde data doesn't appear to go off track at 2000. My guess (worth nothing, of course) is that the calculations were thrown off in 2000, and this hasn't yet been picked up.
Longjohn, two warmest years in a row would not be unprecedented. I think it's often forgotten that 1997 was the warmest year on record, at the time. Then 1998 eclipsed it, by some margin. Looks like a similar thing is going to happen this time, though 2016 will be very interesting.
By the way, Rob, I was confused by the term "baseline", in the article. First you talked about a pre-industrial baseline but the graph gives the baseline as the period 1880-1909. That wouldn't be pre-industrial. Is there a further adjustment to be made for true pre-industrial (which would presumably be a 30 year period centred on 1750)?
James Hansen (and others) regard 1C as the dangerous warming level. It seems we're already past the dangerous level, if the extra adjustment doesn't amend 1.062C downwards. It's getting interesting.
TonyW... The 1880-1909 baseline is the closest to preindustrial that I can get just using the GISS data. Part of my reasoning for posting this on SkS every month is to get people thinking about where we actually are relative to preindustrial. I hope climate researchers eventually come up with a better estimation of a preindustrial baseline that could be used across all the data sets.
"until we're far enough past the El Nino that they can restart the "it hasn't warmed since 2016..." schtick."
That particular sceptical argument has been used to saturation, and wont work any more.
It will be on to "CO2 is plantfood".
For future updates you may want to express the total warming as a range, or at least talk more about how the baseline impacts the result. I'm seeing more news articles mention a total warming figure, and most seem to be using a higher baseline figure.
The media will likely make a big deal when we 'pass 1 C' warming... based on whatever standard they are using. While the 1880-1909 baseline is certainly logical, you might want to try to get an idea of where the media is getting their results and what standard those sources are using. I'm wondering if it isn't just the single year 1880 value.