


 Arguments


Tracking the 2°C Limit - December 2015
Posted on 26 January 2016 by Rob Honeycutt
Holy frijole!
Okay, I'm not surprised that December beat November as the warmest anomaly in the entire GISS temperature record, but I was taken a little aback by how much.
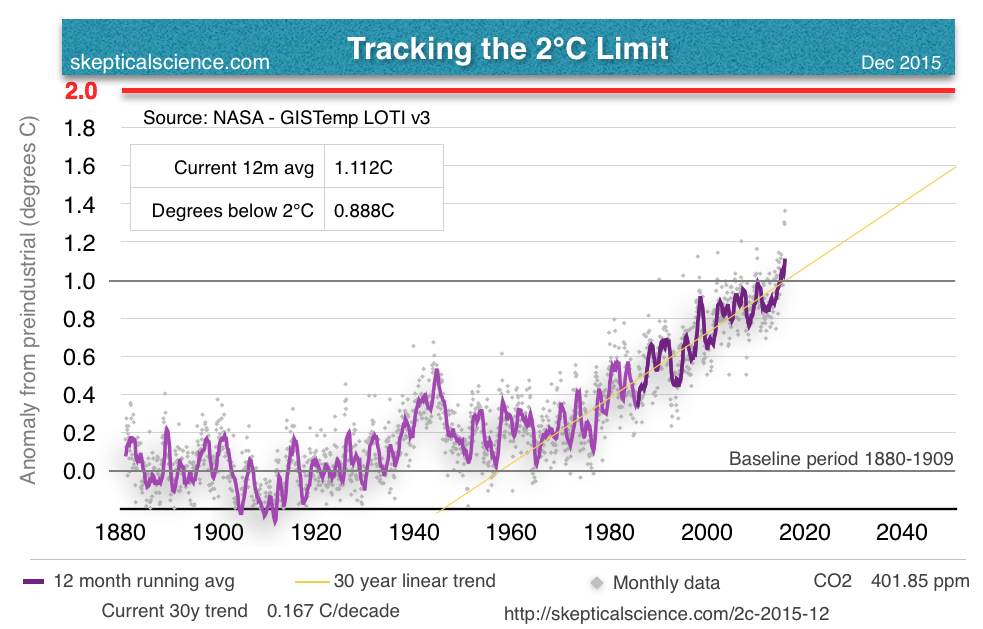
For a full size image click here.
One thing I note from this graph is the consistency between the peak (assuming we're likely near the peak of the surface warming due to the current super El Nino) and previous El Nino peaks in the GISS data. You essentially find the same trend as the trend in the full data set. Same follows for La Nina periods as well.
Many contrarians hold to the false notion that the current warming is "just" a function of the El Nino, whereas the current anomalies are clearly fully consistent with the long term rising trend is surface temperatures.
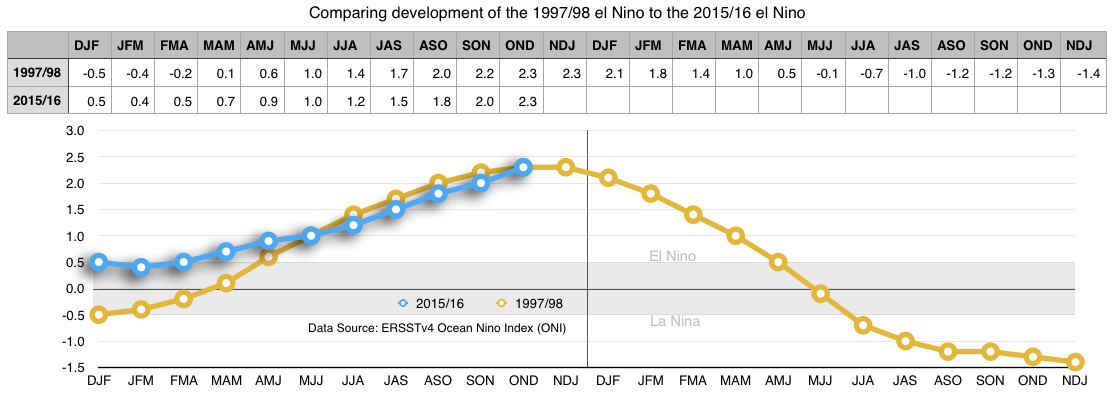
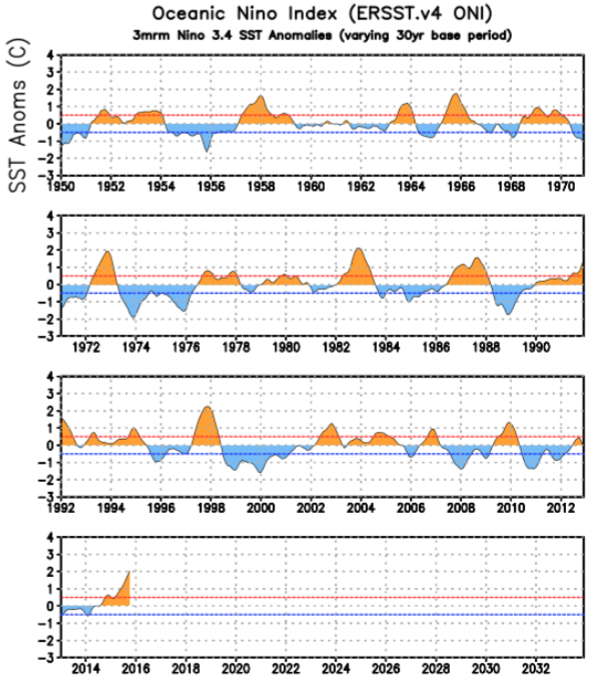
I'm also continuing to track the Ocean Nino Index (ONI) for this El Nino against the 1997/98 El Nino, and the ONI data is continuing on track. The ONI data goes all the way back to 1950 and the current 2.3 figure ties with 1997/98 as the highest in the entire data set. We will see next month if this El Nino breaks that record. Click here for a larger version of the graph below.
Below is the full ONI data going back to 1950.
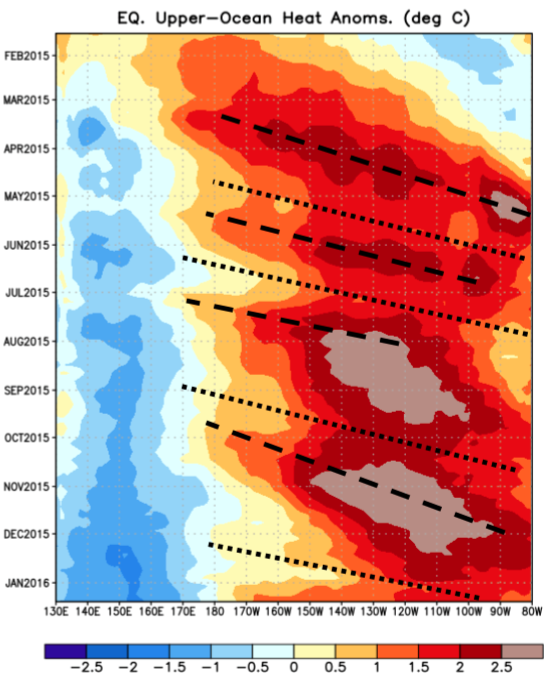
The figure below comes from NOAA's weekly ENSO update and I think paints a nice full picture of the current El Nino over the past year. You can see one more surge of heat getting ready to hit the surface, so as Yogi Berra used to say, "It ain't over till it's over."
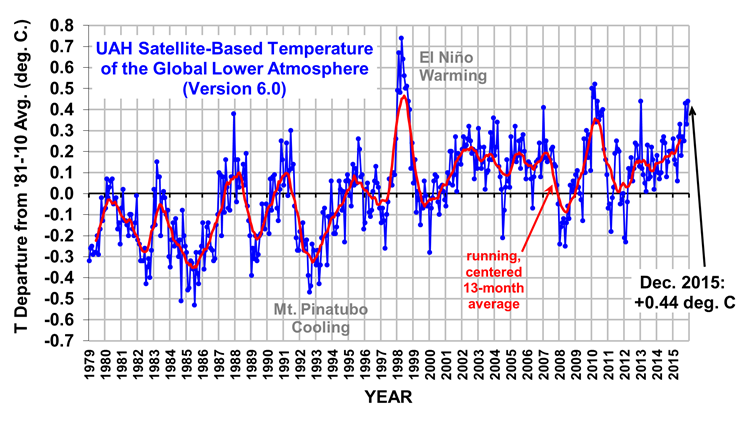
I'll add that, we're still not seeing much of a response in the satellite temperature data. We know quite clearly this El Nino has been just as strong at 97/98 but we're not seeing the same response that we did in the satellite temperature data during that previous super El Nino. Maybe January will show a big jump. If it doesn't this may be some indication of a problem with the AMSU sensors, as Eli Rabett has been hop hop hop hopping around lately.


I'm failing to find the source because I'm too sick to look at the moment, but what about Mann's point that we're really already at 1.2 above? That the baseline being used here is still too recent?
Ok I found the article he wrote.
Don't think there is anything wrong in UAH data (yet) when compared to 1997-1998. Much of the change should be coming this month...
A couple of months ago I tried to get a fix on the formal definition of "pre-industrial level". The term is used by IPCC and in several agreements of the COPxx (last one being COP21 in Paris).
The thing is, I did not find a formal document (signed/approved by all countries) with a clear definition. So if you find one, please let me know.
However, 2 Dutch co-writers for the latest IPCC report both told me that the definition of pre-industrial should be the average of the years 1861-1880.
Since only Hadcrut has pre 1880 data, I used their series and found that currently we're at +0.996C.
Described in this post:
Tracking the 2 degree global warming target
So, that's 0.2 lower.
Who's right? :-)
This really is an open question. Because I really want to find the agreed upon definition (including some formal documents) of this commonly used statement!
Steeph @4, according to the IPCC AR5 Glossary (Annex 3), "In this report the terms preindustrial
and industrial refer, somewhat arbitrarily, to the periods before and after 1750, respectively." On that basis, I would treat the Preindustrial temperature as the 30 year average temperature 1720-1749. Unfortunately we do not have a global instrumental record extending back that far.
In fact, we do not have a global instrumental record extending back prior to 1880, with the temperature record from HadCRUT4 and BEST in those periods conisting of Europe, Eastern US, Argentina, South Eastern Australia, India, and sea routes between those points. NOAA and GISS do not cut of their records at 1880 because they do not have that data, but because they think the data insufficient to reliably indicate global temperatures.
HadCRUT4 publishes the percentage of the Earth covered by their data for each month, and show (prior to 1880), never more than 36% and sometimes as little as 13%. Where that data evenly distributed it would constitute a suitable record, but unfortunately it is not.
The upshot of that poor coverage is that for periods prior to 1880, and certainly prior to 1850, paleotemperature reconstructions are our best indicator of global temperatures:
From them, for the global record (lower right panel), global mean temperatures were about 0.3 C below the 1881-1980 average in 1750, or in turn, about 0.2 C below the 1880-1909 average. Of course, the margin of error is considerable so that the 1990-1909 average is a reasonable approximation, but likely to result in an underestimate of the increase since the pre-industrial.
In addition to the current ONI tracking very similar to the 1997/98 event, the current SOI monthly values are also currently tracking in a manner that is very similar to the 1997/98 event. The SOI monthly values (since 1876) are here.
December 1997 was a signficantly weaker SOI followed by a very strong SOI average for January 1998 (and Feb, Mar, Apr).
November and December 2015 were significantly weaker SOI values, however the SOI 30 day average shown here is currently at -23.0 with only a few days left in January.
Tom @5 Thanks for your reply. But this means that there is no "official" way we can actually track this. Only an approximation? Which is kinda weird for such an important agreement...
Steeph @7, the 2C guard rail on temperatures is not a hard barrier. 2.1 C is only slightly worse than 1.9C. It was selected as a convenient number because, first, it represented a temperature not seen by humans as a climate average since the end of the last glacial; second, because beyond that limit it is reasonably certain that there will be bad consequences from global warming, whereas below it it is reasonably certain the consequences will be managable (despite a significant risk of individual tragedies); and third, because it was a convenient round number.
That being the case, it is not a problem that we cannot exactly say when we cross the 2 C line. We cannot exactly say even if we knew the exact 1721-1750 average in any event, because the guard rail is crossed when the global climate average crosses that value, not when some particularly strong EL Nino takes us to 2 C above the preindustrial average. And plus or minus that value based on the actual 1721-1750 mean makes only a minor difference in net damages.
For these reasons, taking the 1880-1909 value as an approximation is entirely OK, and if some other team preffers the 1861-1880 mean, that is OK also. We just should be aware that each is a relatively arbitrary approximation to the true preindustrial value, and that both approximations if treated as absolutely valid will tend to make us overshoot the target (the latter more than the former).
Put another way, we could simply redefine the guard rail as 2 C above the 1880-1909 (or 1861-1880) mean. However, if we did so it would decrease our certainty that keeping under this newly defined guard rail would keep the harm form AGW reasonably managable. For policy purposes it is important to be aware of that decreased certainty. But having said that, the exact value of the guard rail is inevitably a matter of convention and not something we should worry too much about.
Steeph and Tom... Per what Tom has stated here, there really isn't a perfectly accurate way to track the 2°C limit. The same goes for global mean temperature as well. Too often people get the idea that surface station data is like an actual thermometer stuck into the ear of the planet. Each data set is, at best, an approximation of global mean temperature with various limitations to each set. So, we have imprecise current data. We have imprecise historical data. And we have an imprecise guardrail. Ultimately that shouldn't make a difference as long as the best effort is being made to quantify each of these.
The 2°C limit is merely a way to generally guage where we are, where we're headed, and about how long it's going to take to get there. Precise numbers aren't necessary in order to comprehend the nature of our challenge. Having that 2°C line in the sand starts to help us force the issue, to help people wake up and pay attention.
The reason I'm posting this number each month is because I think this needs to become like a drum beat. People have to see this figure over and over and over again for it to really take hold. I'm just one guy here, on one small website, beating that drum. Hopefully, over time, others will hear and start to pick up the beat.
@ Tom and Rob, I fully understand what you're putting forward. And from a scientific point of view I can accept it.
But there's a big PR side to this issue. It's a huge difference if, in 10 years time, we state that the 1.5 line has already been crossed (call to more action!) but others will counter with saying we're only at 1.2 or 1.3.
(You all know some parties will use everything to delay things)
Something to be aware of.
I've often read the idea that this el Nino is not showing up as much as the 1997/1998 el Nino, in the satellite "data". I don't undestand why this miscomparison is made, since the big satellite spike came in the second year of the last el Nino, not in the first. The second year in this el Nino is 2016, not 2015. This year is expected to be warmer than last for surface temp and I'd expect the satellite spike to occur this year (though there does seem to be a lot of discussion about what happened to the satellite data after 2000, as it deviated from surface and radiosonde data about then).
TonyW... It's definitely right around the point where we'd expect the satellite data to make a big jump. The UAH data in 1997/98 went: Oct. 0.08, Nov 0.07, Dec. 0.24, Jan. 0.47, Feb. 0.65, Mar. 0.46, Apr. 0.73... and then headed back down. So, Dec had already shown a solid jump. This one might be a little more delayed even though the ONI data shows them running very similar trajectories.
Jan/Feb should be very interesting either way.