


 Arguments


Tracking the 2°C Limit - March 2016
Posted on 29 April 2016 by Rob Honeycutt
The first three months of 2016 have now all been blow-out months, all rising above 1°C anomaly over the GISS mid-century baseline. This month came in at 1.28°C. In fact, all of the past 6 months have come in at an unprecedented >1°C over their baseline. In terms of our anomaly over our 1880-1909 preindustrial baseline, this clocks in at 1.528°C and we've now marked 13 months where the 12 month average has remained over 1°C. We first crossed that point in February of 2015. (Full size image.)
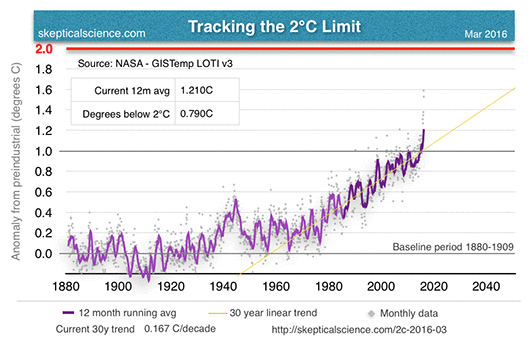
Reliable sources are telling me April 2016 is coming in about the same, around 1.2°C in the GISS data. The 2015/16 super El Nino is continuing to wane but we probably have a few more months of these extreme global anomalies to come before the surface station data begins to fall back to the long term mean trend line.
The Ocean Nino Index (ONI) data is still just off its peak of 2.3, coming in at 2.0 for JFM (Jan/Feb/Mar). The satellite temperature data tends to lag the ENSO by about 6 months, so we will probably see those data sets also remain near their peak for another 6 to 8 months. (Full size image.)
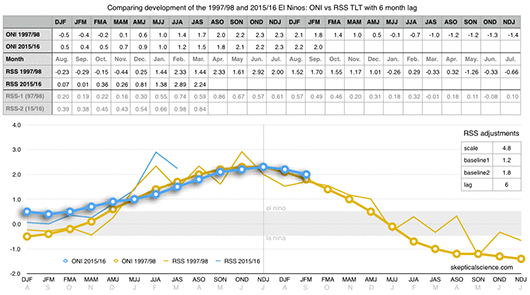
Much noise is being made about the expected la Nina that will follow this current El Nino. John Abraham has a good article in the Guardian explaining how the ENSO cycles operate much like a battery; gaining heat in the oceans and then releasing that heat to the atmosphere. Many contrarians seem to think the la Nina is going to somehow wipe out the El Nino, but that's far from the case. They are essentially grasping for straws. This super El Nino and the resulting surface and satellite temperature responses have been nothing short of spectacular, and very concerning.
You simply cannot look at the recent anomalies on my first chart (small grey diamonds) in relation to all the other anomalies and not be struck by how dramatically they standout. Sou at HotWhopper also has a really good post about this year's anomalies in the GISS record that's well worth a read.
This is some crazy stuff, and we likely will have several more months of the same or similar coming.
Expect 2016 to be the third year in a row that we beat the record for global mean temperature.


UK Met Office, which baselines at 1961 - 1990, and will therefore have lower anomalies relative to GISS baseline (1951 - 1980)
Dec: 1.010 C
Jan: 0.908 C
Feb: 1.061 C
Mar: 1.063 C
NOAA, which uses 20th century average as baseline:
Dec: 1.122 C
Jan: 1.042 C
Feb: 1.191 C
Mar: 1.218 C
It's interesting that we no loger hear about the "hiatus" - not even from politicians. Perhaps its proponents are waiting for the upcoming La Nina to give them another one? The escalator is more and more scary each time I look at it.
Rob, am I correct thinking that the ONI data is detrended relative to global warming?
Yes, it is, Barry. That's partially why I end up with two different baselines for the two temperature series, though it's manual and not a calculated figure in my graph.
Interesting article here
I have been 'blaming' the way above trend increase on El Nino, this seems to insist that's a false assumption ?
Trevor_S @5, Gwynne Dyer is wrong. El Ninos have large impacts on global temperature on short term time scales (sub decadal), and ENSO is the dominant cause of subdecadal global temperature fluctuations. You can see the extent of that impact at this page, which shows the regression (as a variation in temperature per degree K relative to the NINO 3.4 index, and correlation). It causes variations of global temperatures on subdecadal scales of +/- 0.166 C, or the equivalent of 8-10 years of global warming. That means it requires 15-20 years before global warming is sufficient such that the warmest El Nino 15-20 years earlier is nearly certain to be cooler than the coldest La Nina now.
There is, therefore, no reasonable doubt that the current El Nino made a substantial contribution to the very hot temperatures in 2015/16. On the other hand, almost certainly, the contribution of global warming accounts for more than the difference between the 2015 Global Mean Surface Temperature and that durring the stronger El Nino in 1998.
Tom Curtis @6 is correct. That was demonstrated by Kosaka and Xie in 2013. They compared model runs in which tropical Pacific SST (sea surface temperature) was a dependent state variable, with runs in which the actual observed timing and strength of ENSO events was input along with incoming solar radiation and atmospheric CO2 levels. They found that constraining SST to observed values accounted for most of the divergence between the observed and modeled (without forcing SST to observations) temperature trend between 1970 and 2012, including the so-called hiatus:
Some AGW-deniers claimed that K&X had "tuned" the model. More rational observers agreed that K&X had advanced the physical understanding of climate, by resolving decadal "noise" (i.e. internal variability) into forcing. IOW, scientific progress!