


 Arguments


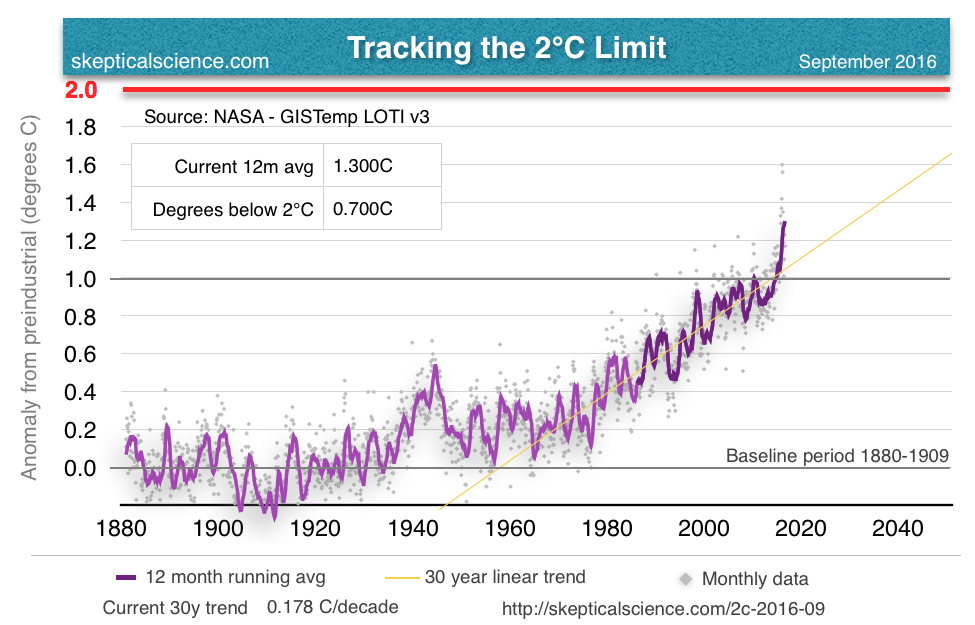
Tracking the 2°C Limit - September 2016
Posted on 26 October 2016 by Rob Honeycutt
Septembers GISTemp data is now in so I can update the 2°C Limit chart. (Full page image here.) The Sept anomaly came in at 0.91°C, baselined to preindustrial that puts last month at 1.168°C.
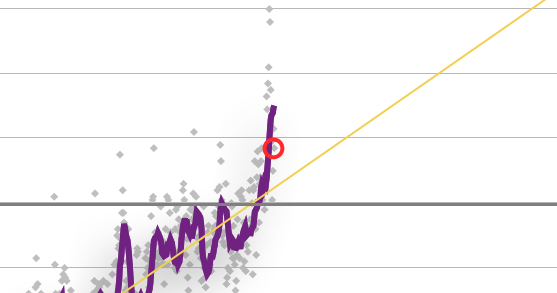
Now that anomalies have dropped back down closer to the long term trend, the latest plots are hard to pick out. Here's September:
While the 30 year trend is still running at 0.178°C/decade, it's important to take a look at how dramatic the past 10 years have actually been.

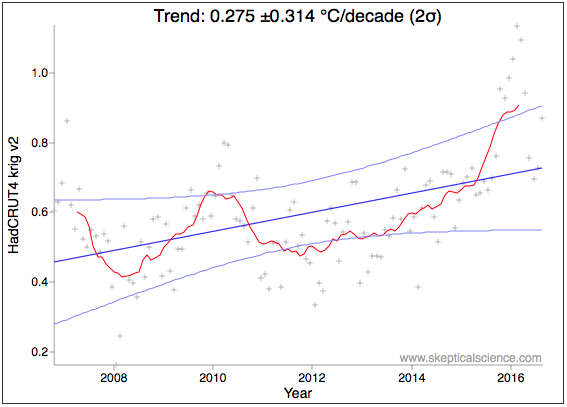
We see fairly similar results in the HadCRU data...
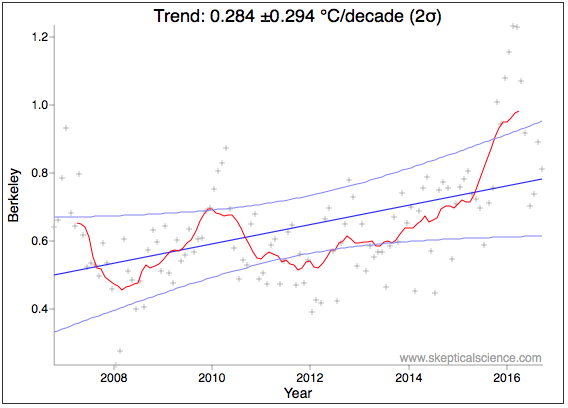
And in the BEST data...
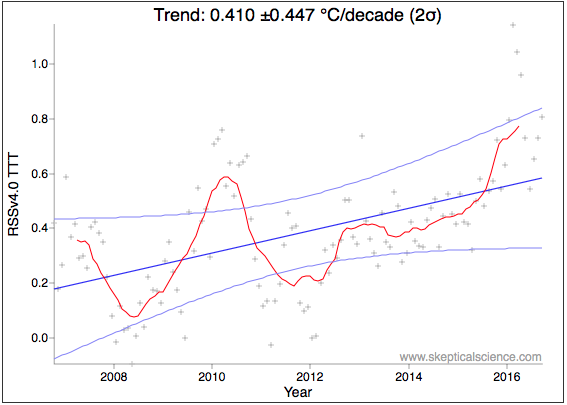
Now that we have RSS's v4 data, we can more reliably look at tropospheric temps as well. Note that I'm presenting the TTT data (total troposphere) which is probably the best representation of the troposphere over the TLT or TMT data.
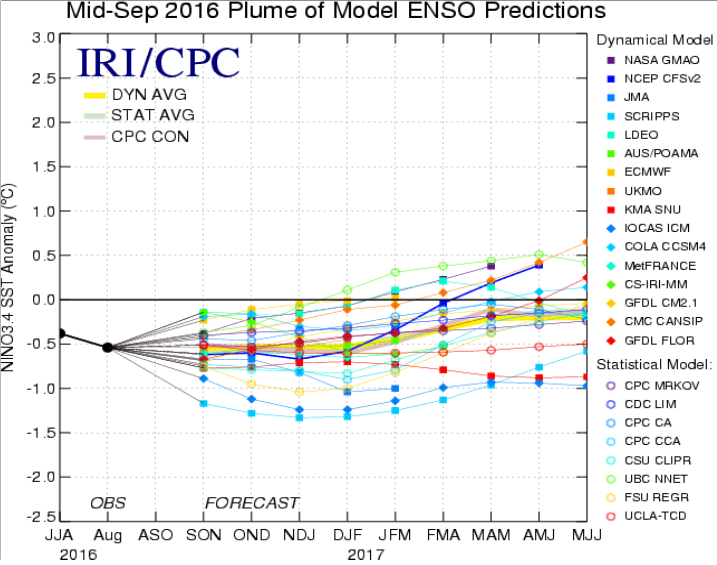
While the latest El Niño has continued to subside, models are suggesting we're not going to see a strong La Niña following it.
It would be a mistake to over-interpret all this to say this is the new normal for the temperature trend (~0.45°C/dec). Instead, I would be prone to characterize this as looking like we're firmly riding a riser on the trend escalator.


La Niña comment is out of date. Good for you for printing the error along with your 2 sigma errors along with the midpoint trend estimate. By this you can see that the RSS trend isn't statistically different from zero. Some of the others aren't highly significant and may become insignificant with 11 years of data (depending on the strength of the coming La Niña).
While the RSS TTT may be more representative of the troposphere as a whole, the TLT channel remains the best (though far from perfect) comparison with surface temperatures. Unfortunately it has not been updated in line with the new method for determining the TMT (from which it is derived).
Hi Rob. You may want to check your decadal trends. Based on the raw GISS LOTI, HADCRUT4 and Berkeley Earth (land+ocean) data, they appear to be too high for the last 120 months. As determined by EXCEL, for the past 120 months of data, the raw data present the trends of:
0.312 deg C/decade for Berkeley
0.314 deg C/decade for GISS
0.306 deg C/decade for HADCRUT4
I suspect you're presenting 9-year (108-month) trends.
Cheers
I suspect you're right, Bob. Not sure what I did there.
Will do an update. Thx!
Fixed. Thanks for pointing that out, Bob.
Tom, My sense of the TLT data is that it's sort of a worst of all worlds. While you're right, it is probably the satellite product most similar to the surface data, the channel still peaks well above the surface, plus is measuring a significant portion of the upper troposphere.
It seems to me it's probably better to look at satellite data and surface data as apples and oranges, and use them to communicate the different aspects of the climate system each is measuring. And for that, TTT is probably the superior channel over TMT or TLT.
Why calling it 'Tracking the 2 C Limit' when the discussion is about the various measures of the rising temperature. The 2 C Limit discussed at the Paris Conference is a hypothetical value when in actual fact the temperature will continue to rise although the rate trend will depend on how rapidly the global rate of greenhouse gas emissions decreases. The original referral was to '2 C by 2100' not to '2 C Limit'
It is clear the data shows that there is a good chance the decadal warming trend is accelarating. But the trend is only borderline statistically significant, to 2-sigma anyway? That is Steve L's point?
I am just playing contrarian here.
It's a little challenging to get statistical significance with 10 years of data. The point is, the trend over the past decade is running warmer than the long term trend.
denisaf... This is an ongoing series I've been doing posting this chart showing where we are relative to the 2C limit. And no, the 2C limit dates back to the original UNFCCC in Rio and that doesn't state "2C by 2100." The idea is that we need to limit global temperature to 2C, period. And now there are even more aggressive proposals to limit warming to 1.5C.
I see it more dire: Science is documenting frightening trends, scientific professionalism depending on sustention of credibility, must systematically emphasis prudent conservative interpretations, especially in light of ruthless backlash, and backstabbing, by economic interests leveraged in politics; the result is constant error on the conservative side. What this means is that we will always find surprises on the negative side, because science would not err on the pessimistic side on this issue; we see it in IPCC reports every time.
My pessimistic interpretation, is that we will find strange extremes, like that tectonic motivation is affected, maybe primarily motivated by ice, and water loads choreographed by lunar gravitation. I know I am being the lone-deranger on this lightly held hypothetical-theory, but it’s an illustration of the strange surprises to expect.
PluviAL, in short I agree enitrely: science is heavily political but it always was.
The people lead: Governments follow! This is what we all don't realise yet the media moguls know that our lack of information as a general public is the key to the status quo continuing to buy our representative governments.
In Leonardo DiCaprios movie he talked about a certain thickness of ice that had melted off Greenland.
That sounded like the scariest part of the movie to me: but was it true?