


 Arguments


A Looming Climate Shift: Will Ocean Heat Come Back to Haunt us?
Posted on 24 June 2013 by Rob Painting
- Despite a large increase in heat being absorbed by the Earth's climate system (oceans, land & ice), the first decade of the 21st century saw a slowdown in the rate of global surface warming (surface air temperatures).
- A climate model-based study, Meehl (2011), predicted that this was largely due to anomalous heat removed from the surface ocean and instead transported down into the deep ocean. This anomalous deep ocean warming was later confirmed by observations.
- This deep ocean warming in the model occurred during negative phases of the Interdecadal Pacific Oscillation (IPO), an index of the mean state of the north and south Pacific Ocean, and was most likely in response to intensification of the wind-driven ocean circulation.
- Meehl (2013) is an update to their previous work, and the authors show that accelerated warming decades are associated with the positive phase of the IPO. This is a result of a weaker wind-driven ocean circulation, when a large decrease in heat transported to the deep ocean allows the surface ocean to warm quickly, and this in turn raises global surface temperatures.
- This modelling work, combined with current understanding of the wind-driven ocean circulation, implies that global surface temperaures will rise quickly when the IPO switches from the current negative phase to a positive phase.
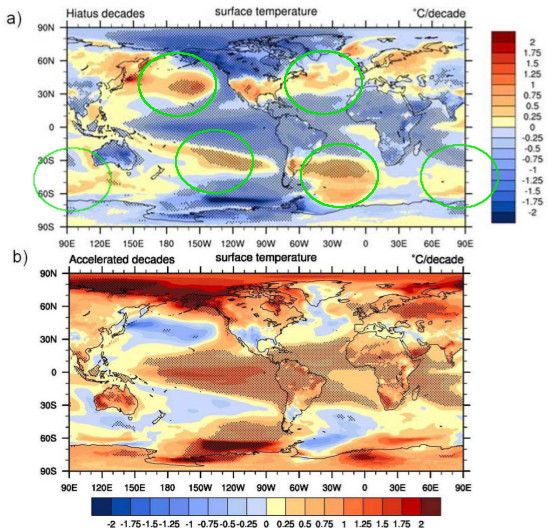
Figure 1 - average sea surface temperature trends from the climate model simulations for a) 'hiatus' decades, i.e. decades with no warming of global mean surface temperatures, and b) 'accelerated' decades, i.e. decades with greater-than-average rises in global surface temperatures. The subtropical ocean gyres (green ellipses) are key players in the downward transport of heat. The stippling indicates areas where this trend is statistically significant. From Meehl (2013).
Even with Global Dimming, Still Lots of Warming Down Below
The way that global warming has progressed in the 21st century has probably been a great surprise to many people, no doubt a few climate scientists among them. Despite a strong increase in planet-warming greenhouse gas emissions, warming of global surface temperatures has been rather muted. Surface temperatures have warmed, but at a slower rate than the last two decades of the 20th century.
Of course, the 2000's doesn't strictly qualify as a hiatus decade as defined in Meehl (2013) - where hiatus decades are described as negative global surface temperature trends - but it is, nevertheless, a suitable analogue.
Increases in sunlight-blocking sulfate pollution (from industrial activity) during the early part of the 21st century have probably played a role (Hatzianasstissiou [2011]), as have sulfate emissions from tropical volcanoes (Solomon [2011], Vernier [2011]), but the most significant contributor to this muted surface warming trend are natural changes in the way heat is stored in the ocean.When large amounts of heat are efficiently transported to the deep ocean (as in the 2000's - see Levitus [2012], Nuccitelli [2012] & Balmaseda [2013]), there is less heat available at the ocean surface with which to raise global surface temperature.
This can be better understood by considering the effects of the El Niño-Southern Oscillation (ENSO) on the vertical distribution of heat in the surface layers of the ocean. During El Niño heat builds up in the surface layers where it is able to interact with the atmosphere, and therefore raises global surfaces temperatures. During La Niña much more heat is transported to deeper ocean layers and, with the surface layers cooler-than-normal, global surface temperatures are cooler-than-average. This can be seen in Figure 2 - using observations from the global system of ARGO floats.
Figure 2 - Time?series of globally-averaged (60°South to 60°North) ocean temperature anomaly from the monthly mean, versus depth in metres (pressure in dbar).(b) Time?series of globally-averaged sea surface temperature anomaly (black, °C), ocean temperature at 160 metre depth (blue), and the Nino3.4 regression estimate for SST (red). From Roemmich & Gilson (2011).
The Interdecadal Pacific Oscillation (Power [1999]) is an index for the mean state of the north and south Pacific Oceans. During the positive phase, El Niño is the dominant global weather pattern, and during the negative phase, La Niña is dominant. During the late 1990's the positive IPO phase weakened considerably and has been in the negative phase since the year 2000. In other words, La Niña been the dominant pattern of late. It is therefore not surprising that global surface temperatures during the 2000's have warmed less than previous decades (1977-2000) - when the IPO was in a positive (El Niño-dominant) state.
Some Background Context
Present warming of the global oceans is a result of increased atmospheric concentrations of greenhouse gases warming the thin cool-skin layer at the sea surface. This reduces the typical rate of heat loss from the ocean to the atmosphere above, and therefore causes the oceans to grow warmer over time. So much like greenhouse gases trap heat in the atmosphere, by reducing the rate of heat loss to space, they also reduce the rate of heat loss from the ocean too. While changes in the ocean circulation brought on by warming can, and probably do, contribute to overall uptake of heat by the ocean, this greenhouse gas-induced warming of the surface ocean is the dominant player over the long-term.
Though not strictly true, it's easier to think of the ocean circulation as two distinct but interconnected processes - the wind-driven ocean circulation which warms and ventilates (mixes air into) the surface-to-deep ocean (down to about 2000 metres), and the thermohaline circulation which warms and ventilates the deep-to-abyssal ocean (2000 mtrs to ocean floor), and which is mainly driven by changes in the bouyancy and density of seawater. The wind-driven ocean circulation can be described as a pool of warm salty surface ocean sitting on top of a cold fresh (less salty) abyssal ocean.
The transport of heat down into the surface to deep ocean occurs via the subtropical ocean gyres (green ellipses in Figure 1). These are large rotating masses of water, in each ocean basin, where ocean currents converge at their centre and are forced downwards, taking warm surface water with them. Future SkS posts will deal with the ocean gyres and how they operate, but note that changes in the winds which power the ocean gyres affect the transport of heat down into the ocean, and also the transport of heat from the tropics to the polar regions. Intensified tropical easterly trades winds, for instance, spin up the ocean gyres leading to greater downward, and poleward, heat transport (see Roemmich [2007]).
Accelerated Warming and Hiatus Decades
Meehl (2013) once again uses the NCAR CCSM4 climate model to evaluate decadal periods of either accelerated warming, or slight cooling (hiatus decades). To accomplish this the authors use a moderate future (fossil fuel) emissions scenario for the 21st century combined with historical simulations of the 20th century. This future emissions scenario is chosen because the climate forcing is not so strong that hiatus decades disappear entirely in the latter part of the 21st century simulations.
From five climate model runs of the 21st century the authors derive 500 years worth of simulations. The hiatus decades were chosen based on a slight cooling trend in global surface temperatures of less than -0.08°C per decade. Eight decades match this criteria and the composite of their surface temperature trends are shown in Figure 1(a). If a zero decade-long temperature trend were chosen as well, then there are many more decades that fall under that criteria, including three instances where no warming lasts for 14 years, and one where this persists for 15 years.
For the accelerated warming decades the authors choose decades where the global surface warming is at least 0.41°C per decade (around twice the observed warming over the last few decades based on GISTEMP). Like the hiatus decades, these large values for the accelerated warming decades were chosen so that the trends were obvious. The composite of the trends for these accelerated decades are shown in Figure 1(b).
It is apparent in Figure 1, that the hiatus and accelerated warming decades are virtually the mirror image of each other. The warm sea surface temperatures in the gyres, during hiatus decades, indicate convergence of near-surface currents and strong downwelling of heat. With accelerated decades the vertical, and poleward, transport of heat by the gyres seems to shutdown, enabling strong sea surface warming in the tropics - where most solar radiation enters the ocean. The strong warming in the polar regions is related to changes in the thermohaline circulation.
A comparison of the accelerated warming and hiatus with regard to all the other decades in the simulations is shown in Figure 3. Obvious is the tendency for warming of the deeper ocean layers during hiatus decades, and warming of the surface ocean layer (0-300m) during accelerated warming decades.
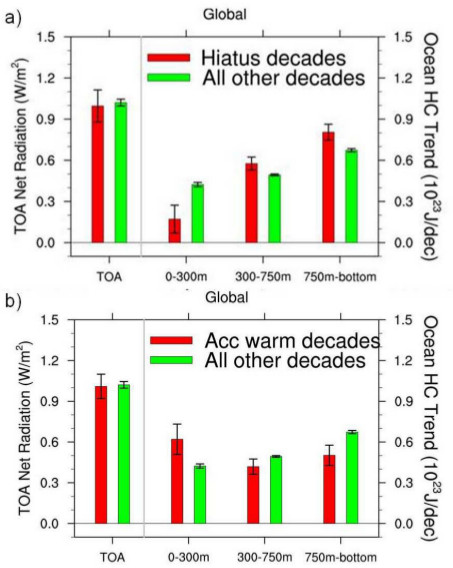
Figure 3(a) - average linear trends for hiatus decades versus trends for all other decades, broken down into 3 ocean layers. The top-of-the-atmosphere radiation balance (left-hand columns) is strongly positive, indicating a strong global warming trend. The error bars denote 5% statistical significance. 3(b) - same as above except for accelerated warming decades. From Meehl (2013).
Although I have not delved into it here (to keep things less complicated), changes to the thermohaline circulation, specifically the Atlantic Meridional Overturning Circulation (AMOC) and Antarctic Bottom Water (AABW) formation, also play a part in the hiatus and accelerated warming decades in the climate model. The thermohaline changes associated with the IPO suggest a common mechanism at work - most likely the changes in wind forcing. All three processes (IPO, AMOC & AABW) are contributors in each hiatus and accelerated decades, but the authors analysis reveals the IPO to play the dominant role.
A Looming Climate Shift
During the late 1970's global surface temperatures changed so quickly (Graham [1995]) that some researchers labelled this a 'climate shift' (Miller [1994], Wainwright [2008]). It was later shown that this climate shift was simply the human-caused global warming trend combining with the positive (warm surface ocean) phase of the Interdecadal Pacific Oscillation (Meehl [2009]). With both driving forces moving in same (warming) direction, they combined to nudge global surface temperatures sharply upwards.
The late 1970's climate shift is an appropriate analogue for the near-future because, based on the modelling in Meehl (2013) and other peer-reviewed scientific papers not discusssed here, the current negative IPO (cool surface ocean-warm deep ocean) trend is likely to come to an end sometime soon. The NCAR climate model suggests that these phases can last up to 15 years, but are generally around a decade in length. This climate model-based IPO cycle length is shorter than the IPO cycle length observed during the 20th century, however the reasons for this disparity are not yet clear.
Whenever this phase reversal does kick in there are likely to be significant changes in global rainfall patterns (Dai [2012]), drought, mass coral bleaching and fish catches (caused by change in the wind-driven upwelling of nutrients in key areas of the ocean). Just how significant this is will depend on how much heat remains in the surface ocean during the next positive phase of the IPO.
So to answer the question posed in the title - will ocean heat come back to come to haunt us? Yes, but perhaps not in the way some might think. Heat buried in the deep layers of the ocean will not re-surface any time soon. Instead, when the subtropical ocean gyres spin down, they will no longer be efficiently removing heat from the tropical surface ocean. The transport of ocean heat to depths, and to the poles, will drastically slow down, and this will allow the surface of the tropical oceans to warm rapidly. That heat is very likely to haunt us.


Can you say how strong the empirical evidence is for rapid warming to start in the near future? As a non-scientist climate change communicator I'd like to let people know what the balance of evidence is without being too alarmist.
Individuals will make their own decision as to whether they find this information alarming or not. The consequences of a shutdown of the wind-driven ocean circulation could be very profound. As for previous behavior of the Interdecadal Pacific Oscillation, given that many readers will not be familiar with this index - I'm writing a follow-up to this post.
Thank you Rob.
Figure 3 is very interesting and exactly what you would expect from an increase in ocean circulation.
It has a major bearing on a problem I'm wrestling with at the moment: Can OHC be used as a diagnosting of a change in forcing - specifically does the continued OHC accumulation over the last decade actually mean that there has been no significant change in forcing?
My intuitition says (and I'm working on checking it), that a flattening in forcing would lead to the following effects:
Note that this is similar, but not identical to the fingerprint of a hiatus decade. The only difference is that in a hiatus decade the rate of warming of the deep oceans increases.
If I am correct, then the continuing increase in OHC is not sufficient evidence to conclude that global warming is continuing unabated, because the oceans would continue to play catchup to the new level of forcing whether or not the forcing had flattened - you can't tell a flattening in the forcing from an increase in circulation (at least at first). However an increased rate of deep ocean heat accumulation does provide a fingerprint which distinguishes between the two.
The next question would be how long does it take to distinguish between them?
Kevin - intensification of the wind-driven ocean circulation speeds up the rate of Ekman pumping in the centre of the ocean gyres. In effect, more warm water is taken from the surface layers in the subtropics and transported to deeper ocean layers. The vertical column of water in the centre of the gyres, where downwelling occurs (known as Taylor columns), become more rigid as the ocean gyres spin up. These columns lengthen as a result of the spin-up, so warmer water is displaced vertically in the ocean. One of the consequences of this enhanced ocean circulation is stronger upwelling (Ekman suction) in the equatorial regions (stronger easterly trade winds), and a stronger poleward transport of warm surface water away from the equator (in the western boundary currents), combined with a stronger equatorward transport of cold polar surface water in the Eastern Boundary Currents.
What I'm getting at is that the trends shown in figure 3 are precisely what we would expect based upon the motion of fluids on a rapidly rotating planet such as Earth. So the effects you point out in 1-3 are in fact a sign that the wind-driven ocean circulation has strengthened.
I believe a lot of confusion still exists because of the failure to account for the effects of global dimming in the early part of the 2000's. As shown in the Roemmich et al (2007) paper I have linked to in the post, the South Pacific subtropical gyre spun down at around the same time that Hatzianasstissiou et al (2011) show a strong dimming of surface solar radiation - mainly in the Southern Hemisphere.
Yes, that's what I said. What I'm trying to get at is whether there are other causes which could have the same effect (or sufficiently similar effects that we would need more complex fingerprints to distinguish them).
i.e. If A causes X and B causes X, then X doesn't allow us to choose between causes A and B.
I'm just working on a model - more later.
It is interesting that the 20th century IPO phases seem to line up fairly well with another cycle I've heard about more frequently in the past, the 'Pacific Decadal Oscillation' (PDO). From what I can gather on the geography of where they each occur these aren't the same thing, but it seems likely that there is some connection.
Both cycles also line up with previous 'warming breaks' in the early 1900s and 1950s to 60s. The previous warming break is often attributed to aerosol pollution blocking incoming sunlight and that is also considered a possible cause of the current 'slow down' in atmospheric warming, but seems unlikely to have been a significant factor when atmospheric temperatures dipped ~1910. Meehl's model showing a mechanism for this correlation between the IPO cycle and warming shifts suggests that the 'natural cycle' is a principal factor, though it would still be useful to nail down how much aerosol pollution is contributing to the effect.
Given that IPO cycles seem to last between 15 and 30 years I'm not sure we can say the shift back is going to happen 'soon'. It could be any time now... or 15 years down the road.
OK, very interesting result - my intuition appears to be completely wrong on this.
I made a simple model in which the atmosphere is constantly in equilibrium with the difference between forcing and ocean heat uptake, equivalent to the effective sensitivity equation. Then I drove this from a 2 box model in a TCR experiment (although any realistic response function will give the same result).
If focing levels out, then the heat flux immediately reverses so that heat leaves the ocean rather than entering it. This heat goes into the atmosphere, warming it. That's where 'warming in the pipeline' comes from.
If this model is plausible then a flattening in forcing looks completely different from a hiatus decade, even using only total OHC as a measure.
The model is flawed because the heat reservoir doesn't have a temperature. I need to redo the whole thing with a thermodynamic model as a check.
Bigger problem - the reservoir isn't in equilibrium with itself. OK, think this is too hard to solve with either intuition or simple models.
"The transport of ocean heat to depths, and to the poles, will drastically slow down, and this will allow the surface of the tropical oceans to warm rapidly."
This is -dare I say the word? - alarming.
Are we already getting long lived warm zones in deep water beneath and around the gyres? How much heat and time before that drastic slowing down?
My own interest in ocean heat has been mostly as a better way to communicate the ongoing nature of the ghg induced change in global heat balance in the face of strident claims that warming has been slowing down. The ups and downs of global air temperatures allow the unfortunate impression that global warming is something that waxes and wanes; Dana and co's combined ocean, land, ice and atmosphere heat content shows much less internal variability and, if used as a reference measure, would probably never go as long as one American or Australian election cycle without showing clear signs of ongoing warming.
Isn't the escalator graph not showing this phenomena in a perfect way?
A good assembly of information to study but I have a quibble with the title. Has a question that's rhetorical as phrased - I would not think it possible that warmer oceans over centuries have no effect in the atmosphere and just sit quietly down there (more energy for more weather). I don't quite agree with "Come Back" as the descriptive phrase. Sun heat will in general keep moving through into ocean. So, I'm adding "...in next few years" in my mind to your title to clarify that you are theorizing that we might fairly soon get the 1st of the larger weather events that will become increasingly standard over the coming centuries/millenia.
I have noticed something interesting:
The top-of-atmosphere energy imbalance (left columns in figure 3) barely changes from hiatus decades to decades with accelerated warming.
Shouldn’t the climate system as a whole accumulate more heat during hiatus decades because the colder surface loses less heat through radiation and evaporation? Shouldn’t heat that is stored in the deep oceans be much "safer" from being lost to space than heat in the upper oceans and atmosphere?
Can this apparent contradiction be explained by positive feedbacks?
After all, feedbacks like the amount of water vapour in the atmosphere only respond to surface warming, not the warming in the deep oceans. Could it be that the increasing feedbacks cancel out the amplified heat loss during decades with accelerated warming, keeping the TOA energy imbalance more or less stable as long as the forcing is steadily growing?
HK - Quite right, in that a continuing radiative imbalance coupled with a "hiatus" period means that the oceans are accumulating heat faster during that time. Thus a hiatus period essentially acts to speed (or in a warmer atmosphere period, slow) the climates response to any imbalance, changing the settling time to equilibrium.
In fact, a hiatus period (accompanied by accelerated circulation of warmed water into the deeper ocean) actually increases any existing imbalance - and again warms the climate faster. A period of radiative imbalance with a hiatus period will in sum result in a greater number of joules accumulated over that period.
The way I am reading this, the effect of changes in the IPO is _not_ that heat buried in the deep ocean resurfaces, it is simply that less heat gets buried than otherwise.
Does ARGO float data from the area of these gyres confirm that heat is descending near their centers? I would expect that floats near the gyre centers would show higher temperatures at depth than floats in other locations.
dvunkannon - yes, the deep ocean warming is occurring pretty much where we expect, given the behaviour of the wind-driven ocean circulation and the spin-up of the subtropical ocean gyres. The image below is from Levitus et al (2012) linked to in the article.
Rob Painting: I have noticed that the skeptics are making a big deal (as usual) out of any uncertainty of an average 0.09 C temperature change measurement by the Argo instruments and the issue of how to integrate the relatively new and short term data with more sparse older data. How robust are the assertions of greater depth heat increases that are being made by Levitus12 and BTK13, etc.?
tcflood - if they dont understand the role of central limits theorem in detecting small changes from average of large no. of instruments, then I doubt they will be interested in learning. However, for paper on what can be determined and to what accuracy from Argo, try Von Schuckmann and La Treon 2011.
Again, the pattern of targets is the message. These people have absolutely no interest in scientific progress or learning. They recognize that OHC is a simple and powerful (in the general public eye) counter to any of their simplistic "global warming stopped in XXXX" claims, and so they hammer at it, trying to find a way to break public confidence in it. Marcott = simple, powerful - kill it. Mann = simple, powerful - kill it. Arctic sea ice loss = simple, powerful - kill it. Transient climate response = confusing, hard to interpret - ignore it.
I think this research is positive step in proving that the Pacific Ocean is a bigger regulator in not only short term but longer term trends in global surface temperatures. "This climate model-based IPO cycle length is shorter than the IPO cycle length observed during the 20th century, however the reasons for this disparity are not yet clear". Does anyone have an idea on why the models are cutting short the cycle length of the IPO?
Rob Painting @5: "What I'm getting at is that the trends shown in figure 3 are precisely what we would expect based upon the motion of fluids on a rapidly rotating planet such as Earth."
I have a (probably very basic) physics question that has been nagging me since I first read about the early weather/climate simulation experiments with rotating dishpans/concentric cylinders in the Spencer Weart essays: Given that Earth is only rapidly rotating with respect to a non-Earth reference frame, why do things that are on Earth, and have been on Earth for a while, "feel" (i.e., physically act) like they are rapidly rotating? My intuitive sense is that it must have to do with extraterrestrial forces that come from specific locations and directions relative to which the Earth is rotating, like gravitational pull from the Sun, moon, and perhaps other objects, as well as the cycling on and off of irradiation from the Sun at most latitudes. Is this understanding correct, or is there some way that the Earth's "rotation" has an effect unrelated to other objects in space?
jdixon - it's too long-winded to explain in a comment, but perhaps the most significant consequence is that Earth's rotation causes large-scale rotation in both the atmosphere and ocean - because neither is firmly stuck to the Earth's surface like we are. It's called the Coriolis Effect, and is an 'imaginary force' emedded into equations to solve (describe) the motions of fluids. Hopefully this You Tube video makes this clear, but SkS will have some posts explaining the relevance of this (the Earth's rotation) to deep ocean warming.
Not sure what happened to my last comment. In case it disappeared, here is a plot of SST with land surface temps:
WoodforTrees
It seems to show that land and sea surface temps parted company after 1980, with sea surface lagging land surface by up to 0.4C. Is this a symptom of the process of heat being transferred to the deep ocean?
[RH] Fixed link that was breaking page formatting.
Rob, I'm puzzled to find you've published exactly the same article in two places; this site and at
http://climatestate.com/2013/06/24/a-looming-climate-shift-will-ocean-heat-come-back-to-haunt-us/
Doesn't that divide the comments and keep people from seeing updates and related information? Or is there a reason for doing it this way?
[JH] Rob Painting's article was posted on the website Climate State by prokaryotes, not Rob Painting. Because all materials posted on Skeptical Science are published under a Creative Commons license, they may be reposted by others. Reposting allows more people to access an article than otherwise would be the case.