Climate Science Glossary

Term Lookup

Enter a term in the search box to find its definition.

Settings

Use the controls in the far right panel to increase or decrease the number of terms automatically displayed (or to completely turn that feature off).

Term Lookup

Settings


All IPCC definitions taken from Climate Change 2007: The Physical Science Basis. Working Group I Contribution to the Fourth Assessment Report of the Intergovernmental Panel on Climate Change, Annex I, Glossary, pp. 941-954. Cambridge University Press.

Home Arguments Software Resources Comments The Consensus Project Translations About Support

Twitter Facebook YouTube Mastodon MeWe

RSS Posts RSS Comments Email Subscribe


Climate's changed before
It's the sun
It's not bad
There is no consensus
It's cooling
Models are unreliable
Temp record is unreliable
Animals and plants can adapt
It hasn't warmed since 1998
Antarctica is gaining ice
View All Arguments...


Username
Password
New? Register here
Forgot your password?

Latest Posts

Archives

A broader view of sea level rise

Posted on 12 May 2009 by John Cook

The last post on sea level rise emphasised that when analysing sea level rise (or any climate trends for that matter), it's inadequate to use just a few year's worth of data. However, I only went back 16 years. To obtain a more complete picture of sea level rise, I'm taking my own advice and going back to 1870.

Global mean sea level (eg - the global average height of the ocean) has typically been calculated from tidal gauges. Tide gauges measure the height of the sea surface relative to coastal benchmarks. The problem with this is the height of the land is not always constant. Tectonic movements can alter it, as well as Glacial Isostatic Adjustment. This is where land which was formerly pressed down by massive ice sheets, rebounds now that the ice sheets are gone.

To construct a global historical record of sea levels, tide gauge records are taken from locations away from plate boundaries and subject to little isostatic rebound. This has been done in A 20th century acceleration in global sea-level rise (Church 2006) which reconstructs global sea level rise from tide gauges across the globe. An updated version of the sea level plot is displayed in Figure 1:
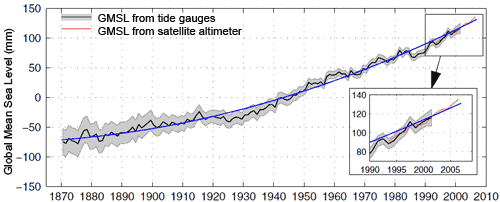

Figure 1: Global mean sea level from 1870 to 2006 with one standard deviation error estimates (Church 2008).

Tidal estimates from sediment cores go even further back to the 1300's. They find sea level rise is close to zero in the early part of the sedimentary record. They then observe an acceleration in sea-level rise during the 19th and early 20th century. Over the period where the two datasets overlap, there is good agreement between sedimentary records and tidal gauge data (Donnelly 2004, Gehrels 2006).

What we're most interested in is the long term trends. Figure 2 shows 20 year trends from the tidal data. From 1880 to the early 1900's, sea level was rising at around 1mm per year. Throughout most of the 20th century, sea levels have been rising at around 2mm per year. In the latter 20th century, it's reached 3mm per year. The five most recent 20-year trends also happen to be the highest values.
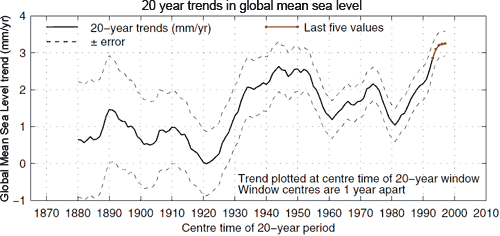

Figure 2: The linear trends in sea level over 20-year periods, with one sigma error on the trend estimates shown by the dotted lines. From 1963 to 1991, there were a series of volcanic eruptions which caused cooling and hence contraction of the upper ocean. This temporarily slowed the rate of sea level rise.

So a broader view of the historical record reveals that sea level is not just rising. The rate of sea level rise has been increasing since the late 19th century. In an upcoming post, we shall look at predictions of future sea level rise.

0 0

Printable Version  |  Link to this page

Comments

Comments 1 to 43:

  1. John, first let me commend you on a fine post. However, it seems to me it could have been written by a AGW skeptic. It is a good thing to get some historical perspective on climate change. Too often the alarmists fail to look at the extent of natural climate variability. Your post is actually drawing attention to the fact the globe has been warming naturally since the Little Ice Age. Kudos to you. Regarding how many years of data are required for a solid analysis, the issue goes directly to the quality of data and the physical theories involved. For example, if you are talking about annualized global surface temp (confounded with microsite issues and UHI effects) and measured in hundredths of a degree like HadCRUT3 - then yes you need more than a handful of years to have a viable trend. If you are talking ocean heat content and sea level rise, it is a different story. One of the greatest causes of sea level is thermal expansion. As the oceans get warmer, the sea level rises. Prior to 2003, we had sparse coverage of ocean temps and knew little about ocean depths. We now have more than 3000 ARGO network floats covering the globe giving us the best data on ocean temps down to 700m. It is far superior to the land-based observation system we have. And sea level is also measured very precisely by satellites giving us much better confidence of our instrumentation. So what physical theories are involved? The most important one is AGW itself. James Hansen has claimed that due to anthropogenic CO2 the earth has a radiative imbalance so that the earth's energy budget is out of balance. We have more heat coming into our climate system each year than going out. It is an interesting theory and could be catastrophic. Where would we see the most obvious evidence this theory is true? In the oceans! Water is very efficient at storing heat and the size and depth of the oceans means the heat stored there is many, many times greater than the heat stored in rocks or atmosphere. If AGW theory is true, ocean heat content and sea level would rise uninterrupted year over year over year. And it would rise at a rate much greater than the natural rates seen during the non-industrialized years. I have not actually seen any data on recent sea level rise, but I have read papers on ocean heat content. In calculating ocean heat content, scientists cross-check data from ARGO floats with the satellite measurements of sea level. If data shows one going up and one going down, they may have an error in their data somewhere. Within certain margins of error, this data has to correlate. According to Josh Willis of JPL, ocean heat content has not increased since 2003. This fact is the greatest challenge to the theory of AGW. And it tells me that sea level rise cannot be too great. Roger Pielke, an ISI highly cited climatologist, has blogged on AGW and ocean heat content at http://climatesci.org/2009/02/09/update-on-a-comparison-of-upper-ocean-heat-content-changes-with-the-giss-model-predictions/ Of course, other factors can impact sea level rise. One of them is plate tectonics. If plates shift and the ocean bowl is not as deep, sea level will rise. I look forward to your next post on sea level rise.
    0 0
    Response: I venture to say the difference between my post and a skeptic post is I haven't drawn any wild conclusions like "AGW is falsified" by the sea level record. An emerging theme on this website is that you need to get a complete picture in order to draw reliable conclusions. I haven't even begun to look at why sea level is rising. To do that, you need to look at all the causes of sea level rise - thermal expansion, melting glaciers, melting and calving ice sheets. That, again, is a topic for another post. The point of this post (and the previous post) was merely to disabuse the notion that sea level rise had stopped.

    As for ocean heat, why would you say ocean heat needs to show monotonic increase from year to year? On the contrary, measurements over the past 50 years of ocean heat have shown a noisy signal where short periods of cooling are not unusual amidst the long term warming trend. As this post shows, look at the complete record, not a short period, before drawing conclusions.
  2. Ron says: "If AGW theory is true, ocean heat content and sea level would rise uninterrupted year over year over year." All noise would completely disappear? Why? References on that assertion (real papers, not blog posts)?
    0 0
  3. Hi John: the link to Church 2006 didn't work for me. I wanted to see why in Figure 1 the standard deviation, after narrowing from 1870 to about 1995 then seems to broaden again. The other tidbit I found surprising was the apparently much greater effect of El Chichon vs Pinatubo. I think Ron Cram would like your old post: http://skepticalscience.com/Mystery-of-the-vanishing-ocean-heat.html and the linked update.
    0 0
  4. Philippe, I cannot recall if Hansen says it exactly the way Roger Pielke, the ISI highly cited climatologist I referenced above, says it. If you understand the assertion made by Hansen, then the conclusion in unavoidable. Is there a radiative imbalance or not? Is there any physical theory that would allow for a radiative imbalance in one year and not in the following year? Yes, a volcanic eruption would tend to block the sun for a period of time. It happened with Pinatubo and the oceans cooled. Other than volcanoes, there is very little noise. Absent a volcanic eruption, the radiative imbalance would be there year after year after year. Where is all that heat going? A miniscule amount is stored in dirt and rocks, even less in the atmosphere, and the vast majority is stored in the oceans. There is no competing theory. Hansen's abstract at http://www.sciencemag.org/cgi/content/abstract/308/5727/1431 states the following: "Our climate model, driven mainly by increasing human-made greenhouse gases and aerosols, among other forcings, calculates that Earth is now absorbing 0.85 ± 0.15 watts per square meter more energy from the Sun than it is emitting to space. This imbalance is confirmed by precise measurements of increasing ocean heat content over the past 10 years." The oceans definitely did warm in the 1990s. This paper was published in 2005. Hansen has not been touting ocean heat content since it has been determined the oceans have not warmed since 2003.
    0 0
  5. Steve, I am very familiar with the instrumental error found by Josh Willis. The significant ocean cooling previously reported was the result of an error in the fall rate of the instrument. Josh Willis is a fine scientist. Even after the error was corrected, the oceans have not warmed since 2003. That is a huge problem for anyone who understands the claim of a radiative imbalance for our climate system.
    0 0
  6. Good Post, I don't know how real the error bars can be on this, but I appreciate their existence in any event. I think we are seeing uncertainty being addressed and perhaps over simplified explanations are wrong no matter which side puts them forward. I wonder what a best straight line fit would tell you? Do you have a steady rise with rate variation due to climate variation or some other cause? Or is a curve as above really a better fit? Is it my imagination or do times of fast temp increase not match real great with times of maximum sea level rise? Is there a time lag? Much to think about.
    0 0
  7. re #1: Ron, I think we can get too carried away with analyses over very short periods, and it’s an excellent idea of John’s to expand his analysis of sea level rise with a historical perspective. However going back to the recent period, the absence of warming in the upper oceans during the last five years can’t really be taken as evidence that our understanding of the effects of enhanced greenhouse gas concentrations is flawed, and it’s certainly not true that “If AGW theory is true ocean heat content and sea level would rise uninterrupted year over year over year.” As for your additional comment that “it would rise at a rate much greater than the natural rates seen during the non-industrialized years.”, the evidence is actually consistent with that assertion . There are a number of points: 1. Global warming theory (that enhanced greenhouse gas levels results in an enhanced global surface temperature at equilibrium, somewhere in the region of 2-4.5 oC per doubling of atmospheric CO2) certainly doesn’t require an uninterrupted rise in heat content/sea level. Obviously one can have periods where the radiative forcing in a warming world is temporally static or reduced (say the few years during which the insolation drops towards the solar minimum such that it opposes the small enhanced greenhouse warming for this period). We might well find no heat uptake by the oceans, and no warming during this period. During the solar “upswing” towards the solar maximum, enhanced insolation will reinforce (rather than oppose) slowly rising greenhouse forcing. 2. The other question is whether heat uptake by the oceans really has stopped during 2003. That conclusion/assumption is actually not fully consistent with the evidence. It’s correct that there has been little heat uptake in the upper (700 metres) of the ocean as measured by Argo floats. However if one considers the ocean heat budget in the manner that you suggest in your post (i.e. the steric, warmth-induced sea level rise and mass rise from land ice melt should be consistent with measured sea level rise determined from satellites), the most recent analyses indicate that there has been some enhanced steric (heat uptake) contribution to sea level rise during the last five years (see references below [*, **]. These papers indicate that 15% (Cazenave) or 40-50% (Leuliette and Miller) of the sea level rise in the period 2004-2008 is steric (i.e. due to heat uptake). 3. Obviously these are very short periods of measurement/analysis. We certainly don’t expect an uninterrupted rise in sea level, and a 4-5 year period with no steric contribution to sea level rise (i.e. due to heat uptake) isn’t unexpected. However that actually seems not to be the case. The oceans likely have absorbed heat during the last 5 years. Obviously even if there is no net heat uptake due to a temporary balance of radiative forcing, we expect the sea level to continue to rise due to mass uptake from melting land ice in a warm world… 4. John Cross has shown that the evidence indicates sea level rise has accelerated since the mid/late 19th century. During at least the 1000 before the mid 19th century, and likely for a further millennium before that, the evidence indicates that there was little if any net sea level rise [***]. [*]Cazenave A et al. (2009) Sea level budget over 2003-2008: A reevaluation from GRACE space gravimetry, satellite altimetry and Argo Glob. Planet. Change 65, 83-88. abstract: From the IPCC 4th Assessment Report published in 2007, ocean thermal expansion contributed by similar to 50% to the 3.1 mm/yr observed global mean sea level rise during the 1993-2003 decade, the remaining rate of rise being essentially explained by shrinking of land ice. Recently published results suggest that since about 2003, ocean thermal expansion change, based on the newly deployed Argo system, is showing a plateau while sea level is still rising, although at a reduced rate (similar to 2.5 mm/yr). Using space gravimetry observations from GRACE, we show that recent years sea level rise can be mostly explained by an increase of the mass of the oceans. Estimating GRACE-based ice sheet mass balance and using published estimates for glaciers melting, we further show that ocean mass increase since 2003 results by about half from an enhanced contribution of the polar ice sheets - compared to the previous decade - and half from mountain glaciers melting. Taking also into account the small GRACE-based contribution from continental waters (<0.2 mm/yr), we find a total ocean mass contribution of similar to 2 mm/yr over 2003-2008. Such a value represents similar to 80% of the altimetry-based rate of sea level rise over that period. We next estimate the steric sea level (i.e., ocean thermal expansion plus salinity effects) contribution from: (1) the difference between altimetry-based sea level and ocean mass change and (2) Argo data. Inferred steric sea level rate from (1) (similar to 0.3 mm/yr over 2003-2008) agrees well with the Argo-based value also estimated here (0.37 mm/yr over 2004-2008). Furthermore, the sea level budget approach presented in this study allows us to constrain independent estimates of the Glacial Isostatic Adjustment (GIA) correction applied to GRACE-based ocean and ice sheet mass changes, as well as of glaciers melting. Values for the CIA correction and glacier contribution needed to close the sea level budget and explain GRACE-based mass estimates over the recent years agree well with totally independent determinations. [**] Leuliette EW and Miller L.(2009) Closing the sea level rise budget with altimetry, Argo, and GRACE Geophys Res. Lett. 36, art # L0406 abstract: An analysis of the steric and ocean mass components of sea level shows that the sea level rise budget for the period January 2004 to December 2007 can be closed. Using corrected and verified Jason-1 and Envisat altimetry observations of total sea level, upper ocean steric sea level from the Argo array, and ocean mass variations inferred from GRACE gravity mission observations, we find that the sum of steric sea level and the ocean mass component has a trend of 1.5 +/- 1.0 mm/a over the period, in agreement with the total sea level rise observed by either Jason-1 (2.4 +/- 1.1 mm/a) or Envisat (2.7 +/- 1.5 mm/a) within a 95% confidence interval. [***]Church JA et al. (2008) Understanding global sea levels: past, present and future. Sustainability Science 3, 9-22 . abstract: The coastal zone has changed profoundly during the 20th century and, as a result, society is becoming increasingly vulnerable to the impact of sea-level rise and variability. This demands improved understanding to facilitate appropriate planning to minimise potential losses. With this in mind, the World Climate Research Programme organised a workshop (held in June 2006) to document current understanding and to identify research and observations required to reduce current uncertainties associated with sea-level rise and variability. While sea levels have varied by over 120 m during glacial/interglacial cycles, there has been little net rise over the past several millennia until the 19th century and early 20th century, when geological and tide-gauge data indicate an increase in the rate of sea-level rise. Recent satellite-altimeter data and tide-gauge data have indicated that sea levels are now rising at over 3 mm year(-1). The major contributions to 20th and 21st century sea-level rise are thought to be a result of ocean thermal expansion and the melting of glaciers and ice caps. Ice sheets are thought to have been a minor contributor to 20th century sea-level rise, but are potentially the largest contributor in the longer term. Sea levels are currently rising at the upper limit of the projections of the Third Assessment Report of the Intergovernmental Panel on Climate Change (TAR IPCC), and there is increasing concern of potentially large ice-sheet contributions during the 21st century and beyond, particularly if greenhouse gas emissions continue unabated. A suite of ongoing satellite and in situ observational activities need to be sustained and new activities supported. To the extent that we are able to sustain these observations, research programmes utilising the resulting data should be able to significantly improve our understanding and narrow projections of future sea-level rise and variability.
    0 0
  8. Chris, I can appreciate the quote in the L&W paper: "we find that the sum of steric sea level and the ocean mass component has a trend of 1.5 +/- 1.0 mm/a over the period, in agreement with the total sea level rise observed by either Jason-1 (2.4 +/- 1.1 mm/a) or Envisat (2.7 +/- 1.5 mm/a) within a 95% confidence interval." In other words, the steric rise could be as little as 0.5mm/a over a multiyear period and some portion of this is due to salinity changes. I don't see how this is any different than the finding by Josh Willis that there has been no increase in ocean heat content since 2003. If one understands the impact of "0.85 ± 0.15 watts per square meter" radiative impact spoken of by Hansen, you would expect a much greater than observed warming. If you have been following the debates on total solar irradiance, you will note that changes in solar irradiance are said to be trivial. The lack of ocean heating cannot be traced to solar minimum, at least not by AGW alarmists. Regarding sea level rise centuries ago, yes, you would expect sea level to rise as the planet is coming out of the Little Ice Age. The mid-19th century was during the pre-industrial period and the beginning of sea level rise cannot be attributed to anthropogenic CO2. Regarding the amount of data needed for analysis, scientists will always prefer more data to less and they should. That does not mean that we do not have enough data now to seriously question the theory of AGW and to begin searching for ways the theory may need to be modified. To restate: It is not possible for an anthropogenically caused radiative imbalance of 0.85 ± 0.15 watts per square meter not to show up in warming oceans year over year over year without some observable intervention such as a major volcano. I just do not see how anyone can argue with that very basic observation.
    0 0
  9. re #9 1. solar irradiance. Ron you are mistaking the longish term trend in solar irradiance (which shows no net warming contribution at least since the mid 20th century and a small cooling contribution during the last couple of decades [*]), and the contribution from the solar cycle. Several analyses indicate that the peak to minimum solar cycle contributes of the order of 0.1 oC of cooling to the Earth's surface temperature (e.g. [**]). In a world warming under a greenhouse-induced radiative imbalance, at around 0.15 oC per decade, we expect the solar cycle cooling to "overpower" the greenhouse induced warming during the downturn (cooling) part of the cycle. Of course in the real world the solar cycle contribution is difficult to pull out since stochastic variation in the climate system (El Nino’s, volcanoes, cloud cover variation and such-like) generally masks the small solar cycle contribution in the surface temperature record. At present, since the solar minimum we’re currently in is somewhat prolonged we’re likely getting the full cooling “whack” from that. 2. steric (warming) contribution to sea level rise. You can’t take the minimum in an uncertainty range and base any conclusions on that whatsoever. After all one could use your “strategy” and state that the steric contribution to sea level rise is as much as 2.5 mm per year! Four years is an extremely short period of time in this context, and reduction in uncertainties requires longer analyses, certainly so if one is attempting to make fundamental, all-encompassing conclusions as you are. 3. As the recent papers I cited show, the evidence indicates there is a steric (warming) contribution to sea level rise during the last few years. That’s not necessarily incompatible with the Argo float data which shows a rather small steric contribution to sea level rise during this period. Perhaps some of the heat has penetrated somewhat more deeply into the oceans. Perhaps some of the Argo data is still flawed. This is a very new technology, and only 18 months ago it was shown that a problem with the Argo data was fooling everyone into thinking that the oceans were cooling: http://earthobservatory.nasa.gov/IOTD/view.php?id=35805 http://earthobservatory.nasa.gov/Features/OceanCooling/ as you said in your post #1 in reference to sea level rise and heat content: “If data shows one going up and one going down, they may have an error in their data somewhere. Within certain margins of error, this data has to correlate”. Exactly so. However the recent papers (see my post #7) seem to have reconciled any dichotomy. Sea levels have risen during the period 2004-2008. Some of this is due to ocean warming (steric) and some (likely more) due to increased ocean mass (land ice melt). Just as one cannot pick arbitrary extrema in uncertainty ranges to try to make a point, nor can one arbitrarily make a personal selection of which of two opposing data sets are correct under circumstances where there is uncertainty. After all the (short!) history of the Argo floats would tend to indicate that it’s more likely that any error (if there is an error) lies there. And we should reemphasise that we are dealing with extremely short periods of analyses! 4. pre-industrial sea level rise The evidence indicates that sea levels didn’t rise significantly during the millennium before the mid/late 19th century (see paper [***] in post #7). The notion that sea level rise is due to recovery from the Little Ice Age doesn’t make much sense in the context of the sea level record. After all, if any cooling forcings pertaining to the LIA were removed, the sea level rise would occur initially with a rapid rate that would decrease as the “recovery” was approached. The record (see John Cross’s figure 1 above) shows the opposite. In any case the “recovery” from the LIA was pretty much complete by the early/mid 19th century: http://en.wikipedia.org/wiki/Little_Ice_Age http://en.wikipedia.org/wiki/File:Sunspot_Numbers.png You specifically suggested (your post #1) that sea levels should “rise at a rate much greater than the natural rates seen during the non-industrialized years”. The evidence indicates that is the case, at least as far as net sea level rises are concerned. There was no significant net change in sea level (as far as we can tell) during the millennium (at least) before the mid-19th century (see my post #7); sea levels rose very slowly from the late 19th century (see John Cook’s fig. 1 above), and the rate of increase has accelerated through the mid-late 20th century. And although the early release of CO2 from fossil fuel use (and land clearance) was smallish in the late 18th/early 19th century, it was quite significant (atmospheric CO2 levels rose from 277 – 286 ppm in the period from the late 18th to mid 19th century [***], and this should have produced a small warming (0.1 oC within a climate sensitivity of 3 oC per doubling of atmospheric CO2). So the initial rise in sea level could indeed “be attributed to anthropogenic CO2”. Maybe it wasn’t of course. But you are making strong assertions that are either contradicted by straightforward evidence, or are only compatible with the arbitrary selection of extrema in ranges of uncertainties. [*] Lockwood M and, Frohlich C (2008) Recent oppositely directed trends in solar climate forcings and the global mean surface air temperature. II. Different reconstructions of the total solar irradiance variation and dependence on response time scale Proc. Roy. Soc. A 464, 1367-1385. abstract: We have previously placed the solar contribution to recent global warming in context using observations and without recourse to climate models. It was shown that all solar forcings of climate have declined since 1987. The present paper extends that analysis to include the effects of the various time constants with which the Earth's climate system might react to solar forcing. The solar input waveform over the past 100 years is defined using observed and inferred galactic cosmic ray fluxes, valid for either a direct effect of cosmic rays on climate or an effect via their known correlation with total solar irradiance (TSI), or for a combination of the two. The implications, and the relative merits, of the various TSI composite data series are discussed and independent tests reveal that the PMOD composite used in our previous paper is the most realistic. Use of the ACRIM composite, which shows a rise in TSI over recent decades, is shown to be inconsistent with most published evidence for solar influences on pre-industrial climate. The conclusions of our previous paper, that solar forcing has declined over the past 20 years while surface air temperatures have continued to rise, are shown to apply for the full range of potential time constants for the climate response to the variations in the solar forcings. [**]J. L. Lean and D. H. Rind (2008) How natural and anthropogenic influences alter global and regional surface temperatures: 1889 to 2006 Geophys. Res. Lett. 35, L18701. This isn’t stated in the abstract, but the analysis indicates a solar cycle (max-min) surface temperature change of 0.11 oC with a one month lag. [***]D. M. Etheridge et al (1996) "Natural and anthropogenic changes in atmospheric CO2 over the last 1000 years from air in Antarctic ice and firn J. Geophys Res. 101, 4115 -4128.
    0 0
    Response: It's a common mistake but my name is John Cook, not John Cross :-)
  10. Ron Cram "The mid-19th century was during the pre-industrial period" is simply not true. The industrial revolution got under way in the middle of the eighteenth century (and arguably could even be traced back to about 1700) and was in full swing by the mid nineteenth. There was then a "second industrial revolution' from about 1880 to 1914 as the technological developments of the first part of the industrial revolution allowed the start of all kinds of new industries. So if you want to look at human contributions to global warming you need to look a long way back. And then observe the acceleration of industrial production as time went by.
    0 0
  11. David Horton, You could even go back a little further than this and link anthropogenic influences to LIA cooling. http://news.bbc.co.uk/1/hi/sci/tech/4755328.stm http://news-service.stanford.edu/news/2009/january7/manvleaf-010709.html ...although others believe natural influences (solar, volcanic) are the key drivers of the few tenths of a degree of global mean temperature change during that period. Regardless, recent warming has been very rapid. http://www.realclimate.org/index.php/archives/2008/09/progress-in-millennial-reconstructions/
    0 0
  12. Chris, 1. So you are claiming changes to solar irradiance can cause cooling but not warming? The solar physicists I know will be very surprised to hear that! 2. My comment was intended to point out the error bars were nearly as large as the supposed change. Anytime I see that I have to become skeptical of any real change, especially when other scientists have already published saying there has been no significant warming. 3. The Argo data is far and away the best observation network we have for the climate system right now. The surface observation system is confounded with many problems, the greatest being the fact it is looking at atmosphere and not ocean storage of heat. Your dismissal of the Argo network because you don't like the data is troubling to me and should be troubling to you. The Argo technology is not that new. The instruments that measure temperature and salinity are very precise and reliable. The only problem the floats had were with the fall rate, so that the numbers being reported were thought to come from a different ocean depth. I do not know anything about the methods of L&W or the other papers you cited, but I do know about the Argo network which began deployment back in 2000. Argo has had global coverage since 2003, take very precise measures and now we know about the potential for fall rate error so it is being watched very carefully. 4. Regarding pre-industrial sea level rise, take a look at any chart of CO2 emissions. Very, very little CO2 was emitted from 1850 to 1900. In fact, CO2 emissions did not really kick in until 1950. CO2 rise cannot explain the increase in global temps from 1910 to 1942.
    0 0
  13. David, my comment was linked more to industrial emissions of CO2 than to any historical debate about when the industrial period began. Look up CO2 emissions from 1850 to 1900 and you will see they were miniscule compared to emissions in the last half of the 20th century or compared to natural changes to atmospheric CO2 from the carbon cycle. There is no way CO2 can be blamed for sea level rise during the years 1850-1900.
    0 0
  14. Ron Cram said: "1. So you are claiming changes to solar irradiance can cause cooling but not warming? The solar physicists I know will be very surprised to hear that!" Re-read what Chris said. He said that the drop from maximum to minimum was 0.1 degrees C. Funny that you should completely misinterpret that to "can only cause cooling." Also there are at least two other problems identified in the ARGO system besides the one you mention. See: http://www.argo.ucsd.edu/index.html
    0 0
  15. Re #12 1. Ron, I'm not claiming anything of the sort. Can you clarify where you got that idea?! I pointed out that the evidence indicates the solar cycle results in a surface temperature response of around 0.1 oC of cooling max to min, and obviously 0.1 oC of warming min to max. I pointed out that there has been no warming trend in the solar irradiance since the late 1950's...if anything all measures of solar parameters indicates a small cooling solar contribution during the last two decades. There was very likely a small solar contribution to warming in the early part of the 20th century (1900's-1940's). 2. Well yes. 4-5 years is an extremely small time period in this context. It's not surprising that there are large uncertainty ranges in the measurements...however one cannot cherrypick extrema from uncertainty ranges! The bottom line is that the ocean heat/sea level rise "budget" seems to have been "closed" by analyses published in a couple of papers earlier this year (see my post #7 and papers cited there). The evidence indicates that there has been a steric (warming) contribution to sea level rise during this period. Thus one cannot conclude that heat uptake by the oceans has stopped since 2003, since the evidence indicates that it hasn't. Obviously we'll have a clearer picture (less uncertainty) as time progresses. 3. Fair enough. Unless additional errors appear in the Argo data one may as well assume that the Argo output is accurate. There may or may not be an inconsistency in the Argo data compared to the sea level-mass-steric analysis. 4. Atmospheric CO2 levels rose from ~ 286 ppm - 297 ppm in the period 1850-1900, and from ~300 ppm to 309 ppm from 1910-1940 (the two periods you specified) [see ref. [***} in my post #9]. Within a climate sensitivity of 3 oC of surface warming per doubling of atmospheric CO2 concentration, this should yield warmings near 0.15 oC and 0.13oC, respectively. So the CO2 rise most likely did contribute to warming (and sea level rise) during these periods. Of course no one is suggesting that raised CO2 was the sole cause of warming during these periods. It's likely that there was a solar contribution to warming at least during the period 1910-1940; some of the warming during this period was also due to recovery from high volcanic activity (aerosolic cooling).
    0 0
  16. for John Cook re my post #9. Sorry for calling you John Cross...I did get it right once in my post! If you want to edit my post and delete this one, you could tidy up my mistake... while I'm acknowledging/confessing my posting errors, I inadvertently failed to close a "blockquote" in a recent post on the volcanoes thread: http://www.skepticalscience.com/argument.php?p=9&t=221&&a=28 and that seems to have been carried through subsequent posts! I usually save my long posts with markups as a .htm for viewing in a web browser to chack that it's all O.K., but an unclosed "blockquote" right at the end of a message doesn't show up!
    0 0
  17. Chris, 1. I'm sorry. I misread you. Now I see what you are saying. However, the real warming happened from 1975-2000, not from 1950. According to Labitzke of UCAR, about one-third of warming from that period was solar. Based on the conclusion of his presentation, solar did increase during this period. That was why I misread you. I was certain you were familiar with this commonly held opinion. http://cedarweb.hao.ucar.edu/workshop/tutorials/2001/Labitzke.pdf 2. The amount of data needed depends on the quality of the data and the physical theories in play. Yes, we can conclude that heat uptake by the oceans has stopped based on Argo data. BTW, one of the reasons I like Argo data is that it is freely available to everyone and therefore less susceptible to arbitrary and unexplained adjustments. Craig Loehle recently updated the Willis study with the latest data and guess what? It shows more pronounced cooling of the oceans. You can download the Loehle paper at http://www.ncasi.org/publications/Detail.aspx?id=3152 3. BTW, Loehle points out some reasons to be skeptical of the Argo data. 4. Where are you getting your numbers for CO2? Have you looked at the amount of human emitted CO2? It is extremely minimal. Any change in atmospheric CO2 during these early periods had more to do with the natural carbon cycle than any human contribution.
    0 0
  18. Ron Cram, Regarding point #2, keep in mind Energy & Environment is not at all a reputable scientific journal. It was set up by like-minded skeptics and is not carried by the ISI. The editor even has admitted to following a political agenda. http://en.wikipedia.org/wiki/Energy_and_Environment
    0 0
  19. #13 Ron Cram. There is some evidence, and the proposition seems obvious, that from the time humans started altering the environment on a massive scale through agriculture they were having an impact on atmospheric chemistry. Up until that point, hunter-gatherer humans, like other animal species, were consuming plants that were replacing themselves, leaving CO2 in balance. Agriculture changes the equation by extensive land clearance and the build up of numbers of domestic animals. However the changes are still not likely to be great. It is only in the industrial revolution that we start extensively burning the locked up carbon in coal and oil. And sure, this process accelerates, but from the time it began we started to sow the seeds, unknowingly, of the accelerating disaster we have now. So picking a precise starting point for human effects is somewhat futile. Recognising the reality of the effect is essential.
    0 0
  20. NewYorkJ, I know the reputation of the editor of E&E. I also know E&E has published papers no other journal would publish only to have the findings published in E&E confirmed in subsequent AGU journal articles. One example is the M&M paper on the Hockey Stick. I also know the reputation of Craig Loehle, which is very good. Ad hominem attacks, against a journal's editor or the author of a paper, do not carry much weight with me. If you can find something wrong with Loehle's paper, then you would be doing real science. If you find something, let me know. David, land use/land cover changes can impact temperature as Roger Pielke and others have been pointing out for a long time. But the main impact of land use/land cover changes is not to CO2. If it was, the issue would be more warmly embraced by the IPCC and Roger would not be so adament that CO2 is not the only impact. Contrary to IPCC statements, no one really knows how much of the warming in the last quarter of the 20th century was natural and how much was from 50 years of accumulated anthropogenic CO2. It is a total fallacy to think a few PPMs of atmospheric CO2 in the last half of the 19th century is going to have a measurable impact on the atmosphere or ocean heat content or rising sea levels. You do know that atmospheric CO2 levels change naturally right? You do understand the carbon cycle?
    0 0
  21. Ian, I was not aware of any recent problems so I appreciate you bringing this to my attention. As I read over the link you provided, it appears to be the same problem being discussed twice- a slow internal leak is causing false pressure readings. The first notice indicates a few floats will be greylisted as uncorrectable. For the others, adjustments will be made. The second notice discusses the fact newer floats seem to have this problem in greater numbers. They are working on a more reliable testing procedures but also working on a new style of pressure sensor from a different manufacturer. We will have to wait to see what impact the necessary adjustments will have on the data.
    0 0
  22. Ron Cram, It's not an ad hominen to reference a quote from the journal's editor: "I'm following my political agenda -- a bit, anyway. But isn't that the right of the editor?" I admire his honesty, but to answer his question: no - not if you want your journal to be respected. Rarely-cited sub-standard journals set up by like-minded skeptics don't carry much weight with the scientific community. It's no better than a self-published reference. What I do know is that the latest peer-reviewed research in the field now renders Loehle one of the last "ocean heat content cooling" holdouts.
    0 0
  23. Ron, I think we've established that oceans have likely continued to take up heat at least during the 5 year period to 2008. The scientific evidence supports that conclusion (see references [*] and [**] in my post #7 above). The magazine note by Loehle that you url hardly lends itself to a contrary conclusion, finishing as it does with:
    ”While the current study takes advantage of a globally consistent data source, a 4.5-year period of ocean cooling is not unexpected in terms of natural fluctuations. The problem of instrumental drift and bias is quite complicated, however, (Domingues et al. 2008; Gouretski and Koltermann 2007; Wijffels et al. 2008; Willis et al. 2004, 2008a) and it remains possible that the result of the present analysis is an artifact.”
    re #17/#20 Your assertions about the lack of contribution of land use changes to atmospheric CO2 levels, and the contribution of mid19th-mid20th century increases in atmospheric CO2 to temperature changes don't accord with the evidence: 1. Atmospheric CO2 levels are recorded in the Antarctic Law Dome cores going back 1000 years (see reference [***] in my post #9)...these have more recently been extended back 2000 years (see [*] below). These data allow insight into natural variability on the decadally-averaged timescale (since the CO2 data in these high resolution cores is averaged on that timescale). During the period from around 1100 to around 1570, for example, atmospheric CO2 levels were ~ 281 +/- 3 ppm. That gives an indication of the variation under relatively stable climatic conditions within a system in which carbon is cycled through the atmosphere/land and oceans. It's small, and especially so when yearly variation (El Nino years result in a slightly enanced [CO2], and vice versa for La Nina's, for example) are averaged out in the cores. Atmospheric CO2 levels dropped during the period of the LIA (275 ppm +/- 2 pm during the period 1600 to the middle of the 18th century). By 1800, CO2 levels were back to the pre-LIA levels of 283/284 ppm. In other words the carbon cycle had re-established its pre-LIA "equilibrium" by the early part of the 19th century. The rise in atmospheric CO2 levels from ~ 286 ppm - 297 ppm in the period 1850-1900, and from ~300 ppm to 309 ppm from 1910-1940, are very clearly outwith the natural variation seen in the preceding 800 years. They don't go up and down slowly over long periods (the fall in CO2 into the LIA was relatively fast), but go up and up rather quickly in the context of natural variation. They are very likely the result of anthropogenic emissions and land use changes. We could document the evidence for this, but perhaps this thread isn't the appropriate place. 2. These rises in atmospheric CO2 are expected to make a significant contribution to the surface temperature changes during these periods. It's very easy to calculate that within a climate sensitivity right in the centre of the likely range (3 oC of warming per doubling of atmospheric CO2), the enhanced greenhouse warming during the two periods is 0.15 oC and 0.13 oC, respectively. Since the total global warming from the mid 19th century to the mid 20th century was around 0.3-0.4 oC: http://www.cru.uea.ac.uk/cru/data/temperature/ the anthropogenic contribution from industrial and land use changes could rather easily account for the bulk of the warming during this period. So clearly it's NOT a "total fallacy to think a few PPMs of atmospheric CO2 in the last half of the 19th century is going to have a measurable impact on the atmosphere or ocean heat content or rising sea levels"! Within our understanding of the greenhouse effect, we certainly expect that these small but significant rises in atmospheric CO2 should cause the surface to warm, and the oceans to take up some excess heat and expand somewhat. [*] C. MacFarling Meure et al. (2006) Law Dome CO2, CH4 and N2O ice core records extended to 2000 years BP Geophys. Res. Lett. 33, L14810.
    0 0
  24. NewYorkJ, you obviously do not know what an ad hom argument is. An ad hom argument is when you go after the person rather than deal with the facts they raised. All you are doing is saying "Yeah, but it's true." It is completely irrelevant. What is relevant is the question of whether or not Loehle's paper is accurate. If it is accurate, it could be published by the Devil himself and it would still be accurate. Ad hom attacks do not impress me. And they should not impress you either.
    0 0
  25. NewYorkJ, that would be her honesty. The editor is Sonja Boehmer-Christiansen. An extensive search of the litterature (22000 journals) by the folks at the DeSmog revealed 4 research articles by her on environmental policy. In the case of E&E her editing is used in lieu of conventional peer-review. Last I checked, E&E was not listed in Journal Citation Reports: http://thomsonreuters.com/products_services/scientific/Journal_Citation_Reports The issue of land use is not ignored at all by climate science and it is a significant contributor to CO2 production. There is a wealth of litterature on the subject, a few examples and summaries here: http://cdiac.ornl.gov/by_new/bysubjec.html#landuse sghwterttrrtrtt4r34r34trt34t5r34rt34tr34rt435rt43
    0 0
  26. Chris, I will have to brush up on CO2 through the centuries but I have a hard time swallowing a narrow range of CO2 variability. Consider the fact anthropogenic CO2 emissions has increased dramatically over the last two decades, yet the rate of accumulation in the atmosphere is about the same or even less. This shows the carbon cycle can have a hugely different natural uptake of CO2. 2. You write: "These rises {pre-1900 and pre-1950} in atmospheric CO2 are expected to make a significant contribution to the surface temperature changes during these periods." Not true. Also "the enhanced greenhouse warming during the two periods is 0.15 oC and 0.13 oC, respectively." Please! Have you ever heard the term "false precision?" The instruments available during this time cannot measure in hundredths of a degree. And 0.15C is not signficant, it is a hypothesis - an calculation. No one of the many pro-AGWers I have talked to think 9 ppm of CO2 is significant or even measurable.
    0 0
  27. Ron Cram, My critique is of the journal, not the person. Since the journal is not cited and the editor has admitted to following a political agenda, it renders the journal's credibility rather weak and thus the study highly dubious. You don't seem to be addressing the problems with E&E, but instead appear to be dodging on misplaced ad hominen charges. Material in that journal is as good as self-published material. If an E&E study is all you have, there isn't much to discuss. I was hoping for more.
    0 0
  28. "The rate of sea level rise has been increasing since the late 19th century. In an upcoming post, we shall look at predictions of future sea level rise." One very recent report, still in draft, projects a ceiling of 6 meters. The ACCE report states: "Rates of sea level rise at least twenty times the current 3.1 mm/yr sustained over more than a century have been measured for the transition to the current warm period following the termination of the last ice age and during some of the warmer intervals of the last ice age. Until improved predictive capability is achieved, this can be regarded as a reasonable upper bound of Antarctica's potential contribution to global sea level. This maximum rate (62 mm/yr) would lead to a 6-meter sea level rise by 2100, but such rates occurred when there was considerably more ice on the planet." http://www.antarctica.ac.uk/met/SCAR_ssg_ps/ACCE.htm I've seen others cap this at 2 meters, probably given the last line in the statement. Sea level rise has certainly been accelerating, but reaching 62 mm / yr seems very unlikely. Sorry for the double post above.
    0 0
  29. Ron, what are you doing? Read what Chris is writing -- he's saying that a small, significant amount of warming is expected from anthropogenic emissions between 70-160 yrs ago. True. Why are you freaking out? You seem to have stepped back from your original position regarding Argo falsifying AGW (is that assessment correct?) and now seem to be arguing other things less relevant to the thread. You've pointed out a few instances of things that don't impress you. What responses have you found compelling? Perhaps the first part of Chris' #23 re Loehle? I still haven't read that darned Church 2006 paper, but I suspect that the error estimates broaden out in the most recent years (John COOK's Fig 1 above) due to a 'smoothing' function or Bayesian approach in which subsequent estimates inform prior estimates. That, figures and discussion in "Mystery of Vanishing Ocean Heat", and the last part of NASA's story on Josh Willis suggest to me that grasping for the most recent data from a single data type is a bad strategy for increasing one's understanding. PS. What is a "pro-AGWer"? I for one would rather be considered as someone who tried to reduce AGW.
    0 0
  30. NewYorkJ, your attack on the editor of E&E and Loehle's paper is completely ad hom. I'm sorry you do not understand that. In science, "credibility" is not a factor under consideration. The scientific method requires results to be reproduced. If results are reproducible, they are confirmed. If they are not, the paper is rejected. It is that simple.
    0 0
  31. Steve, I did read what Chris has written. I am not freaking out. I pointed out a few of the weaknesses with his argument. I hadn't the time then, or now, to deal with all of them. Your assessment that I have stepped back from my original position regarding Argo requiring a reconsideration of AGW theory is not correct. Loehle points out that there are reasons to question Argo data and I can accept that. But in my mind, the full accumulation of data is contrary to the claim AGW will be catastrophic. Argo is a very strong element of that but it is not alone. The assessment is also based on the climate sensitivity estimates by Schwartz and Chylek, Chylek's work on aerosols, Spencer's identification of a hew negative feedback over the tropics he identified as Lindzen's Infrared Iris Effect, and others. I have not found anything Chris has written as compelling. The only item you offer me is one I cited first and then Chris quoted back to me. It is one thing to be able to look up the numbers and another to be able to understand what they mean. A "pro-AGWer" is shorthand for a climate alarmist- one who strongly supports AGW theory. I would think the context would make that clear.
    0 0
  32. NewYorkJ, you are correct to think most researchers would prefer to publish in journals with a higher Impact Factor. I think I should explain why scientists sometimes choose to publish with E&E. Perhaps you have already heard the charge that skeptical papers are not well received by many journals. In most cases it has to do with the reviewers the editors chooses to review a paper. If you want, I can probably find advocacy quotes from editors of these other journals that would prove their motivation. It is a shame really, because scientists are not supposed to be advocates. I want to give you an example of what researchers are up against. Steve McIntyre, who has published in GRL and other journals, writes about a rejection notice he received from International Journal of Climate. http://www.climateaudit.org/?p=5978#comment-341365 Read Steve's comment and then a few comments following. You will begin to get a flavor of the kind of nonsense that goes on.
    0 0
  33. Ron Cram, ""credibility" is not a factor under consideration" Really? You seemed to understand that a journal's reputability is important, given your comment in #4: "Roger Pielke, the ISI highly cited climatologist I referenced above" What changed? It's not really a choice for contrarians to publish in E&E. They do so because their studies are usually very weak and can't pass a single independent peer review in dozens of reputable journals. Keep in mind that this doesn't imply anything peer-reviewed is correct (not the specific purpose of a peer-review), but something that can't pass ANY valid peer-review is highly suspect. While it's plausible that a biased reviewer exists somewhere in some journal, alleging all of these journals are corrupt is a rather dubious charge that tends to hurt the credibility of the accuser, especially when they end up publishing a study in an uncited demonstrably political journal of like-minded skeptics. Publishing in E&E helps give them the false appearance of a better level of credibility than their study deserves - seemingly better than just posting it on their website. If you're a stickler for ad hominens, Climate Audit is the last place one would want to go. The individual of that site spends more time slinging mud at reputable scientists (the ad hominens you're referring to) than doing actual objective research, and your link is evidence of that. Also, your link does not support your claim of reviewer bias, as is generally the case with McIntyre's ramblings. Good scientists need to be able to acknowledge errors and move on without constantly alleging corruption and conspiracy from those who dare challenge them. McIntyre consistenly fails to meet this criteria. If you say that scientists aren't supposed to be advocates, by this criteria, what contrarian scientists would still exist?
    0 0
  34. Ron Cram, You write "The assessment is also based on the climate sensitivity estimates by Schwartz and Chylek, Chylek's work on aerosols, Spencer's identification of a hew negative feedback over the tropics he identified as Lindzen's Infrared Iris Effect, and others." These assessments haven't held up too well. Comment on Chylek/Lohmann: http://www.clim-past.net/5/143/2009/cp-5-143-2009.html Basically, if you do some severe cherry-picking of data, you can find a lower climate sensitivity (or a much higher one as Annan illustrates). Comment on Scwhartz: http://www.jamstec.go.jp/frcgc/research/d5/jdannan/comment_on_schwartz.pdf As a result, Schwartz revised his estimate up about 50%, although not all the issues Annan et al found have been addressed. http://www.ecd.bnl.gov/steve/abstracts/HeatCapacityResponse.html Lindzen's hypothesis hasn't withstood the test of time, and has gone through various revisions. When one piece of data refutes a claim, it morphs until another piece is falsified. Chris Colose exposes some key problems with Lindzen's latest claims, and there's some clear evidence that Lindzen has a problem admitting error. http://chriscolose.wordpress.com/2009/03/31/lindzen-on-climate-feedback/ As for Spencer, what can I say? The UAH dataset has been revised upward more times than I can count. At one time he used his own flawed data to claim everyone else was wrong. The fact that he's working hard to find a negative feedback shouldn't surprise anyone.
    0 0
  35. re #28 1. CO2 variability. a. Contrary to your assertion Ron, enhanced CO2 emissions during the last couple of decades do seem to be associated with enhanced atmospheric CO2 accumulation. We can inspect the atmospheric CO2 data: http://www.esrl.noaa.gov/gmd/ccgg/trends/ and find that the averaged yearly CO2 accumulation in the atmosphere for the decade 1990-1999 was 1.50 ppm per year and for the (not quite) decade 2000-2008 was 1.98 ppm per year. b. It shouldn’t be hard to “swallow” a relatively narrow range of CO variability since that’s what the evidence and our understanding of the carbon cycle indicates: (i) In a stable climate system with no change in external forcings (no volcanoes or, changes in solar output, greenhouse gases etc), there will still be some year on year variation in the atmospheric CO2. For example, in or shortly after El Nino years the CO2 levels rise due to heat and moisture stress in the tropical rainforest belts; in or after La Nina's tropical forests recover their growth and CO2 levels in the atmosphere drop somewhat. However that will just yield variation around a rather steady level. Atmospheric CO2 levels can't undergo extended continual unforced rises and falls without some sort of phenomenon external to the climate system, because there is a pretty fixed amount of accessible carbon in the short term carbon cycle. So on the decadal, centennial, millenial timescale the atmospheric CO2 levels aren't expected to change that much. In fact it's an indication of the rather steady nature of the accessible carbon in the short term carbon cycle that over tens and hundreds of thousands of years through numerous glacial-interglacial cycles, the atmospheric CO2 levels tend to return to interglacial values within a few ppm of 280 ppm. If one of the carbon pools (oceans/atmosphere/terrestrial) is perturbed, then the carbon will be redistributed. If deforestation and other land use changes reduces the carbon stored in the terrestrial pool and the atmospheric (and ocean) levels will rise. That seems to be the origin of much of the enhanced accumulation of CO2 in the atmosphere through the 19th century [N2O and methane rise follows a similar trajectory – see MacFarling Meure paper cited in post #23; see also the link on land use contributions to enhanced CO2 levels in Philippe Chantreau’s post #25]. Obviously if the climate system isn't stable and external forcings change (variation in solar output/major periods of volcanic activity and so on) then atmospheric CO2 levels will respond somewhat. That seems to be the origin of the small reductions of atmospheric CO2 through the period of the LIA….and so on… 2. You’ve misrepresented my statement:
    ”It's very easy to calculate that within a climate sensitivity right in the centre of the likely range (3 oC of warming per doubling of atmospheric CO2), the enhanced greenhouse warming during the two periods is 0.15 oC and 0.13 oC, respectively.”
    by contracting it to "the enhanced greenhouse warming during the two periods is 0.15 oC and 0.13 oC, respectively." …and then engaged in trashing your own misrepresentation! The point is that all else being equal, a rise in atmospheric CO2 from 286 ppm (1850) – 309 ppm (1940) should produce a surface temperature rise at equilibrium of around 0.3 oC within a climate sensitivity of 3 oC of warming per doubling atmospheric CO2. Since a large amount of science indicates that is the “best estimate” for the climate sensitivity under current conditions, we shouldn’t be surprised to find that the world seems to have warmed significantly during this period, with increasing effects on sea levels, glacial recession and so on. Of course in the real world all else very likely isn’t equal. A small enhanced solar forcing in the first half of the 20th century likely contributed to warming. Very significant volcanic activity in the late 19th/early 20th century, “knocked back” temperature rises temporarily…and so on. But we can hardly assert that temperature rises won’t follow from enhanced greenhouse gas levels, when the most likely scenarios from scientific evidence/analysis indicates that they should! And it’s not about “pro-AGWers” whatever that might mean – it’s about the science and its associated evidence. Small persistent changes in greenhouse gas levels are expected to produce re-equilibration of the climate system towards new temperatures, not because “pro-AGWers” “think” so, but because that’s what the evidence, and our scientific understanding of the greenhouse effect indicates. ..and a 9 ppm change in atmospheric CO2 is certainly measurable!
    0 0
  36. #32 Ron: Hmmm, I thought you were asserting before that Argo disproved the concensus understanding of AGW. Now it seems you are saying that Argo and a bunch of other stuff suggest to you that AGW won't be "catastrophic". That seems like progress to me, but maybe I never knew what you meant. If you define "catastrophic" I'll be more likely to understand your perspective now. John, I thought I remembered a post of yours on effects of the solar cycle on temperature but I couldn't find it. Is it still around somewhere?
    0 0
    Response: Here's the post on solar cycles. Note - it cites a recent paper that finds the solar cycle imposes a 0.18C signal on the temperature record. There are other papers that find around a 0.1C signal. I've since come to think its more likely to be the 0.1C signal as the strong signal Tung finds goes out of phase as you go further into the past.
  37. Daily Telegraph reporting on Dr Morner's book "The greatest Lie ever told" "One of his most shocking discoveries was why the IPCC has been able to show sea levels rising by 2.3mm a year. Until 2003, even its own satellite-based evidence showed no upward trend. But suddenly the graph tilted upwards because the IPCC's favoured experts had drawn on the finding of a single tide-gauge in Hong Kong harbour showing a 2.3mm rise. The entire global sea-level projection was then adjusted upwards by a "corrective factor" of 2.3mm, because, as the IPCC scientists admitted, they "needed to show a trend". When I spoke to Dr Mörner last week, he expressed his continuing dismay at how the IPCC has fed the scare on this crucial issue. When asked to act as an "expert reviewer" on the IPCC's last two reports, he was "astonished to find that not one of their 22 contributing authors on sea levels was a sea level specialist: not one". Yet the results of all this "deliberate ignorance" and reliance on rigged computer models have become the most powerful single driver of the entire warmist hysteria. " http://www.telegraph.co.uk/comment/columnists/christopherbooker/5067351/Rise-of-sea-levels-is-the-greatest-lie-ever-told.html
    0 0
    Response: The most complimentary thing I can say about Morner's statements are they are baffling. Sea level rise is measured by tide level gauges all across the globe completely independently of satellite measurements, as explained in this very post. As for his comment about being the only sea level specialist, I've corresponded with at least one of the authors John Church who has published many papers on sea levels. I can only imagine Morner's opinion of himself is so high, he considers all other scientists amateurs compared to himself.
  38. Raising sea level seems almost a fact, and measurements appear good. But does this have any connection to global warming theory?
    0 0
    Response: By "global warming theory", I assume you mean the notion that humans are causing global warming (also known as anthropogenic global warming or AGW). What does rising sea levels prove? It tells us that the planet is warming. We know this because the two major contributors to rising sea levels are thermal expansion (warming oceans) and melting land ice/glaciers.

    Does rising sea levels prove that mankind is causing global warming? No. The reason we know we're causing global warming is because we're raising CO2 levels and CO2 traps heat which leads to the planet accumulating heat.
  39. Thank you for your comment. Yes, I meant the notion that humans, are causing global warming, and specifically by burning fossil fuels. First disclaimer, I am no expert, but only trying to learn. My problem is: If I look at period 1880-2005, and divide it to two parts: 1880-1950 and 1950-2005. About 90% of fossil fuel burning occurred on later part. Seal level and CO2 in atmosphere increased "roughly" linearly in both parts. Even it seems very likely that we are increasing atmospheric CO2 by burning fossil fuels, it is hard to believe that this is the whole truth. On the other hand atmospheric CO2 remained constant for long time before 1800, and it seems unlikely coincidence that exploding human population would have nothing to do with it. Could cutting down forests for agriculture have anything to do with it? Best regards, Pekka
    0 0
  40. To get the discussion back: http://www.worldclimatereport.com/index.php/2010/02/09/gps-aids-in-sea-level-rise-debate/ Thoughts? I do not want to flood the thread with references. Let's go at it one at a time, if we can.
    0 0
  41. Chemist You're citing the World Climate Report: Chief Editor - Patrick Michaels, as if it's a scholarly source? In the post in question, he seems to take issue with the IPCC's sea level rise rate, quoted in the blog as: the average rate of global mean sea level rise is estimated from tide gauge data to be 1.8±0.5 mm yr–1 He then goes on to praise GPS-corrected sea level data, which concludes: when compared to the GIA-corrected data, the GPS-corrected data are better “both on the global and the regional scale, leading to a reconciled global rate of geocentric sea level rise of 1.61±0.19 mm/yr over the past century in good agreement with the most recent estimates”. -- emphasis added Are you seriously suggesting there is a meaningful difference between these two rates? May I ask what branch of chemistry you practice? What chemicals are involved?
    0 0
  42. Muoncounter: the brief blog post uses scholarly references. Organic and biochemist. Elsewhere I use direct peer review, so in this thread ill do the same. Careful,please on cherry picking, in your summary of the conclusion.
    0 0
  43. "Could cutting down forests for agriculture have anything to do with it? " Depends what you mean. Land use change is another (on balance negative) forcing considered in climate theory but as to the CO2 in atmosphere, the isotopic composition shows the increase in CO2 is from fossil sources not biosphere.
    0 0
    Moderator Response: [DB] As it turns out, pekka's last post here at SkS was also on 15 October 2009. Kudo's for being thorough, Phil. Hopefully pekka's still around to read your response. :)

You need to be logged in to post a comment. Login via the left margin or if you're new, register here.


The Consensus Project Website

THE ESCALATOR

(free to republish)


© Copyright 2024 John Cook
Home | Translations | About Us | Privacy | Contact Us