Climate Science Glossary

Term Lookup

Enter a term in the search box to find its definition.

Settings

Use the controls in the far right panel to increase or decrease the number of terms automatically displayed (or to completely turn that feature off).

Term Lookup

Settings


All IPCC definitions taken from Climate Change 2007: The Physical Science Basis. Working Group I Contribution to the Fourth Assessment Report of the Intergovernmental Panel on Climate Change, Annex I, Glossary, pp. 941-954. Cambridge University Press.

Home Arguments Software Resources Comments The Consensus Project Translations About Support

Twitter Facebook YouTube Mastodon MeWe

RSS Posts RSS Comments Email Subscribe


Climate's changed before
It's the sun
It's not bad
There is no consensus
It's cooling
Models are unreliable
Temp record is unreliable
Animals and plants can adapt
It hasn't warmed since 1998
Antarctica is gaining ice
View All Arguments...


Username
Password
New? Register here
Forgot your password?

Latest Posts

Archives

A new twist on mid-century cooling

Posted on 2 June 2008 by John Cook

A persistent skeptic argument is the global cooling between the 1940's to the 1970's. 30 years of cooling during a period of increasing CO2 levels definitely raises a few questions. One piece of the puzzle has been provided by a new paper A large discontinuity in the mid-twentieth century in observed global-mean surface temperature (Thompson 2008).

They note a dramatic drop in global temperature in 1945. To determine whether this may be due to internal variability, they filter out the ENSO (El Nino Southern Oscillation) and COWL (Cold Oceans Warm Land) signals. COWL refers to northern, high latitude winds that carry heat from land to ocean (or vica versa). The filtering produces a cleaner signal with less noise, further accentuating the discontinuity in 1945.
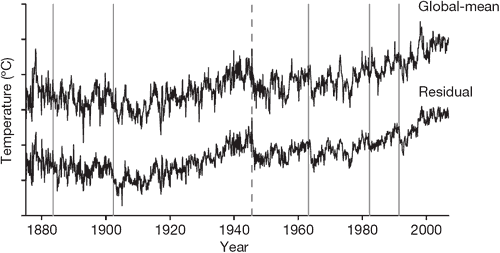

Figure 1: Original unfiltered temperature (top - Global-mean) and filtered temperature with ENSO and COWL removed (bottom - Residual). Solid vertical lines denote volcano eruptions. Dashed vertical line denotes August 1945.

Over the last century, most of the more prominent drops in global temperature coincide with large, tropical volcanic eruptions (the solid lines in Figure 1). However, there are no such eruptions in 1945 (the dashed line). In fact, the drop in 1945 doesn't appear to be related to any known physical phenomenon. Another clue is the fact that the discontinuity is apparent in sea surface temperatures (SST) but not in land temperatures:
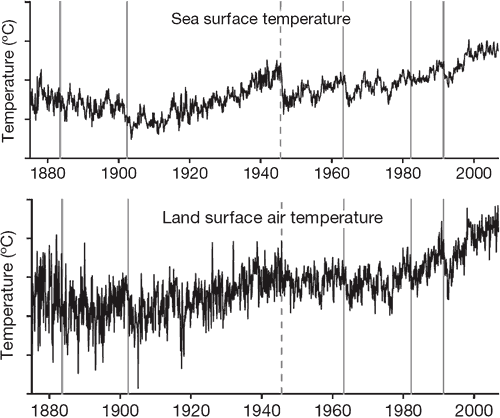

Figure 2: SST versus land temperature (filtered with ENSO and COWL signals removed).

What caused such a dramatic drop in SST in 1945? In the wartime years leading up to 1945, most sea temperatures measurements were taken by US ships, who measured the temperature of the intake water used for cooling the ship's engines. This method tends to yield higher temperatures due to the warm engine-room environment. However, in August 1945, British ships resumed taking SST measurements. British crews collected water in uninsulated buckets. The bucket method has a cooling bias.

What is the significance? The full implications will be apparent when HadCRUT release revised data. A review article by Chris Forest in the same Nature publication suggests that ocean data in the early 1940's show an anomalous 3-4 year interval dominated by US data - which are upwardly biased by engine room intake measurements. When comparing climate hindcasts to observed land and ocean data (Figure 3), the early 1940's is the only period where observed data lie above model predictions. Land data show no such anomaly.
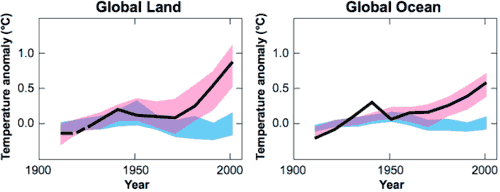

Figure 3: Comparison of observed land and ocean temperatures (solid black line) with climate results using only natural forcings (blue bar) and natural + anthropogenic forcings (red bar). Graph comes from Figure SPM-4 of the IPCC 4AR Summary for Policy Makers.

Forest predicts temperatures between 1942 to 1945 will shift downwards. This would make 1940's temperature data more consistent with climate models and remove the discontinuous cooling in 1945. How much the temperature changes in the years before and after 1945, we'll have to wait and see when HadCRUT release the revised data.

Also, if I may rehash my own work, this early 1940's inconsistency is also seen when comparing radiative forcing to global temperature (which Quietman spotted pretty quickly):
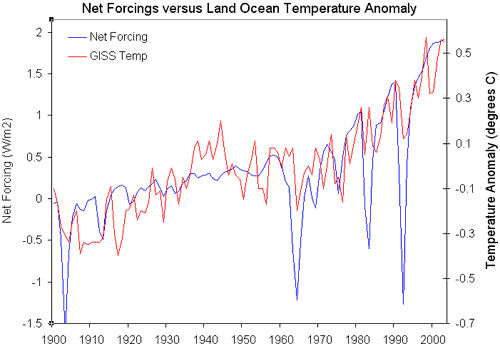

Figure 4: Net forcing (Blue - NASA GISS) versus global land ocean temperature anomaly (Red - GISS Temp).

Finally, Thompson 2008 ends with an intriguing statement:

"compensation for a different potential source of bias in SST data in the past decade— the transition from ship- to buoy-derived SSTs—might increase the century-long trends by raising recent SSTs as much as 0.1 C, as buoy-derived SSTs are biased cool relative to ship measurements"

As if the mid-century cooling anomaly wasn't enough, they have to drop that little bombshell at the end! Will be interesting to see the revised HadCRUT data - both for the 1940's and apparently the past decade.

0 0

Printable Version  |  Link to this page

Comments

Comments 1 to 16:

  1. I'm not sure what to make of all this. On one hand, as somebody else said, this is a triumph of modelling over data -- the data were problematic and rather than endlessly tweaking the models to get a fantastic and fragile fit, the models were left as they were and seem to give more reasonable results in hindsight. On the other hand, requirements to endlessly(?) adjust data give some folks pause regarding the temperature record and thus the main means of assessing the effects of global warming. Where does this leave us -- with glaciers and ATOC (http://www.ncseonline.org/nle/crsreports/marine/mar-2.cfm)? PS. regarding Figure 4 and natural variability, note there was a big El Nino in 1941 - http://tinyurl.com/5mzakp (from realclimate).
    0 0
    Response: I did think about mentioning the Southern Oscillation Index which indicates strong El Nino conditions in 1941 - this may play a part in warm temperatures over that period but not so much over 1943 to 1945. This doesn't explain the 1945 discontinuity at any rate - the ENSO signal was filtered out and only furthered the discontinuity.
  2. What a worrying branch of "science" this is! "compensation for a different potential source of bias in SST data in the past decade— the transition from ship- to buoy-derived SSTs—might increase the century-long trends by raising recent SSTs as much as 0.1 C, as buoy-derived SSTs are biased cool relative to ship measurements" Surely if they had followed a scientific approach, and I assume they did, the transition from ship- to buoy-derived SST's would have been accompanied by strict comparison & control between the 2 methods, to iron out any biases, during the transition period. These after the fact adjustments, nearly always in one direction, are becoming a sad indictmenton on this field, as they appear to be flaying in all directions to cover up the weakening of the hypothesis of detrimental AGW. We saw it in the "hockey stick' saga, in the failure to adjust properly for UHI & other biases in the land surface temperature time series, in the tropical troposphere time series, and now apparently in the SST & OCH. Perhaps the 1940's time STT's are incorrect and should be changed. However why wasn't this done years ago & who wants to vouch there are not far more serious problems in the surface temperature series which exaggerate the warming? The bias's in this field (you even see it expressed, non-overtly, in the language that is used) are obvious.
    0 0
  3. Twist, spin, describe it how you will. soon the climate will be clearly shown to be much warmer than ever before and caused directly by humans. This will become firmly entrenched in policy even as the Ice Sheets readvance. The "record" of the last century and a half was never capable of giving the kind of resolution we pretend it has and now the endless "corrections" have passed completely out of the realm of reality. I particularly like that the corrections make the past colder and the present warmer and that the likelihood of so many "corrections" all going the same direction is now already lower than the odds of winning the lottery.
    0 0
  4. To #2 and #3 -- when data aren't collected for your purpose, you don't have a choice in how they are collected. It's sensible to adjust them to correct for inconsistencies in collection. I agree that post-hoc adjustments are problematic. But don't you see the data having some value if they match large tropical volcanoes and trends in ice? How were those results fudged? In terms of developing a new interpretation of historical records, I think it would be very interesting to let some skeptical group of scientists outline their method for data adjustments beforehand, put it into code, and then see if their output yielded conclusions that differ greatly from what we currently have.
    0 0
  5. I have no problem with that Steve. But, I have a big problem with the now over 70 post hoc "corrections" in this already questionable data set; some are nonsensical. Others appear to be a deliberate attempt to make the data fit a preconcieved notion. There was no sudden dramatic shift in sampling methods in 1945 there were sporadic changes back and forth over various methods over a period of 20 years or so. The entire "average" temperature has so much uncertainty that the uncertainty is larger than the change.
    0 0
  6. What are the three worst "corrections"? I suspect it's all outlined at Climate Audit, but I don't think there's a nice summary there. You say there was no sudden dramatic shift in sampling method, but the shift in source fleets for data seems to contradict your assertion. If different countries' fleets used different methods.... Whoa, the uncertainty is larger than the change? Are you suggesting that the temperature increase from 1900 to now is not certainly greater than zero? Please clarify. Thanks.
    0 0
  7. John Keep in mind that La Nina usually follows El Nino and the time lapse can be very small.
    0 0
  8. Just a query about the other events around 1945: would the effects of 5 years of progressively more massive fires from bombing (culminating in the huge attacks on Berlin, Chemnitz, Dresden, and Tokyo, Kobe, Hiroshima, Nagasaki, etc) have contributed to cooling through particulates in the air? Especially with the jump in all the heavy industries (even German output vastly increased in 1943/44) and little regard was taken anywhere for environmental effects. Production increased hugely - Ford alone outproduced the Italian manufacturing industries - on a worldwide scale, and then continued since. While more and more CO2 was being pumped out, so too was air pollution increasing. Even contrails from massed bomber streams (although aircrew usually tried to prevent contrails from giving their position away). Anyway, is this an effect that must be (or has been)taken into account?
    0 0
    Response: Considering the large temperature drop over sea and negligible drop over land, I'm guessing this effect was not significant.
  9. On the measuring of water temperatures - my own experience has been while localized readings of air temps are easily affected by nearby objects, water temperatures are not. If the readings were taken immediately after entry into or onto the ship the difference in readings is minimal when considering the instruments used at the time. Todays instruments would show a slight difference but in 1945? Not!
    0 0
  10. Quietman (9) -- surely this is something that could be tested empirically, right?
    0 0
  11. Steve L Absolutely. But to determine the difference between the methods used in 1940 through 1945 you need to use the same type and grade of instrumentation. Modern instruments are much more sensitive. When I first started using temp sensors in the 1970s the state of the art sensors were still primitive compared to the ones I used in the 1990s. I can't even imagine what they used for sensors in 1945 other than a good grade mercury thermometer. But to simplify, open a door in winter and the room temp drops immediately but put a new fish into an aquarium and it takes 10 to 20 minutes to equalize the temperature of the water in the bag with the fish to the water in the aquarium. The water density (along with the plastic bag of course) inhibits heat transfer so the key is how immediate the readings were taken.
    0 0
  12. Yep, I'm familiar with the heat capacity of water. Building thermometers similar to what they would have used in the past shouldn't be too hard. (Controlling for differences in calibration would be more difficult, I imagine.) But the test would be to determine whether people read the temperatures from the thermometers to be different given a .3 degree difference in the water temperature. Were temperatures read to the nearest degree? If so, it's still possible that on average people could detect slightly warmer temperatures on average. I used a crappy alcohol thermometer for measuring stream temperatures and I suspect a bias of .3 degrees would be detectable given enough comparative measurements.
    0 0
  13. Steve L Re: "Were temperatures read to the nearest degree?" As I am only 60 I really can't say. People who served in WW2 would have to be at least 80 but most would be in their 90s now. Any old-timers out there?
    0 0
  14. I know two old navy engineers who pooh-pooh this claim. The induction ports were located far way from the machinery. The ships hulls did not conduct much heat fwd b/c of they didn't use the hulls to cool their systems, esp. w/ huge engine mounts.
    0 0
  15. This is a bit "storm in a teacup"-ish. It doesn't really change anything but does help to understand the anomalous "warm then cool" bump in the 1940's which seems to be asociated with sea surface temperatures as John Cook's article describes. Another odd observation that isn't often discussed is the apparent levelling off of atmospheric [CO2] between 1940-1955. This has been described in the original Antarctic Law Dome ice-core high resolution atmospheric [CO2] record, and in the updated version (extended back to 2000 years BP) it's still there [***]. i.e between 1940 and 1955 atmospheric [CO2] rose only by 2 ppm (from 310 ppm to 312 ppm). The authors propose an enhanced ocean uptake during this period. Like BrettC one wonders whether the war had anything to with this! [***]Meure, CM et al. (2006) Law Dome CO2, CH4 and N2O ice core records extended to 2000 years BP Geophys. Res. Lett., 33 L14810. Abstract: New measurements of atmospheric greenhouse gas concentrations in ice from Law Dome, Antarctica reproduce published Law Dome CO2 and CH4 records, extend them back to 2000 years BP, and include N2O. They have very high air age resolution, data density and measurement precision. Firn air measurements span the past 65 years and overlap with the ice core and direct atmospheric observations. Major increases in CO2, CH4 and N2O concentrations during the past 200 years followed a period of relative stability beforehand. Decadal variations during the industrial period include the stabilization of CO2 and slowing of CH4 and N2O growth in the 1940s and 1950s. Variations of up to 10 ppm CO2, 40 ppb CH4 and 10 ppb N2O occurred throughout the preindustrial period. Methane concentrations grew by 100 ppb from AD 0 to 1800, possibly due to early anthropogenic emissions.
    0 0
  16. See here...... http://en.wikipedia.org/wiki/Sea_surface_temperature "The earliest technique for measuring SST was dipping a thermometer into a bucket of water that was manually drawn from the sea surface. The first automated technique for determining SST was accomplished by measuring the temperature of water in the intake port of large ships. This measurement is not always consistent, however, as the depth of the water intake as well as exactly where the temperature is taken can vary from vessel to vessel. Probably the most exact and repeatable measurements come from fixed buoys where the depth of water temperature measurement is approximately 1 meter." Temperature measurements using the 'bucket' approach were "corrected" to account for the delay between taking the sample and the final observed temp. Ho Hum.
    0 0

You need to be logged in to post a comment. Login via the left margin or if you're new, register here.


The Consensus Project Website

THE ESCALATOR

(free to republish)


© Copyright 2024 John Cook
Home | Translations | About Us | Privacy | Contact Us