Climate Science Glossary

Term Lookup

Enter a term in the search box to find its definition.

Settings

Use the controls in the far right panel to increase or decrease the number of terms automatically displayed (or to completely turn that feature off).

Term Lookup

Settings


All IPCC definitions taken from Climate Change 2007: The Physical Science Basis. Working Group I Contribution to the Fourth Assessment Report of the Intergovernmental Panel on Climate Change, Annex I, Glossary, pp. 941-954. Cambridge University Press.

Home Arguments Software Resources Comments The Consensus Project Translations About Support

Twitter Facebook YouTube Mastodon MeWe

RSS Posts RSS Comments Email Subscribe


Climate's changed before
It's the sun
It's not bad
There is no consensus
It's cooling
Models are unreliable
Temp record is unreliable
Animals and plants can adapt
It hasn't warmed since 1998
Antarctica is gaining ice
View All Arguments...


Username
Password
New? Register here
Forgot your password?

Latest Posts

Archives

Amazon drought: A death spiral? (part 2:climate models)

Posted on 1 June 2011 by Rob Painting

This post continues from Part 1 

Amazon 'die-back'

A study published 11 years ago, Cox (2000), attracted a lot of attention when, using a coupled climate/carbon-cycle model, the authors projected the Amazon rainforest would undergo dramatic die-back if business-as-usual CO2 emissions continued to the end of the 21st century.  This 'die-back' in the simulations was from persistent warming and drying of the Amazon. 

Starting their model runs from 1860 through to the year 2100, Cox (2000) found that the land carbon sink in the Amazon began to decline from around 2010 onwards (meaning vegetation was absorbing less CO2 from the atmosphere) and by about 2040 the Amazon begins to 'die-back'. In the experiment, reduced water recycling in plants (lower stomatal conductance) and loss of carbon stores through higher soil respiration are two mechanisms which speed up the loss of the rainforest.

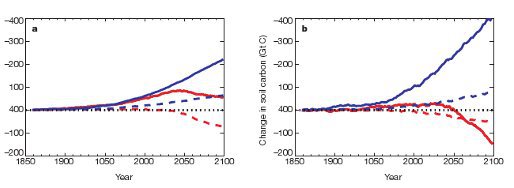
Figure 1: Effect of global warming on changes in land carbon storage. The red lines represent the fully coupled climate/carbon-cycle simulation, and the blue lines are from the 'offline' simulation which neglects direct CO2-induced climate change. The figure shows simulated changes in vegetation carbon (a) and soil carbon (b) for the global land area (continuous lines) and South America alone (dashed lines). Note typo in a) & b) - year 1050 should be 1950

More dire projections 

The spectre of Amazonian 'die-back' has led to a number of other modeling experiments investigating the possibilty of such a scenario. We'll cover a selection of them here, firstly with two other experiments using the same Hadley Centre climate model as Cox (2000)

1. Cox (2004) found that the modelled drying in the Amazon is caused by an El Nino-like warming of the tropical Pacific sea surface. The simulations show a greater warming in the east and central Pacific, than in the western Pacific (see figure 2a). Weakening of the Walker Circulation increases rainfall over the Pacific at the expense of rainfall over the Amazon (figure 2b).

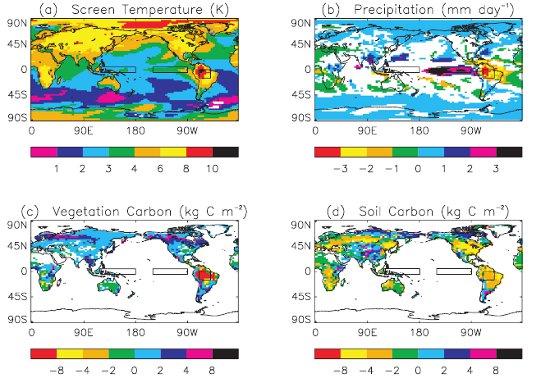
Figure 2: Maps of changes in climate and land carbon storage over the 21st century from the fully coupled climate-carbon cycle projections. (a) Screen temperature, (b) precipitation, (c) vegetation carbon and (d) soil carbon. These maps were calculated as the differences between the means for the 2090s and the 1990s. Only areas for which the projected change is greater than 95% signi?cant (according to a paired student t-test) are shown. In each map the box over South America represents the de?nition of Amazonia for the purposes of this study (70°W–50°W, 15°S–0°N), while the boxes over the Paci?c show the NINO3 region (150°W–90°W, 5°S–5°N), and the western Equatorial Paci?c region (120°E–180°E, 5°S–5°N)

Again, an aggravating factor in the experiment is the plant response. Increased atmospheric CO2 leads to reduced water recycling in trees, and this decrease in evapotranspiration causes surface temperatures to rise considerably. So dramatic is this effect, that by 2100 a portion of the Amazon warms by 10°C.  

2. Cox (2008) examine the conditions leading up to the extreme 2005 Amazon drought, and find a connection between drying of western Amazonia (small black box in figure 3), and changes in the Atlantic sea surface temperature gradient (two large black boxes in figure 3).

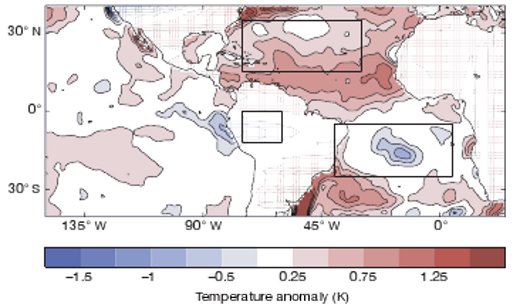
Figure 3: Anomalies in SSTs for July–October 2005, relative to the July–October mean values over the standard climatological period 1961–1990. The black boxes show the regions used in the study

Their modeling experiment reveals that greater warming in the tropical north Atlantic, relative to the south, shifts the Intertropical Convergence Zone (ITCZ) further north, and results in rainfall reductions over the dry season in western Amazonia.   

Another notable finding of Cox (2008) is that reflective aerosol pollution in the northern hemisphere during the 20th century actually served to minimize drying in the western Amazon. By reflecting more sunlight back out to space, aerosols slowed the rate of warming in the tropical Atlantic ocean. The bad news from this finding is that as reflective aerosol pollution falls in the northern hemisphere (due to air quality controls), this will provide an extra boost to warming of the tropical Atlantic, and a further speed up of drying in the western Amazon.

Finally, the authors estimate the probability of the 2005 drought occurring as a 1-in-2 year event by 2025, rising to a 9-in-10 year event by 2060! 

3. Cook (2010) utilize 15 climate models used in the Intergovermental Panel on Climate Change (IPCC) AR4. Based on the median of the model runs, they find a greater annual north/south migration of the ITCZ, which tends to slightly increase wet season rainfall and slightly decrease dry season rainfall, but produce a longer dry season. Again the El-nino-like warming of the eastern and central tropical Pacific evolves.

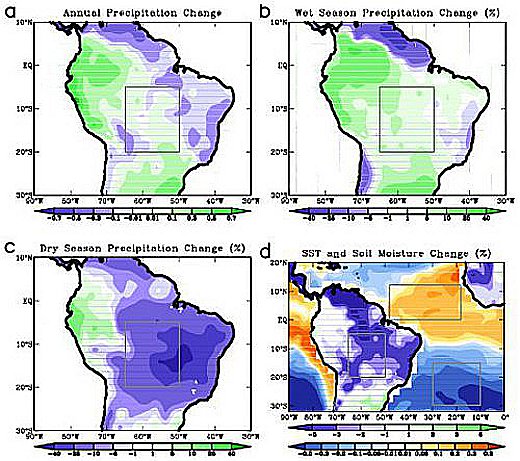
Figure 4:  Future changes in the Amazon and surrounding regions according to the median of 15 IPCC models calculated by taking the difference between the mean of the period of 2070–2099 and that of 1961–1990 for: (a) Annual mean precipitation (mmd−1); (b) Wet season precipitation (%); (c) Dry season precipitation (%); (d) Annual sea surface temperature (?C) with its tropical mean removed and annual mean soil moisture (%).

Unlike Cox, they conclude that the western Amazon is unlikely to undergo die-back. The central, and in particular southern amazon, aren't so fortunate; major die-back is expected there.

4Vergara (2010), using 24 climate models, indicate that the north-western part of the Amazon will see greater rainfall this century, while the southern Amazon dries out. The El Nino-like pattern in the tropical Pacific is observed again, however the tropical Atlantic warming is not simulated in all models. Forest die-back is anticipated in southern and north-eastern Amazonia, with the 21st century likely to produce greater droughts and more intense flooding there.   

Common strands 

Although reaching slightly different conclusions, the modelling experiments exhibit some common features, namely that:

  • changes in Earth's atmospheric circulation, under rising CO2, is the primary cause of the modeled Amazonian die-back.  This arises from two features: the future warming of the tropical Pacific and Atlantic sea surface, and general warming of the global sea surface.

  • these changes reduce rainfall over the Amazon in the dry season, and also lengthen the dry season. 

  • further drying comes from reduced water recycling in trees, as they respond to the elevated levels of CO2. 

All-in-all some eyebrow-raising results, most of which don't even account for the effects of deforestation, but they also need to be balanced with the knowledge that not all climate models project a drop in Amazon rainfall. Furthermore, the boundary conditions of the experiments differ in certain respects, and some key aspects of modern-day Amazonia are not well represented in the models. Finally and importantly, while it hardly needs reminding, we are after all talking about approximations of the real world.

Despite these caveats, it raises the obvious question: how realistic are the gloomy projections? It's here that recent observations, and paleoclimatology, may provide some insight.


Next: 2005 & 2010 extreme Amazon droughts

0 0

Printable Version  |  Link to this page

Comments

Comments 1 to 33:

  1. "changes in Earth's atmospheric circulation, under rising CO2, is the primary cause of the modeled Amazonian die-back."
    Since we cannot accurately predict changes in atmospheric circulation which occur naturally (when will the next El Nino and La Nina occur?), why would one believe we could predict "changes in Earth's atmospheric circulation, under rising CO2"?
    0 0
  2. You are arguing weather vs climate. We can't predict every snowstorm (weather), but it is a good bet that there will be more of them in Winter (climate). Climate trends are comparatively much less chaotic than weather events.
    0 0
  3. CB, ARe you implying that we are in for cooler temps? More snow storms occur during colder winters.
    0 0
    Response:

    [dana1981] IIRC, studies have shown that more snow tends to fall in winters of hotter years, actually.  But this is decidedly off-topic.

  4. No, I was drawing a parallel to show the flaw in ClimateWatcher's logic (i.e. 'we cannot predict weather therefor we cannot predict climate').
    0 0
  5. CW -
    "when will the next El Nino and La Nina occur?"
    El Nino later this year.
    "why would one believe we could predict "changes in Earth's atmospheric circulation, under rising CO2"
    The changes supporting the climate models are already observed. Not ironclad by any means, but consistent with model projections. And if, as predicted,. El Nino occurs later this year then another major Amazonian drought will be likely. Temperatures in the equatorial Atlantic are already well above normal, if that continues then the drought will once again be exceptional. Lots of 'ifs', but should that scenario unfold, the mechanics of why will be loud and clear to readers of this series.
    0 0
  6. Rob, thanks for your post. Another effect of El Nino we're used to here in Brazil is the increased rainfall in the South (including floods) and droughts in the Northeast. I have read a Brazilian review study some time ago that suggested these patterns should be expected more often under GW. Water that was usually recycled westward over the Amazon rainforest would be brought South through the South American Low Jet East of the Andes (SALLJ). Do you have any additional info on this? Since the majority of the Brazilian population is in its southern half, these would be some important regional consequences of AGW.
    0 0
  7. Rob, I'm unaware of an El Nino prediction for later this year. The NOAA CPC doesn't seem to be saying that. What is your source?
    0 0
  8. Apologies for the hackneyed sceptical argument (you've probs covered this before) but this article requires you to have faith in the computer models in the first place. Granted models show some degree of accuracy but the fact that climate scientists can't agree on what causes ice ages concerns me. I have difficulty being convinced with "We don't know what causes massive climate changes in the past but we have configured a computer model that can predict future climate." I just think it may be a case of SISO. Many thanks, Joe
    0 0
    Moderator Response: See Models Are Unreliable. Also, there is in fact good agreement on the major causes of many past climate changes. See Climate's Changed Before and CO2 Is Not the Only Driver of Climate.
  9. Shorter term trends are for a cooling of the key ENSO regions, not warming. This could be the cooling cycle of the PDO, and so its possible that Co2 could be warming the ENSO regions but the influence is small over 30 years compared to PDO. Over 1900-2010 there appears to be a slight cooling of the nino regions as well, or maybe more accurately a lack of warming while everywhere else warms. So I'm pretty skeptical of any link between warming ENSO regions and Amazon drought. In contrast the Atlantic patterns in the 30 year frame are a bit closer to what some of these papers suggest may be causing drought. Over the longer term there doesn't seem to be much of any pattern in the Atlantic, but I'm not sure how good the data quality is going back to the start of the 20th Century. (Source GISS global map generator, in trend mode)
    0 0
  10. joehopkins - perhaps you could enlighten us about which disagreement over cause ice ages you are referring to over in the Climate changed before thread
    0 0
  11. joehopkins ... You're wrong about ice ages but ... 'I have difficulty being convinced with "We don't know what causes massive climate changes in the past but we have configured a computer model that can predict future climate."' It's actually hard to even *determine* past climates in many cases - look at the evolution of paleoclimate reconstructions for the last 2000 years (yes, that long series of "hockey sticks". We haven't had satellites measuring solar output for all of the past several billion years, good thermometer coverage of the earth's surface for the past several billion years, etc. So of course uncertainty going back into deep time is much, much higher than uncertainty today. I'm amazed that the fact that there are some issues pinning down climatic details in the uninstrumented past would lead you to reach the conclusion you do. What's amazing to me is the amount of knowledge about past climates that scientists have been able to glean from indirect evidence, not the fact that they can't do a perfect job.
    0 0
  12. Mike Hauber - Shorter term trends are for a cooling of the key ENSO regions, not warming Not sure what you mean. A vast body of scientific literature expects the tropics to warm, thats what the climate model studies I linked to suggest. This could be the cooling cycle of the PDO Or might not be. Might cover that in part 4. Over 1900-2010 there appears to be a slight cooling of the nino regions as well, or maybe more accurately a lack of warming while everywhere else warms Sorted that too. A recent study addresses the lack of warming of Pacific SST's. It ain't going to last. Over the longer term there doesn't seem to be much of any pattern in the Atlantic, but I'm not sure how good the data quality is going back to the start of the 20th Century. Yup, that too. Tropical Atlantic SST warming is connected to the lack of Pacific warming. I don't want to thrash it out here in the comments. I'll discuss it in chapter 4. So I'm pretty skeptical of any link between warming ENSO regions and Amazon drought Again, not sure what you talking about here. ENSO shifts the Walker Circulation, pretty robust connection with Amazon rainfall throughout the observational record, and in the paleoclimate proxies too.
    0 0
  13. The short term (that is 30 year) cooling trend in ENSO region: I agree there is a robust connection between ENSO and Amazon. I am skeptical of a link between AGW and ENSO in the direction required to cause a drying ENSO.
    0 0
  14. Michael Hauber The trend you plot is not robust, for example the 1974-2009 plot has a warming trend in the Pacific: Having experimented with the plotting software, the results depend strongly on whether the start and end years were El-Nino's or La Nina's or somewhere in the middle. The difference between two years is not a robust estimator of a trend.
    0 0
  15. Sphaerica @ 7 - I'm unaware of an El Nino prediction for later this year NASA, the BOM & The Japan Met are predicting El Nino, others disagree. I'm basing my prediction on this. We'll see how that works out.
    0 0
  16. Alexandre @ 6 - Southern Amazonia will dry out according to most models, because the dry season intensifies and becomes longer. But heavier downpours are expected too. Sorry for the bad news, but they are projections, and might be missing some important details that change the overall picture.
    0 0
  17. Rob #16 Actually, my question was about floods in southern Brazil, not southern Amazon. I think my previous post could be more explicit. Thanks for your response, anyway. Before your article, I did not know about this convergence of models on the drying of the southern Amazon.
    0 0
  18. Alexandre - Actually I do remember a study that specifically references southern Brazil, see if I can track it down.
    0 0
  19. Its interesting watching those models Rob. Last month only one model was predicting El Nino. Now its nearly half. The variance in opinion suggests some really fundamental differences even in the physical models. It looks like a fascinating area to be be working in.
    0 0
  20. I still see a cooling trend for the main nino tongue even when trending from 1974. Considering that 74 was the start of a very strongue multi-year cool event, and the world as a whole has warmed up significantly since 1974, I think the cooling is quite significant, even though it doesn't look like much. The cooling tongue and doesn't really cover the nino 3.4 region, but I bet the areas in the east that it does cover are the ones most important for Amazon rainfall. And by cooling tongue I include all the white area which in absolute terms is neither cooling, or warming, but relative to the rest of the world is cooling.
    0 0
  21. 13, 20, Michael Hauber, Trends are very, very sensitive to end point selection. As it turns out, the late seventies through about 1989 saw an extended period of El Nino activity, so any starting point in that range is going to make it look like a flat or negative trend (i.e. you're starting warm). At the same time, 2010 began with an El Nino and ended with a La Nina, so it matters whether you pick the 2010 calendar year, or something else. For example, try this link to see the trend for 1975 (a mild La Nina) to 2009 Nov-Oct, which would end prior to the 2010 El Nino, and shows a mild but clear warming trend. I'm not saying that's the right trend to pick. I'm saying it's sensitive to end points, and as such maybe looking at sea surface temps isn't the right way to do it at all. Looking at pure ENSO graphs might be better (but you still have to understand what you're really looking at, of course): or this But the trend towards more El Nino's in the last 30 years seems pretty clear (which explains your level or dropping temperature trend... if it's always El Nino, then it's going to look flat or negative).
    0 0
  22. Definitely. From about 1977-2005, El Ninos predominated. It is too early to extend that trend past 2005. Prior to that (back to 1950), La Ninas predominated. Most publications maintain a cyclical nature to the ENSO index, with a period of about 30 years. Much has been written about whether global warming is causing the El Nino increase, or whether the increase in El Ninos has resulted in warmer temperatures. Either way, the connection cannot be denied. Several predictions have been made recently that globally cooler temperatures will prevail this decade due to La Ninas. Stay tuned.
    0 0
  23. Don't get too focussed on ENSO. Paleo data form the tropic has shown that when the planet warms the ITCZ shifts and that of course has marked impacts on the rainfall in the tropics.
    0 0
  24. Actually, I dont think ENSO is that relevant at all. What we do see is that La ninas now are producing warmer temperatures that El ninos of decades ago. Whether one or other predominates, what you can expect is that temperatures for the same index will get steadily higher.
    0 0
  25. I think it is ironic that the so-called CO2 fertilization that some think could make global warming beneficial by helping agriculture be more productive (a simplistic assumption in itself) may actually contribute to drought in the Amazon. And maybe elsewhere?
    0 0
  26. Excellent point @24 scaddenp. Previously this record strength La Nina we have just experienced would have caused negative global SAT anomalies. Instead, 2011 will likely be in the top 10 warmest years, or very close to that.
    0 0
  27. I would disagree with the ENSO arguements. One needs to look at the change in temperature associated with El ninos and La ninas. The last two La ninas produced some rather large temperature drops compared to previous years. The resulting absolute temperatures were higher due to the higher starting temperature at the La Nina onset. Although it is too early to make any warm year claims, 2011 is currently 15th warmest after the first four months, according to CRU data. It is the 2nd coldest since 2000, following the La Nina year of 2008. Long term, the overall effect is neutral. However, short term, la ninas could have a cumulative cooling effect, similar to the cumulative warming of the recent el ninos.
    0 0
  28. Eric- one needs to look at the change in temperature as function of the ENSO index. Have a look at Tamino's analysis where relationship with MEI and volcanos is factored in. In press I believe.
    0 0
  29. Eric @27, Sorry, but you are talking through your hat, and your observations regarding the impact of ENSO on global SATs are incorrect and inconsistent with each other. Ironic that the CRU global SAT dataset (made by those "cheating" scientists) is now the darling of the 'skeptic" crowd-- I wonder why (/sarc)? Might I suggest we move the discussion about the impact of ENSO on global SATs (yea, mea culpa) to a more appropriate thread, as this page is about the Amazon (a regional response).
    0 0
  30. Not sure where you are getting your information Albatross, but the warmest years on record are all El Nino years; 1998, 2005, 2010. The opposite for La Nina. Where are the inconsistencies? I do not know what issue you have with the CRU scientists, but it is the longest running thermometer database. We have probably gotten a little OT, but ENSO does affect Amazon rainfall, so I would be willing to keep it to that.
    0 0
  31. Eric @29, "ENSO does affect Amazon rainfall, so I would be willing to keep it to that." Indeed it does (as do other factors), but yes, please do keep it to that. Feel free to move your misguided notions about the impact of long-term global temperature trends to post on ENSO or internal climate variability.
    0 0
  32. Misguided? Are you going against the common perception (supported by realms of data) that El Nino years are warmed than La Nina years? I am still curious as to why you think the CRU scientists are "cheating."
    0 0
  33. Eric, You agreed @29 to "keep it at that". So please cease with the games and with misrepresenting position on the CRU and the role of ENSO in modulating global SATs. Take that kind of nonsense elsewhere. We are all ears should you happen to have any thoughts on the post/topic at hand: "Amazon drought: A death spiral? (part 2:climate models)"
    0 0

You need to be logged in to post a comment. Login via the left margin or if you're new, register here.


The Consensus Project Website

THE ESCALATOR

(free to republish)


© Copyright 2024 John Cook
Home | Translations | About Us | Privacy | Contact Us