Another animated version of the Warming Indicators Powerpoint
Posted on 18 May 2011 by John Cook
Back in February, Chip Fletcher from the University of Hawaii created an animated powerpoint of the Indicators of Warming, useful for public talks where the various warming indicators appeared one at a time. Shortly afterwards, Martin Hedberg created an updated version of this powerpoint, adding some fancy fade-in effects. Now Shawn Brooks, standing on the shoulders of giants, has taken the Warming Indicators powerpoint one step further - adding more animated effects to illustrate the various signs of warming being observed.
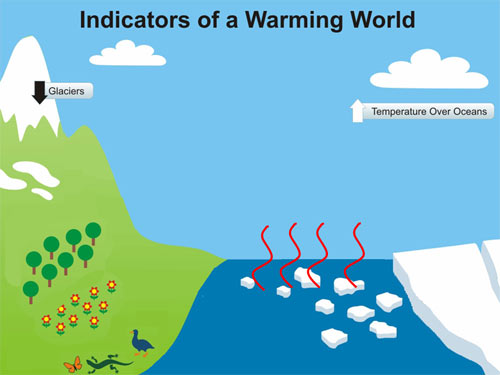
You can download Shawn's powerpoint here. Shawn is a Canadian teacher, creating this for his Year 10 class. Some of his additions include animated heat lines denoting ocean warming:

A flash of warmth to show tropospheric warming:

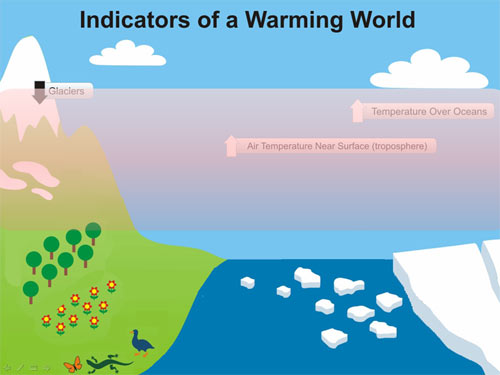
And diminishing sea ice and ice sheets:

As creative people continue to incrementally add to this resource, I find myself looking forward to the next iteration of the animated powerpoint and wondering where this will all end. Warming Indicators: The Motion Picture?

Arguments


[DB] Glacial mass-balance is a function of deposition in the glacier's accumulation zone (where it "packs on weight"), and its losses in the ablation zone (everywhere else). Additionally, slope and terrain play a role as well.
If the glacier is getting substantially more deposition through enhanced snowfall in its accumulation zone, it may begin to advance further downslope (that gravity naughtiness). However, increased meltwater pulses due to a warmer environment downslope may actually cause even greater acceleration and calving at the output end of the glacier due to basal lubrication and subsequent retreat upslope of the glacier.
Measurements of glacier thickness, accumulation and ablation worldwide are reflected in the enclosed graphic. In addition to the graphic I provide, see Jimbo's comment at #2 and glaciologist Mauri Pelto's site here:
[Source]
The reality is that hard-working glaciologists have been all over this for many decades. And this is all very well-documented in the literature. And at Skeptical Science (that Search function thingy).
World Glacier Monitoring Service
[DB] Then go to Mauri's page I linked to. Or better yet, the primary literature in addition to the WGMS site Jimbo gave you.
[DB] You are far, far off-topic here. Many posts exist at SkS (Search thingy will find them). SLR about 7 meters from Greenland & Canadian Archipelago, 7 meters or so from WAIS, another 60-65 meters from the EAIS. Even a partially melted ice cap is a very bad thing for people.
No human civilization we are aware of was around the last time sea levels were at that level.
Please focus on the topic of this thread from this point on.
The experts I consult with have a lot to say about the glaciers melting.
What they are much more cautious about is how to model future melt rates. They point to a lack of good on-the-ground data from the glaciers themselves.
This uncertainty in how to model, does not make one blind to the already observed rate of glacial melt.
Perhaps you are confusing the two.
West Antarctic shelf and Greenland melt as per previous interglacials (with temperatures 2°C above present values, well within possible nthropogenic change levels) ~would be 10 meters or more, flooding ~25% of the US population, primarily on the East and Gulf Coasts.
This is a good answer. KR, what is the global average sea level, in meters please, if you could.
[DB] Google is your friend. You can look this stuff up yourself, you know, rather than asking.
"what is the global average sea level, in meters please, if you could."
I'm scoring that as the oddest question ever asked on SkS.
Jay - The information about sea rise versus ice melt is also a Google answer. Lots data is out there, you just have to look a bit.
I hope the doctor returns to inform us of its relevance.
Anyhoo. It's good to see people not just using the materials here but developing them as teaching and presentation tools. I reckon in another 6-12 months the combination of the visual tools with the phone apps will make a handy package for any community, church or school wanting to DIY a discussion or learning group.
There does seem to be an increased incidence, lately, of "say it loud, say it often" posts early in threads on here, repeating arguments that have already been debunked so many times it's not funny. I presume John & the moderators here have their work cut out for them dealing with this kind of stuff... for example, at a quick glance I didn't see a single comment for this article that was on-topic! (and they can feel free to delete this post, too, as it's thoroughly off-topic!)
Not exactly. Reducing the area covered by glaciers has a number of impacts.
1. Changes to fresh water and hydro-electric schemes.
2. Increased ice loss further in land (Greenland, Antarctica), which reduces albedo, increasing the warming etc.
3. Probably changes in weather patterns, possibly water circulation to.
4. Sea level increases due to land based ice dumping into the seas.
5. Changes in wildlife and migration, impacts on food chain etc.
I'm not convinced, especially after this comment from a Dr. Jay Cadbury, phd over on the DeepClimate thread about Wegman's current difficulties :
Whatever at least this Wegman guy didn’t try to make a fake graph...
[DB] This is off-topic for this thread.
The doctor has dug himself into a hole (average depth = deep).
Yes please. That would be excellent.
Doctor - what would be the usefulness of calculating the sea level rise as a percentage of average sea depth?
"Fully melted Antarctic and Greenland ice caps would raise sea levels by 80 meters, according to the USGS. "
That number seems to be way too high to me so I want to know the global average sea level depth and calculate what percentage average sea level would rise. Somebody also said this number is easy to come by, I've been googling and don't see it. There is also no hard numbers for total number of glaciers, globally.
[DB] KR earlier gave you the link to the USGS site, which itself detailed the sources for the 80 meters quoted. You are welcome to reinvent the wheel all you like, but not on this thread. This is now off-topic and further comments on this will be deleted.
A more relevant question would be the total volume of global land based ice (km^3) / (the total sea surface area (km^2) + whatever new sea surface area would be incorporated by the rising sea level)….I hated calculus.