Climate Science Glossary

Term Lookup

Enter a term in the search box to find its definition.

Settings

Use the controls in the far right panel to increase or decrease the number of terms automatically displayed (or to completely turn that feature off).

Term Lookup

Settings


All IPCC definitions taken from Climate Change 2007: The Physical Science Basis. Working Group I Contribution to the Fourth Assessment Report of the Intergovernmental Panel on Climate Change, Annex I, Glossary, pp. 941-954. Cambridge University Press.

Home Arguments Software Resources Comments The Consensus Project Translations About Support

Twitter Facebook YouTube Mastodon MeWe

RSS Posts RSS Comments Email Subscribe


Climate's changed before
It's the sun
It's not bad
There is no consensus
It's cooling
Models are unreliable
Temp record is unreliable
Animals and plants can adapt
It hasn't warmed since 1998
Antarctica is gaining ice
View All Arguments...


Username
Password
New? Register here
Forgot your password?

Latest Posts

Archives

Are ice sheet losses overestimated?

Posted on 15 November 2010 by robert way

There has been a significant degree of commentary on various blogs and across the scientific community regarding uncertainties in measuring ice sheet changes in Greenland and Antarctica. The majority of this discussion has been ongoing within the field for years but a recent paper (1Wu et al. 2010, Nature Geoscience) has invigorated the debate amongst not only those within the subfield of glaciology, but also among the general public. Several prominent skeptic websites have already featured stories on Wu et al’s (2010) results, using them as ‘supposed’ confirmation that ice sheet losses are significantly less than previous estimates have concluded.

Background
Wu et al (2010) use a new approach for correcting for glacial isostatic adjustment (GIA) when using data from NASA’s Gravity Recovery (GRACE) twin satellite system over the period of 2002 to 2008. GRACE is a pair of satellites which together measure the changes in mass on the earth’s surface. GRACE has been prominently featured in many recent papers 2, 3, 4, 5, 6, 7, 8, 9 detailing extensive ice losses along coastal Greenland with moderate gains occurring at high altitudes in the interior. GRACE data is extremely sensitive to GIA which is essentially deep solid earth glacial isostatic mantle motions (the earth rebounds after heavy ice has been removed from it) making it necessary for estimations of its magnitude to be made in order to determine regional scale mass balance. Wu et al (2010) use a new method for simultaneously solving for GIA and exchanges of mass globally. They use ocean information from altimetry and tide gauges to constrain oceanic mass changes, GPS data for crustal movements in tectonically sensitive regions and GRACE for direct inferences pertaining to total mass movements. Previous studies have corrected for GIA first and then calculated the mass exchanges but this study does this process at the same time using a least squares minimization approach including both GRACE and GPS datasets. This method is viewed by the authors as being a step forward in correcting for GIA but it has been acknowledged that this approach is very new and will require further GPS data to better constrain the GIA signal. So is this the final word on ice sheet mass balance status?

A new paper (10Bamber and Riva 2010) uses sea level fingerprints and mass loss estimates from previous studies to outline the sea level fingerprint of global ice losses. During the review stage of that paper, Bamber and Riva were asked why they did not include Wu et al (2010) estimate for Greenland but instead used 11Van den Broeke et al (2009) (166 Gt/year).

They responded,

“…the values we use are, we believe, the most appropriate to use and are sufficiently reliable to make key points and conclusions that we make… Because a paper is the most recent does not, necessarily, make it the most reliable or “best” estimate. Different approaches have different advantages and disadvantages… The study by Wu et al is an exciting and novel approach to simultaneously solving for GIA and mass exchange (what they call PDMT). We consider this paper to be an interesting proof of concept for the approach but certainly not the “last word” on the topic… The solution has not been tuned for any one location and the quality of the solution will depend on the quality and spatial density of the data sets that went into it… In Greenland, there are very few GPS sites with sufficiently long record (just 3) that could be used and none in the interior of either Antarctica or Greenland. In the future the GPS networks set up within IPY for both ice sheets will greatly help with solving for GIA in these areas.”

The take home message from what Dr. Bamber and Dr. Riva had in their response was that Wu et al (2010) is an interesting paper that provides a new method of correcting for GIA, however the limitations of the GPS datasets in Antarctica and Greenland should make us view this estimate as a first attempt but not THE definitive answer for ice changes. Their response emphasizes that with the high degree of uncertainty in GRACE data and gravimetry as a whole, there will undoubtedly be further revisions of estimates in the future as GIA is better constrained. Their use of Van Den Broeke et al (2009) as an estimate for Greenland is likely because it uses BOTH grace and ice discharge/surface mass balance estimates to make their inferences rather than just one dataset.

To try and further understand the accuracy of Wu et al’s estimate, I contacted coauthor Dr. Erik Ivins from NASA’s Jet Propulsion Laboratory. Dr. Ivins pointed out that the reason Wu et al’s estimate for Greenland was lower than other estimates is that his inverse method for dealing with GIA gave a large counterbalance signature in central Greenland which showed downward mantle motions that lowered his ice loss estimate (Figure 1). Dr. Ivins also noted that the actual existence of this counterbalance signature is still uncertain and that the novelty of the technique is an important consideration when evaluating the results. He also made it clear that this study does not use the more traditional data sources for estimations of ice sheets such as: (1) in situ ice sheet information (2) altimetric elevation changes (3) ice flux (velocity) measurements (4) ice calving/basal melt estimates or (5) inferences of snow accumulation. Dr. Ivins ends the email saying “Considering both the novelty and globality of the methods used by Wu… I’d be hard pressed to say that his result supports the so-called prominent skeptics.”


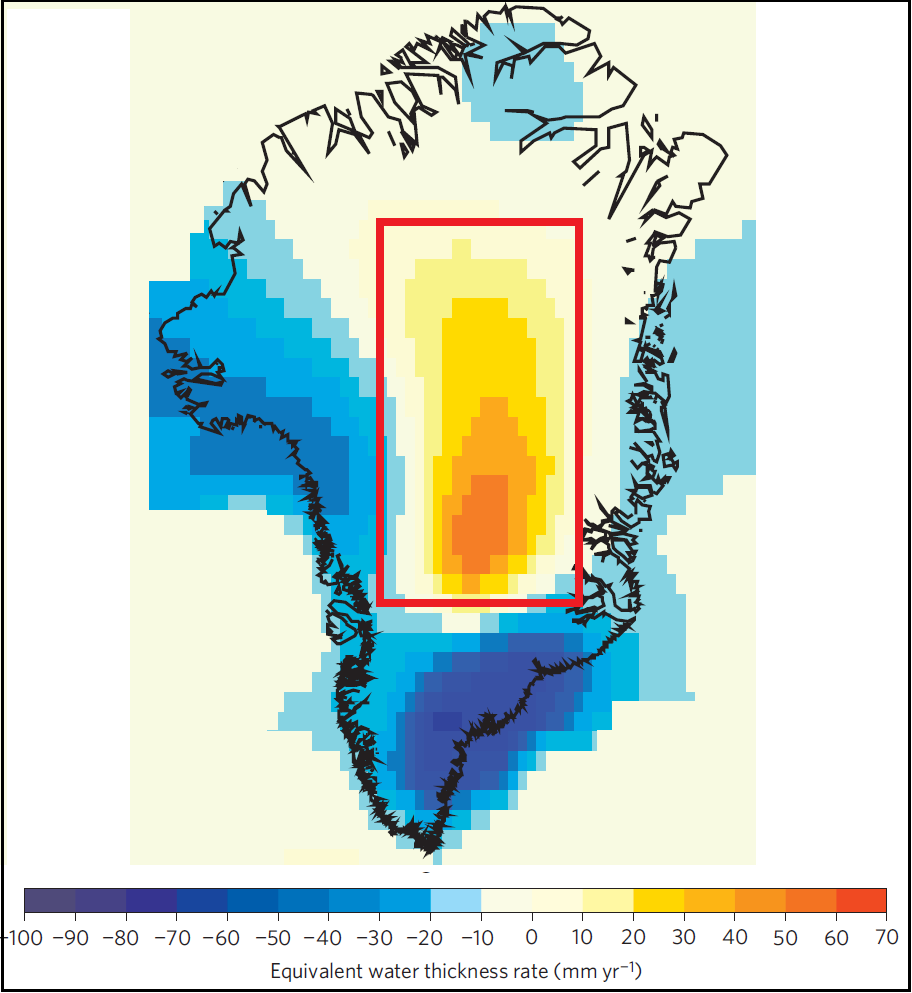
Figure 1: Ice mass changes in Greenland according to Wu et al. 2010, the counterbalance signature is denoted by the red square.

Another even newer study has also been published since Wu et al (2010) which also make ice loss estimates for Greenland. This study (12Sorensen et al. 2010) uses Icesat laser altimeter data from 2003 to 2008 to estimate the mass balance of the Greenland ice sheet to be significantly negative losing 237 ± 25 GT yr-1 over that period. This estimate is over double the estimate of Wu et al (2010) (104 ± 23 GT yr-1) and is also very interesting as they also use a novel approach and test 4 different methods of estimating the mass balance of Greenland from Icesat data. Their estimate of 237 GT yr-1 is using what they felt to be the most accurate method but even the approach that showed the least amount of ice loss (147 Gt yr-1) still showed ice losses significantly greater than Wu et al (2010). The analysis like any other analysis' has its issues but that is why it is important to try and reaffirm these trends using multiple measurement techniques (Figure 4).

This question of the “large counterbalance signature in central Greenland” is one which I find puzzling (see Figure 1) as it is not evident in Sorensen et al’s (2010) paper (Figure 2).


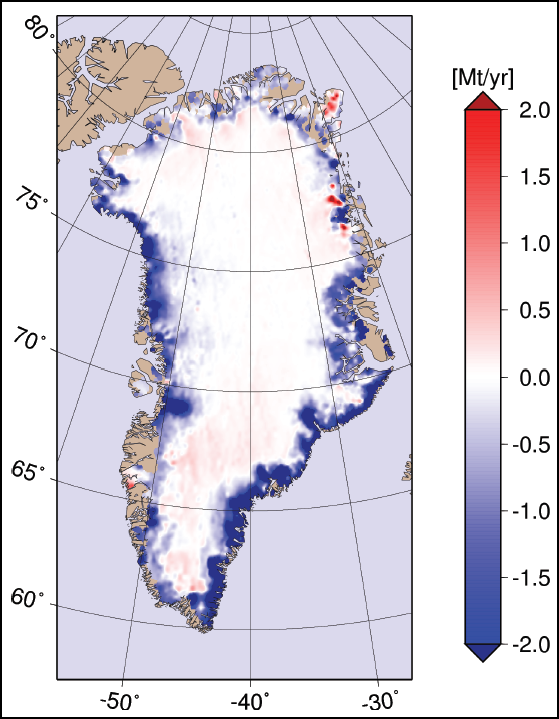
Figure 2: Elevation changes across the Greenland ice sheet based upon Icesat laser altimetry elevation differencing from Sorensen et al. 2010.

Laser altimetry is also sensitive to GIA (though less than Gravimetry) so it is indeed possible that Sorensen et al (2010) perhaps missed this large signature while correcting for GIA, but how can we be sure? One way is to look at data that does not require extensive GIA correction such as Van Den Broeke’s (2009) ice discharge (D) and surface mass balance (SMB) estimates (Figure 3). This analysis compares the incoming precipitation to the outgoing runoff and uses ice velocity measurements across 90% of Greenland to determine if changes in discharge have occurred.


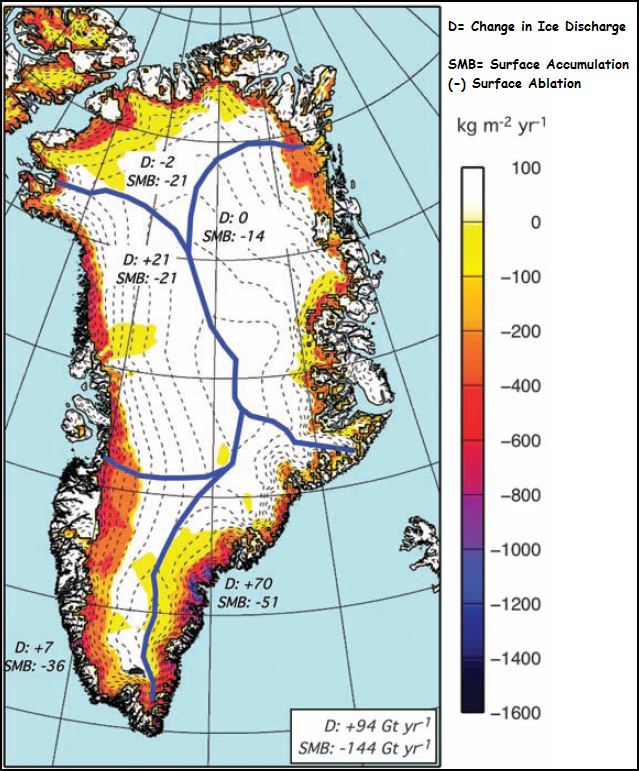
Figure 3: Basin level surface mass balance (SMB) and discharge (D) estimates for the Greenland ice sheet based upon Van Den Broeke et al. 2009 over the period of 2003-2008.

The picture we get from Van Den Broeke’s analysis is that we do not see the dominant accumulation of ice in the center of Greenland that is seen in Wu et al. This is not to say that it is an impossible that this counterbalance signal exists, but it does invoke questions of whether the signal is as strong as in the Wu et al (2010) analysis if other studies’ do not find the same signal using direct measurements of the region rather than a global mass solution.

Wu et al (in context)
It is important to note that the final word in glaciology should be dependent on agreement among different methods as is the crux of any scientific endeavour (Figure 4). Wu et al (2010) does not agree as well with many of the recent mass balance estimates using Interferometric Synthetic Aperture Radar (InSAR), Surface Mass Balance (SMB), Laser Altimetry (Icesat) and Gravimetry (GRACE) results5, 7, 11, 12, 13 but does seem to agree better with estimates using radar altimetry (according to the authors)14, 15, 16. The agreement with radar altimetry data does, however, bring forward questions as it has been shown that previous radar altimetry surveys have significantly underestimated losses in Greenland due to their coarse resolution17.


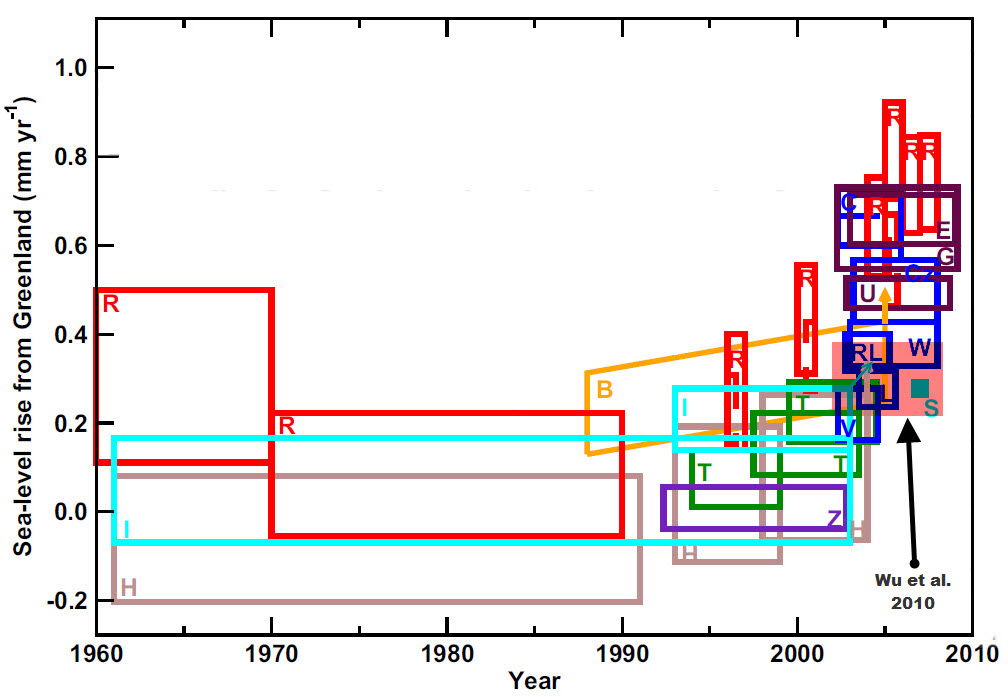
Figure 4: Sea-level rise contributions from Greenland estimated by: Cazenave et al. 2009 (CZ; dark blue), Lemke et al. 2007 (I for IPCC; light blue), Rignot et al. 2008 (R; red), Shepherd and Wingham 2007 (S, light blue), Wouters et al. 2008 (W; dark blue), Box et al. 2006 (B; orange), Hanna et al. 2005 (H; brown), Thomas et al. 2006 (T; dark green), Zwally et al. 2005 (Z; Violet), Rignot and Kanagaratnam 2006 (red dashed), Ramillien et al. 2006 (RL; dark blue), Velicogna and Wahr 2005 (W; dark blue), Luthcke et al. 2006 (L; dark blue), Chen et al. 2006 (C; dark blue), Velicogna 2009 (G, Maroon) and Baur et al. 2009 (U; maroon). Wu et al. 2010 is highlighted in light red. Adapted from Alley et al. 2010.

Forgotten in all this is that Wu et al (2010) still find extensive ice losses for Greenland that are at the absolute upper end of IPCC predictions (Figure 5). Wu et al (2010) also does not cover 2009 or 2010 making their estimates likely lower than we would expect now as Greenland's ice losses have been accelerating since 2006 5, 8. Wu et al (2010) represent another single estimate which can be added to the plethora of other studies (Figure 4) which show extensive ice losses from Greenland that are accelerating. A single estimate cannot be “the best” estimate with the degree of uncertainty which exists among the measurement techniques today, but what we can say is that all methods do agree that Greenland is losing ice extensively, and that these losses are accelerating18.


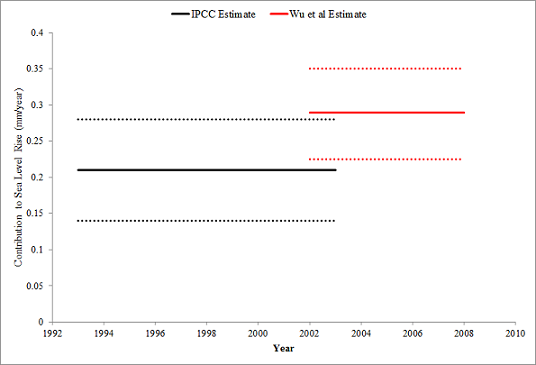
Figure 5: Wu et al (2010) estimate of sea level rise contribution for Greenland compared with IPCC AR4 predictions.

Some more context
According to the Arctic Report Card’s update for 2010  (Richter-Menge, J., and J.E. Overland, Eds., 2010: Arctic Report Card 2010, http://www.arctic.noaa.gov/reportcard ) Greenland experienced the highest recorded melt rate since monitoring began in 1958 with a melt area that was also the highest on record since monitoring begin in 1978. The rate of area loss in marine-terminating glaciers was also calculated to be the greatest on record with 417 km2 of glacier ice being lost. Another interesting caveat to make note of is that some of the same skeptics who trot out this study as evidence of underestimated ice losses, are the same individuals who made claims that its too cold in East Antarctica to lose ice, yet this study finds an ice loss of 23 Gt/year from East Antarctica. Another example of the many skeptic contradictions.


[1] Wu et al. 2010 [2] Chen et al. 2006 [3] Wouters et al. 2008 [4] Van den Broeke 2009 [5] Velicogna 2009 [6] Cazenave et al. 2009 [7] Chen et al. 2009 [8] Khan et al. 2010 [9] Sorensen and Forsberg 2010 [10] Bamber and Riva 2010 [11] Van den Broeke et al. 2009 [12] Sorensen et al. 2010 [13] Rignot et al. 2008 [14] Zwally et al. 2005 [15] Thomas et al. 2006 [16] Wingham et al. 2006 [17] Thomas et al. 2008 [18] Allison et al 2009

0 0

Printable Version  |  Link to this page

Comments

Comments 1 to 47:

  1. Robert - Typo in para 5? as a first attempt but [not?] THE definitive
    0 0
  2. Good Catch.
    0 0
  3. Thanks for the hard work, Robert! Will take me a while to digest and internalize. The Yooper
    0 0
  4. Thanks for a well explained post Robert. Solving these sorts of "mysteries" is part of the reason us science geeks enjoy science.
    0 0
  5. This is an excellent article. Not being a glacialogist, it really makes it much clearer to me what is behind all these estimates and explains well the bases of differences. Thanks! It also makes it clear how hard it is to do science in the current atmosphere of hypervigilism (and hyperhypism) we are in. As described in this article, the Wu paper becomes a call for better GPS coverage in central Greenland, which is a good thing if you want to lay out priorities in future efforts. However, the way it has been spun in some blogs (and by some on this site) you'd think it was the nail in the coffin of scientific credibility regarding climate change rather than part of a real debate about how best to quantify what is universally acknowledged to be a decline in ice mass on Greenland. It must be difficult knowing that something you will publish for perfectly good objective scientific reasons might get picked up by the vortex of public debate, stripped of all scientific context and flung back at you with amazing force and some new originally untended political bias. How can we protect scientific debate from this kind of distortion?
    0 0
  6. Great post, Robert. This is a really handy summary of where things stand right now.
    0 0
  7. Stephen@5. I doubt we can 'protect' science, scientists or their individual publications from misuse or attack. I'm afraid it's really for us and the scientific community to support wherever possible. When we're stuck walking in the rain, we share the umbrellas, we keep trudging on and we make maximum use of every little bit of dry shelter with gratitude. And we keep each other's spirits up.
    0 0
  8. One thing is clear from this excellent summary. Ice loss in polar regions is occurring and getting faster. No surprise to anyone. It also focuses attention to the fact that we need (and presumably will get) more information, particularly on the extent to which ice loss is now and will in the future contribute to the most dangerous aspect of global warming – rising sea levels.
    0 0
  9. Will Cryosat be able to clarify this situation?
    0 0
  10. Re: oamoe (9) Yes. Cryosat-2's primary mission:
    "ESA’s Earth Explorer CryoSat mission, launched on 8 April 2010, is dedicated to precise monitoring of the changes in the thickness of marine ice floating in the polar oceans and variations in the thickness of the vast ice sheets that overlie Greenland and Antarctica."
    The calibration phase should be complete and full-service data collection begun. The Yooper
    0 0
  11. Cryosat-2 *should* be able to help very much although it will still have its downfalls like the other methods. Ultimately what you will see is that Cryosat-2 data will be probably the most important dataset in the future for ice sheet change detection. That being said, I could never see radar interferometry not being useful as it is the only method that can actually detect and measure when flow increases from outlet glaciers. The problem with radar interferometry though is that you can measure the outputs, but knowing the thickness of glaciers and how much snow comes in, is more difficult. All in all, cryosat-2 is going to be a great tool but there will probably be hiccups initially.
    0 0
  12. I'm having a problem at the conceptual level with all this; maybe someone can help. Let's say you assume no isostatic rebound and you measure a certain loss of ice mass, I, using GRACE. Under this assumption, Total loss = I. If the mantle is rebounding, some of the ice mass lost is being replaced by mantle mass; let's call the mantle mass M. Under this assumption, T = I - M. That is, the total measured mass loss is whatever is lost in ice, minus whatever has been replaced by rock. If the mantle mass rebounded perfectly with the ice mass lost, there would be zero measured mass lost. Changing the formula around trivially, you can say, I = T+M. The data regarding mass loss from GRACE (T) hasn't changed; so, I don't yet understand how introducing a rebound effect can reduce the estimate of how much ice has been lost.
    0 0
  13. Oh, maybe it is the case that previous studies have larger estimates for isostatic rebound than Wu, et al, 2010.
    0 0
  14. Agnostic (#8), IDK, but IMHO... Rising sea levels will result in property loss and in some areas mass migrations, and this will take place over many decades to centuries. In contrast, shifts in temperature and rainfall patterns, and ocean acidification will affect, and almost certainly in a negative way, where, and how much, food can be grown. The latter changes are taking place now and can change in just a few decades, or even less if a tipping point is reached; personally, I see the latter as a larger threat. I should probably defer any follow-up to the topic of climate change costs.
    0 0
  15. Re: Chris G (12) GRACE measures its altitude above the surface to then deduce mass lost or gained. Isostatic rebound can introduce error into the calculations, so proper adjustments for rebounding of the basement rocks as the ice overburden is removed must be made. There is no "replacement of mass" by the mantle in the mass-portion of the calculations per se...but the rebound adjustment must be done properly for the correct altimetry data to be obtained that can THEN be used in the mass lost/gained calculations. Hope that's more clear. The Yooper
    0 0
  16. Ok, lets flip this around a little bit. What should the ice loss be? Was the ice loss greater in the late 1940's? What would the ice loss be if there had never been an increase in CO2 emissions? The paleoclimate data does not show long periods of stability, even in the Holocene period and the Holocene is unusual in the duration of the stability. There is still plenty of evidence that the sea levels were 2-3 m higher in the past few thousand years. (Rohling) It is probable that there were many periods in the past few thousand years that Greenland was losing mass at a greater rate than it is now. Even if the MWP was isolated to Greenland, it would have been losing more ice then. Nothing I have seen indicates multi-century stability in glaciers, sea level or temperature. That mankind now has the ability to monitor the tiny changes does not mean that increased CO2 is causing them. John Kehr The Inconvenient Skeptic
    0 0
  17. Re: "The Inconvenient Skeptic" (16)
    "The paleoclimate data does not show long periods of stability, even in the Holocene period and the Holocene is unusual in the duration of the stability. There is still plenty of evidence that the sea levels were 2-3 m higher in the past few thousand years. (Rohling)"
    Your claim about the Holocene not being stable is countered by this: Your claim that your linked Rohling source shows sea levels 2-3 meters higher in the past few thousand years is countered by your linked source, wherein this statement is found:
    "The first two arrays in the attached spreadsheet concern all the compiled raw data. The latter two arrays concern a simple smoothing (3-pt moving average), to reduce sample-to-sample noise. The 1 sigma interval around this 3-pt moving average smoothing is +/- 6.5 m (see Rohling et al., 2009 Nat. Geosci.)."
    How you deduce 2-3 meter higher sea levels from a dataset with +/- 6.5 m accuracy and at best a 500-year resolution is beyond me. Did you not even look at it?
    "It is probable that there were many periods in the past few thousand years that Greenland was losing mass at a greater rate than it is now. Even if the MWP was isolated to Greenland, it would have been losing more ice then."
    Any source for this claim? Conflations with regional/localized events like the MWP belong on a different thread. Please use the search engine in the UL corner of every SkS page to search for a more appropriate thread. Frankly, little in your comment indicates genuine skepticism or acts as a positive contribution to the discussion on this thread. The Yooper
    0 0
  18. @ Yooper, Where is the source for your data? 0.0 +/- 0.5 °C for the past 10,000 years? Seriously... Vostok, Taylor Dome Not arguing the error of Rohling, but the data shows significant variation, you would have to assume the error ALWAYS went towards no variation to not get a few meters of variation. Also, you avoided my question. What is the mass loss of Greenland supposed to be? I can be specific. What should the mass loss be for Greenland in an interglacial at the current state? Should the mass loss be zero? Should it be increasing or decreasing?
    0 0
  19. TIS - "supposed to be" has with it - "expectation from a particular model". Which model do mean? Real world climate models that consider all forcings would say that Greenland should be losing mass because northern temperatures are rising and sea warming. I assume you mean fantasy models where you explain climate without the need for GHG and ice-ages can be explained by milankovitch forcings and albedo alone? Well milankovitch forcings are declining which suggests Greenland should be gaining ice (and maybe should have over last 6000 years), but of course that change in forcing is insignificant compared to GHG forcings. For a more realistic view, A. Berger and M. F. Loutre, 2009 argue for a very long inter-glacial.
    0 0
  20. Whoops, Berger and Loutre is of course 2002, not 2009.
    0 0
  21. John Kerr, What the mass loss for Greenland "should be" is completely irrelevant. We are not arguing that the Greenland Ice Sheet should be stable or should be in a state of continual mass balance. What you are ignoring is that the current trends from Greenland show a distinct acceleration that is far greater than what was predicted by the IPCC. Estimates of Greenland's ice losses fit an exponential curve better than a simple linear estimate. This suggests a destabilization process is occurring. If you would like to talk about the MWP and Greenland losing ice, it is pretty well understood that sea level was likely higher during the MWP. Grinsted et al. (2010) show that sea level over the past 2000 years reached its maximum around 1150 AD at around 12–21 cm greater than present. This number is much smaller than the predicted range of 0.9 to 2m (Rahmstorf 2010) that is expected by the end of the 21st century. The reason the MWP was able to have a higher sea level compared to today is because it lasted for a long time thereby allowing for the Greenland Ice Sheet to continually contribute to sea level rise. Furthermore, because of the length of the warm period the thermal inertia of the oceans was fully fulfilled. It should be noted that Grinsted et al (2010) find that if there is no further warming (from 2009 onwards) that sea levels will still surface the MWP by up to 20 cm from the MWP maximum (remember, no additional warming).
    0 0
  22. Daniel (#15), Hmm, maybe, but your understanding of GRACE is a little different from mine. I was under the impression that the primary measurement taken by the satellites was the distance between them rather than the altitude above the surface. Differences in the distance between the satellites is primarily caused by the lead of the pair accelerating into an area of more mass and 'decelerating' as it leaves the area, and the same for the other in the pair. As far as I can tell, altimetry has little to do with it. I'm sure a mountain range affects GRACE, but I'm not sure how it would distinguish between a mountain range and a large deposit of iron ore near the surface. It is affected by local variations in mass.
    0 0
  23. John Kerr, Another way to approach this question is that the maximum amplitude in sea level change from the MWP potential maximum (21 cm greater than present) to the LIA potential minimum (26 cm lower) is 47 cm and can be as small as 31 cm over the last 2000 years (Grinsted et al 2010). The expected sea level rise according to Grinsted et al (2010) if there is NO additional warming (this doesn't include 2010s warm year) is between 21 to 44 cm by 2100. So not even including any additional warming we see, we will sea a sea level rise which is as great as the amplitude between the highest of the MWP and the lowest of the LIA by 2100. Kinda supercedes your natural variability theory doesn't it? Lets dive a little deeper. You may not be a glaciologist but i'm sure you have heard about dynamical ice changes which are underway in Greenland and West Antarctica correct? These ice changes are irreversible in West Antarctica (particularly in Pine Island Bay) where the bed slopes downward into the interior of West Antarctica. The losses from this region ARE accelerating, the same as they are from portions of Greenland grounded below sea level. The mechanisms are WELL-UNDERSTOOD and continued oceanic and atmospheric warming will hasten the removal of buttressing ice shelves/grounding lines and thereby accelerate flow into the oceans. But back to your initial premise. It is true that climate throughout the holocene has been to some degree variable. And it is true that the timing of the hypsithermal is different in different regions thereby causing periods of warming in the past. But since the Hypsithermal you DO NOT see spikes in sea level of 2 meters. You see *relative* stability. Oscillating climate patterns superimposed on a downward orbital signal. You can pick a core or two out as much as you want, but unless you are able to give some sort of comparison to current temperatures then its irrelevant. I could take your GISP2 core and do this: http://www.skepticalscience.com/pics/Gisp2Graphedited.png but that doesn't make it right. Showing half the evidence doesn't either... Finally, Nowhere in the article does it talk about AGW. We don't use ice losses to diagnose and attribute AGW. We use empirical evidence from a multitude of places. Just because ice losses are able to detect associations with warmth does NOT mean that we are saying this is how we PROVE it is man-made.
    0 0
  24. Broken link; should be GRACE.
    0 0
  25. Chris G, I guess it is partially my fault with the explanation. Crustal movements are not only upwards. They can be downwards too. So what was modeled was that part of the downwards mass trend in the center of Greenland was due to the crust sinking under the weight of ice... So without the downward mantle motions, you would assume that the reduction in gravitational pull on the grace satellites would be due to ice loss. Wu et al. 2010 hypothesize/model that it is in fact due to a downward crustal motion.
    0 0
  26. Thanks Robert, I'd assumed an upward movement since we are talking about a loss of mass above, at least overall, though not necessarily in the interior of Greenland. On another read, I see that you did say, "downward mantle motions". That's very interesting; have to study that one a while. Hard to imagine why the mantle would be moving downward in the interior. Downward relative to the exterior of the ice sheet, which is loosing more mass, sure, but relative to the surface in general...puzzling.
    0 0
  27. Re: Chris G (22) Apologies are in order. You and Robert Way are correct. In my defense, I had just done a long series on another website on Jason/Topex/Poseideon and ICESAT and still had that in the brain's RAM. Didn't help that I was commenting from the cellphone & had no access to the correct info. Sorry for the confusion. Moral of the story: memory is no replacement for actually looking stuff up. The Yoooper
    0 0
  28. Chris G, It is possible that the crust is still feeling the effects from previous iceloads. There is always a delay in these sort of mechanisms. Maybe 400 years from now it might start to rbound. Who knows...
    0 0
  29. @Robert, I appreciate that you recognize the relevance of the MWP in this particular discussion. I promise to stay strictly on Greenland with regards to the MWP. I will take issue with your statement that: "What the mass loss for Greenland "should be" is completely irrelevant." Let us start on what we should be able to agree upon. The ice loss during the MWP was of a comparable magnitude to what is currently happening. We should also agree that the MWP in Greenland was a natural occurrence. That leaves us with a situation in the recent past that naturally had comparable ice loss to the current day. This leaves open the possibility that the current warming is natural in cause. This is partially why I am curious about the behavior of the ice sheets during the 1940-1950 period. Many NH glaciers experienced significant retreat during this period. That makes understanding the natural sheet loss very relevant. If the sheet loss was as great in 1940, then it is very hard to say that CO2 emissions have caused an "unnatural" rate of loss today. Comparing to the GISP2 would require a comparable smoothing as to what the ice core had. Since most ice cores are heavily smoothed showing a single year is meaningless. A more comparable one would be GRIP which runs until 1989. That is close to the 1990 point you have on the smoothed GISP2. Certainly there is no sudden increase evident in the GRIP data. Since this is much closer to single year data it is a better comparison to the single point compared to the GISP2 you linked. (many will be amused by that from long discussions on my site) The GRIP data shows that the 1930-1940 period were very warm. That is why the sheet loss from that period is relevant. I argue that it could easily have been of comparable magnitude to the current ice loss. If that is the case then CO2 levels have had little impact. I hope that you recognize that I am not just arguing for the sake of arguing. My own analysis of the data indicates that there is reason to believe that the current warming is natural. I would also note that the orbital forcing is cooling summers and warming winters. They do go hand in hand. John Kehr The Inconvenient Skeptic
    0 0
  30. John Kehr, I know that the Gisp2 graph showing of an individual year is completely irrelevant. My exact words were: "You can pick a core or two out as much as you want, but unless you are able to give some sort of comparison to current temperatures then its irrelevant. I could take your GISP2 core and do this: http://www.skepticalscience.com/pics/Gisp2Graphedited.png but that doesn't make it right. Showing half the evidence doesn't either... " The orbital forcing is overall cooling in the Northern Hemisphere as is evident in Kaufmann et al. 2009 and in Ruddimann 2006. I will respond to the rest in a minute
    0 0
  31. John Kehr, WRT: "This leaves open the possibility that the current warming is natural in cause. " I don't think so. What is the cause in modern times other than AGHGs? What would prevent CO2 from behaving, with regard to the wavelength of photons that in absorbs and emits, in the atmosphere differently than it does in physics labs? Just because it's not clear who killed Oetzi, does not mean that we don't have a pretty good idea who killed Ghandi.
    0 0
  32. John Kehr, I would like to know how you substantiate your claim that the current ice loss is comparable to during the MWP. I see no evidence that the rate of change since 2006 is reproducible during the MWP. The following study : http://www.igsoc.org/annals/50/50/a50a028.pdf Finds similar surface mass balance melting during the early 1920s to 1930s as up until 2005, however dynamical ice processes have dominated the ice loss trends since 2006. See Van Den Broeke et al. 2009 or Khan et al. 2010 for example. This year had the largest ice losses for Greenland ever recorded (see my last link for the arctic report card). Prior to 2006 the ice losses were within the realm of the absolute upper end of natural variability but post 2006 and up to 2010 we have seen huge accelerations in glaciers in both Greenland and Antarctica. This does NOT open the possibility that the current warming is natural in cause. The current warming is showing that if the current ice loss continued, we would see sea levels which were globally MUCH higher than during the MWP. If the acceleration occurs as it is going we will see a minimum of 5 times the amount of sea level rise as found during the MWP. That to me does not seem to support your conclusion. Like I said, Grinsted et al. 2010 show that if current temperature (up to 2009) were maintained then SLR would be nearly 2x that of during the MWP by the time the oceans reach equilibrium. Many glaciers in the NH did experience significant retreat during the 1940-1950 period but far less than during the most recent warm period across most regions. A good example is the complete disappearance of ice caps in the high arctic (Anderson et al. 2008) or the significant ice losses in Alaska, Norway, Yukon, Svalbard, and Iceland which are all greater than those experienced during the previous warm period. "If the sheet loss was as great in 1940, then it is very hard to say that CO2 emissions have caused an "unnatural" rate of loss today" This statement is actually very much the opposite and works against you. Considering we know the major mechanisms which caused the early to mid century warming in this region, we can analyze whether the same mechanisms are causing the current warming. We know that the previous warm period involved a lull of volcanic activity, high solar irradiance and a positive AMO. Whereas now we have GREATER ice losses with lower solar, higher volcanic activity and a positive AMO. We would therefore expect that the previous warm period would be at the upper end of natural variability because of the "perfect storm" of natural contributors and yet the ice losses then were lower than now without the same contributors.
    0 0
  33. Robert, Of course I cannot substantiate that the MWP had comparable mass loss. While there are many clever things that can be found from proxies, this is not one of them (so far at least). What I am saying is that based on the known conditions of Greenland at the time of the MWP, compared to the current conditions, it is very likely that the ice loss was as great or greater than it currently is. I will read the papers in detail today and reply later tonight.
    0 0
  34. I keep hearing this theme from TIS that the current warming is not out of the ordinary. Problem there is, I don't believe that is what sciences asks. The question is not, is current warming out of the ordinary, but rather why is it warming? What are the causes? What might this mean for the future? You can't just say, "Eh, it's been this warm before" and just abandon why. I would be as excited as anyone if science turned up an alternative mechanism to CO2 that has driven current warming, and that mechanism showed that we were just in a temporary warming phase and would now be headed into a cooling phase. The whole world could breathe a huge sigh of relief. But that's not what's happening. CO2 clearly explains past climate change as well as current warming. And the continuing trend in the rise in CO2 suggests that we are in for much more warming that could potentially cause a great deal of disruption. There is a well understood mechanism here with CO2. There is no viable alternative theory that explains what we currently see. Saying, "It's natural" does not explain anything. In fact, it is a casual abandonment of scientific explanation. John, if current warming is "natural" and not driven by man made CO2 it is incumbent upon you to explain the natural mechanism behind that warming. You need to show what it is, why it works, how it explains paleo record of climate, all at the same time as showing exactly why the basic physics of CO2 is so widely misunderstood.
    0 0
  35. Related to this topic is Dr Richard Alley's testimony before the subcommittee on Energy and Environment given today (Nov 17).
    0 0
  36. Good testimony.
    0 0
  37. "What I am saying is that based on the known conditions of Greenland at the time of the MWP, compared to the current conditions, it is very likely that the ice loss was as great or greater than it currently is." What are these known conditions that you assume are contributing to ice losses? You know that there is more that matters than just melt right? We have to remove sea-ice, buttressing ice shelves and provide warmer water into the fjords so that the grounding lines of glaciers begin to retreat and cause glacier accelerations when backpressure is reduced... We can't just say "hey Greenland was nearly as warm during the MWP so it means it lost as much ice!"
    0 0
  38. Robert, Sorry for the delay. It has been a busy day. Thanks for those papers. They are interesting. Wake and ARC. Since the concern is for the overall behavior of the ice in Greenland, the first step I took was to look at the overall accumulation in the Wake data. Here is the last 150 Years of the SMB. I am still working on analyzing all the data, but there is an interesting difference between the SMB data in the Wake paper and the Arctic Report Card (ARC). The Wake paper shows less variability over the matched periods of 1958-2005. In addition the ARC paper shows 2,300 GT more accumulation between 1958-2005 than the Wake one. That is very significant. In addition the total period accumulation for the ARC SMB is approx -600 GT at the end of the hydrological 2010. So while the loss rate is significant post 2005, it was preceded by significant accumulation that is not present in the Wake data for the same period. This is the problem with focusing on the short term. The ARC data for the SMB shows near constant change, but over the past 40 years there has been little overall change in the mass of Greenland according to the Arctic Report Card SMB. In addition the standard deviation of the ARC data is ~125 GT/yr. So even the most drastic years barely exceed 2 sigma. That is hardly OOC behavior. The Wake data which ends in 2005 only exceeded 2 sigma low in 1968 and 1998. So where does that leave us. The Earth is going through cycles. I do not believe we have deciphered all of the ocean cycles yet. Much like the Taylor Dome shows some interesting cycling in the past 1,000 years, so do many other proxy reconstructions. There are many reasons why I am not concerned about CO2 and its impact on radiative heat transfer. That is the main reason why I am not concerned, but it does leave me free to look at the data to try to understand the Earth's cycles. Since the Earth is always changing.... I thought it might be a good idea to figure that part out. John Kehr The Inconvenient Skeptic
    0 0
  39. John Kehr, There have been revisions with the surface mass balance data since Wake I believe. Not 100% sure though. Personally I disagree with your interpretation that you do not have to worry about CO2. Some interesting papers to read on the cycles include Viau et al. 2006. I've long been a proponent of millennial scale climate variability contributing to the warming of the early century but the post-1975 warming does have a primarily anthropogenic origin. I think even Pat michaels in his famous speech at the Climate change skeptic conference makes the statement that we are contributing to it. I think you have to be very careful with your interpretation of cycles in this regard. Viau's paper is good for that but I should point out i've conversed with him on this topic and although he does argue for a contribution to the warming from the cycles, he does not deny that the late 20th century warming is likely of anthropogenic origin. I think you should consider that not ALL scientists are as suspect as skeptics like to indicate and even those who may be pretty skeptical are now pretty convinced that late century warming is mostly human caused. I know of a paper being published relatively soon that deals with some of this stuff. There's an interesting methodology employed in it to determine what the maximum natural contribution could be but until it is in press my lips have to stay sealed. All that being said. There is plenty of empirical evidence to suggest the post-1975 warming is anthropogenically caused and much of it can be found on this website. There are also many studies of spectrometry which show that climate models have the radiative forcing of CO2 pretty accurately defined. I think as you investigate this stuff further, you will eventually come to the realization, like most of us who start out skeptical of many claims, that the future climate really will be dependent upon CO2 emissions regardless of what occurred before 1975.
    0 0
  40. John Kehr, I guess I should also make note that SMB is not the same as the SMB+Discharge. You should check out Van Den Broeke 2009 for that data. I would call that estimate the best available paper for Greenland ice losses because of the multiple methods in one.
    0 0
  41. Robert, Take a look at the Radiative Heat Transfer articles on my site. I have been working on putting together simple examples that accurate, but easier to understand. I would appreciate your perspective. Challenging peer review makes papers and articles better. I don't argue that increasing CO2 doesn't alter the forcing somewhat, but the effect of that has not properly described. I want to get the foundation established that everyone agrees upon in easy to understand terminology. I did look at Van Den Broeke, but couldn't get the full Khan article. One day I will clone myself and have enough time. :-D Please don't mod this comment as it is a reply to Robert...
    0 0
  42. Robert Way @32 notes that we now have greater ice loss with lower solar irradiance but higher CO2. We know that CO2 in the atmosphere and ice loss in polar regions are both accelerating. Solar activity can not remain quiescent. Pinker (2005) reports increased activity and if that is on-going, would not that explain the reason for both the increase in ice loss and acceleration in the rate of loss, rather than some undefined “natural” warming?
    0 0
  43. An interesting link: http://www.realclimate.org/index.php/archives/2010/11/sea-level-rise-the-new-york-times-got-the-story/#more-5386
    0 0
  44. Nice work Robert - been waiting for a definitive context in which to consider Wu et.al. Thanks for that. (It never turned up in my email though).
    0 0
  45. The temperature the past week in southern Greenland has been as high as 11C. see arctic temperature chart. Does anyone know of a site that gives anomalies? It will be interesting to see the NSIDC summary of the Arctic when they put it in context.
    0 0
  46. Michael @45, Try here. Also try here.
    0 0
  47. Thanks Albatross, The anomaly chart puts the data in much better perspective. I bookmarked those sites for the future.
    0 0

You need to be logged in to post a comment. Login via the left margin or if you're new, register here.


The Consensus Project Website

THE ESCALATOR

(free to republish)


© Copyright 2024 John Cook
Home | Translations | About Us | Privacy | Contact Us