


 Arguments


A Southern Hemisphere Booster of Super El Niño
Posted on 30 June 2015 by Rob Painting
- El Niño is a weather phenomenon originating in the Pacific Ocean that has global consequences. Not only is it a time of warmer-than-normal global surface temperatures, but the shift in rainfall patterns are so dramatic that global sea level typically experiences a temporary spike as the tropical land basins dry out and shed their water back into the ocean.
- Now that El Niño has been declared this year, and there is some talk amongst the experts about the possibility of an extreme or super El Niño taking shape, the rest of 2015 could see some rather extreme weather unfold. But why might we see a super El Niño? A research paper published last year helps to shed some light.
- Hong et al (2014) looked at global observations and model simulations to find out what sets a super El Niño apart. They discovered that a prerequisite condition was a circulation in the Southern Hemisphere, associated with a persistent high pressure system situated over Southern Australia and a low pressure system in the South Pacific, that fed surface winds back to the equator and therefore boosted anomalous westerly winds along the equator between the critical June to November development stage.
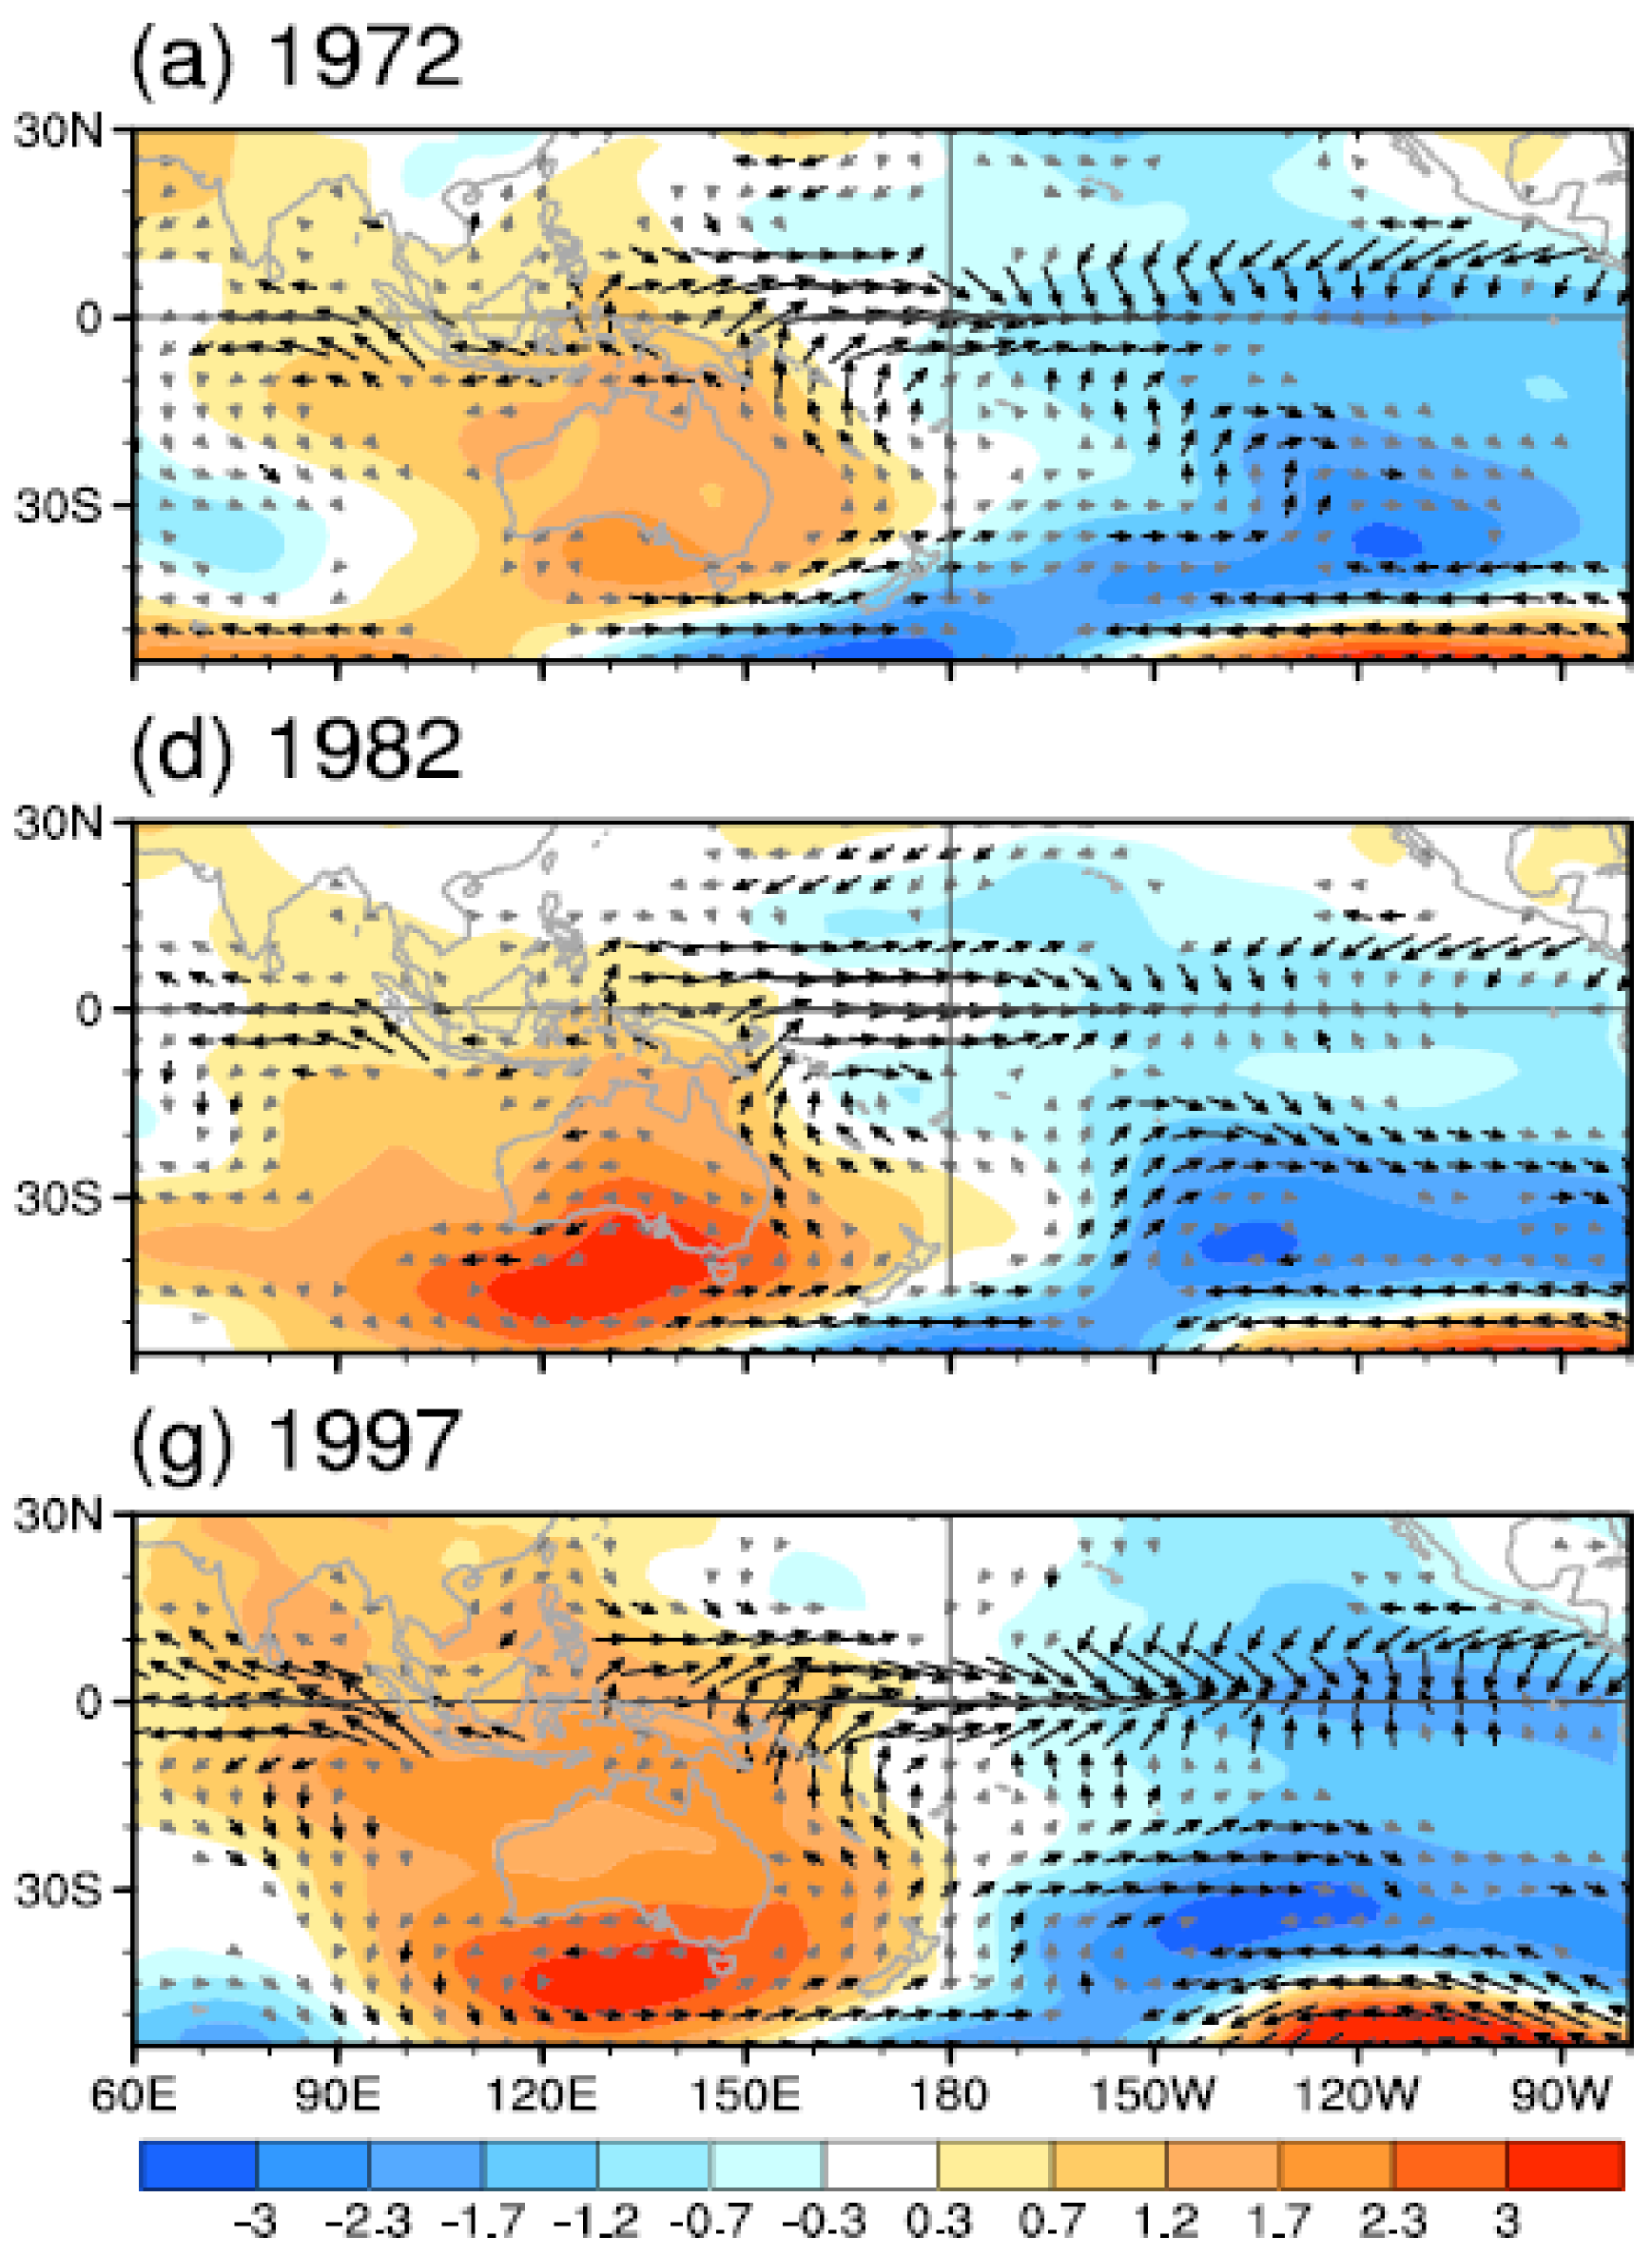
Figure 1 - Anomalous sea level pressure (colours) and surface winds (black arrows) for June-November for the 3 Super El Niño identified in the observational record. The strong equatorward wind flow around the edge of the Australian high pressure system feeds into and augments the anomalous westerly wind flowing along the equator - boosting super El Niño development. These large-scale features are absent from standard El Niño events. Image adapted from Hong et al (2014).
El Niño on my mind
The largest year-to-year variation in global weather results from the El Niño-Southern Oscillation (ENSO). At one extreme we have La Niña, a time when the normal easterly trade winds in the tropics intensify, and at the other extreme we have El Niño, a time when the trade winds weaken or even reverse. These winds are important because their persistence effects change, albeit temporary in this case, in the large-scale circulation of the ocean and atmosphere.
The near-permanent nature of the easterly tropical trade winds are largely a consequence of the strong warming of the ocean at the equator and Earth's rapid rate of rotation. Intense solar heating of the Pacific ocean drives strong evaporative uplift and cooler air near the surface moves into replace the vertically displaced warm air. As it does so, the incoming air is 'steered' toward the west by the Coriolis force (to its right in the Northern Hemisphere, and toward its left in the Southern Hemisphere). This really isn't a force in the strictest sense, but a useful mathematical construct to understand motion in a rotational frame of reference. In reality, due to its rotation, the Earth beneath is moving at a different speed to the loosely gravitationally-bound air above it.
In a thin strip along the equator, the Coriolis force is negligible so, rather than being 'deflected' either left or right, the friction of trade winds on the surface layer of the Pacific Ocean drags water mass along with it. These winds therefore pile up warm tropical water against the land masses in the western Pacific (known as the Maritime Continent). Even with this simplified explanation, we can now see why the intensification (La Niña) and relaxation/reversal (El Niño) of the trade winds has such as remarkable effect. When the winds strengthen, so too does the build up of warm water in the in the subsurface ocean layers of the western Pacific (with some 'leakage' through the Indonesian Archipelago), and when the winds weaken, the pile of warm water smears out across the equatorial Pacific Ocean under the pull of gravity.
Figure 2 - Animation showing the change in sea surface height and ocean temperature in the equatorial Pacific Ocean from 2010-2015. The shallow thermocline on the right-hand side (eastern Pacific) is a result of the warm surface water being displaced to the west by the trade winds, and the upwelling at the equator then being able to reach down below the thermocline to draw cold water toward the surface. Animation from NOAA's Tropical Atmosphere Ocean (TAO) Project.
It's a bird, it's plane, it's Super Niño!
ENSO is measured by sea surface temperature anomalies in a large patch of the Pacific Ocean centered on the equator. Typical El Niño events form about the middle of a calendar year, peak near year's end, and have normally done their dash by April/May the following year. Hong et al (2014) looked at the observational record and classified any El Niño where average sea surface temperature in this patch of ocean (Nino3) exceeded two standard deviations (around 5% of the observations) as a Super El Niño. 3 events qualified as Super El Niño according to this definition; 1972, 1982 and 1997. Interestingly, the authors identified a feature common to Super El Niño but absent during run-of-the-mill El Niño; a high pressure system centered over Southern Australia that fed surface winds back to the equator.
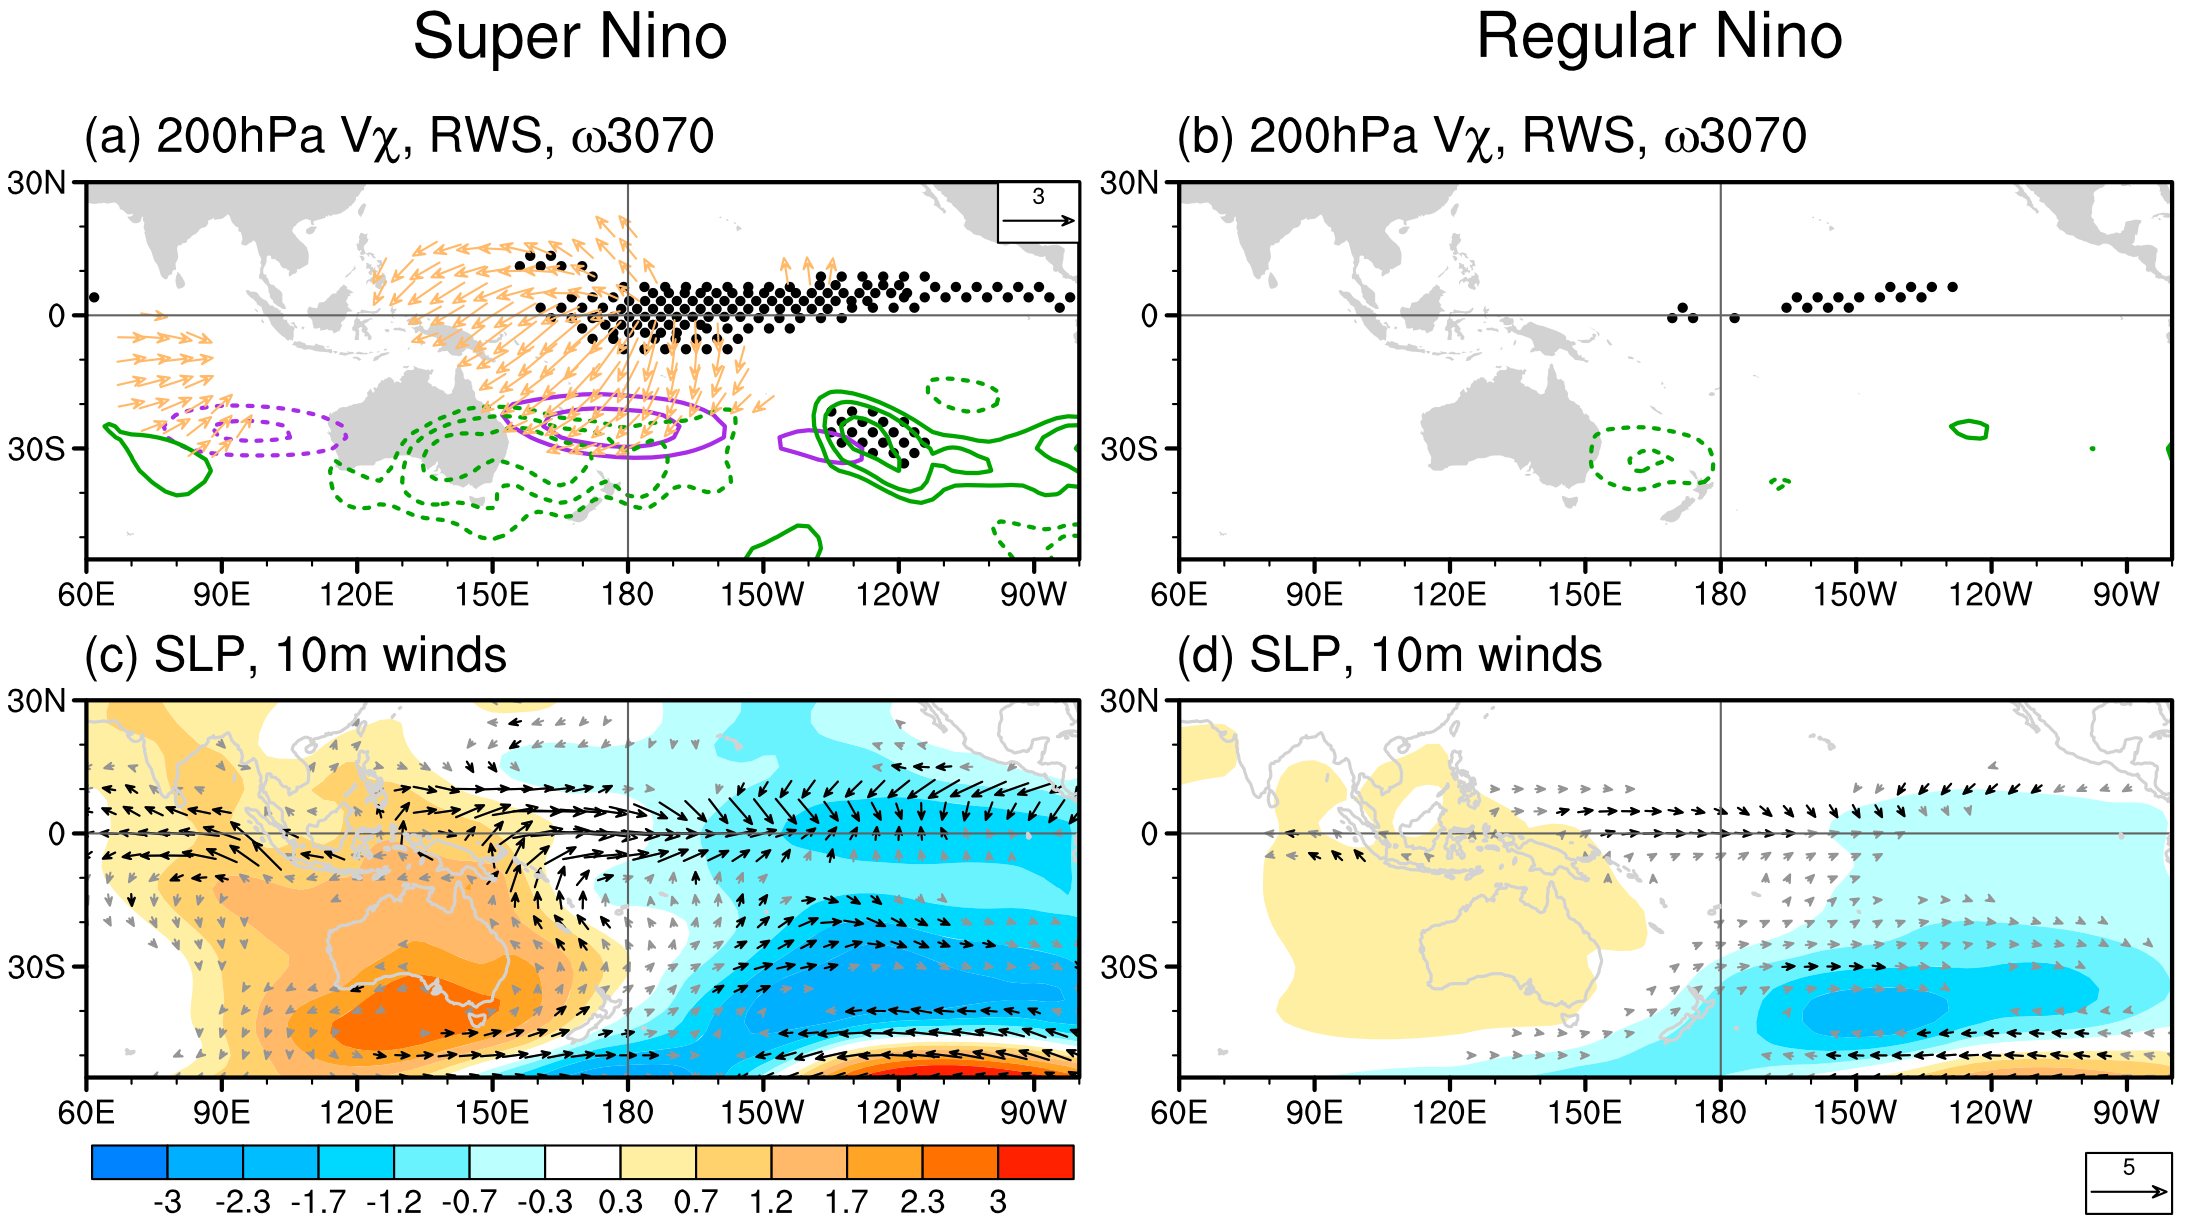
Figure 3 - Comparison of observations between Super El Niño & regular El Niño anomalies for the June-November developing stage. Top panel shows the wind pattern high above the surface (200hPa) and the bottom panels show sea level pressure (colours) and surface winds (black arrows). Adapted from Hong et al (2013).
Perhaps the most obvious distinction between Super Niño and El Niño is that there is exceptional uplift at the equator during Super Niño (black dots in top left panel). Some of this air travels westward and descends near the Maritime Continent, but some also travels southwest and falls back to Earth via the Australian high pressure system.
A useful mental picture here is to imagine looking down on to a bucket of dry sand being slowly poured. As grains of sand fall and hit the top of the sand pile, they slide down this cone. Viewed from above, they move from the centre to the outside. This is what happens in a high pressure system. Air pressure measured at sea level is higher than surrounding areas because air high above the Earth is converging, becoming denser, and falling back to Earth - parcels of air slide down this 'dome' of air. As seen from above, the air parcel moves from the centre of the high pressure system to the outside and, because the Earth is turning beneath and this is the Southern Hemisphere, the air is 'deflected' to its left by the Coriolis force. The result is a wind between the Australian high and South Pacific low which flows anti-clockwise around the edge of the high back toward the equator and then joins the anomalous westerly winds flowing along the equator, thus completing the circulation.
A super El Niño warning signal?
Because the winds flowing along northeastern Australia are directly involved in super El Niño development, Hong et al (2014) derive an index they call the Southern Hemisphere Booster (SHB) index based on the north-south (meridional) wind intensity in this key region. This index serves as a useful predictor for super El Niño development and leads the Niño3 index by around 3 months (see Figure 4).
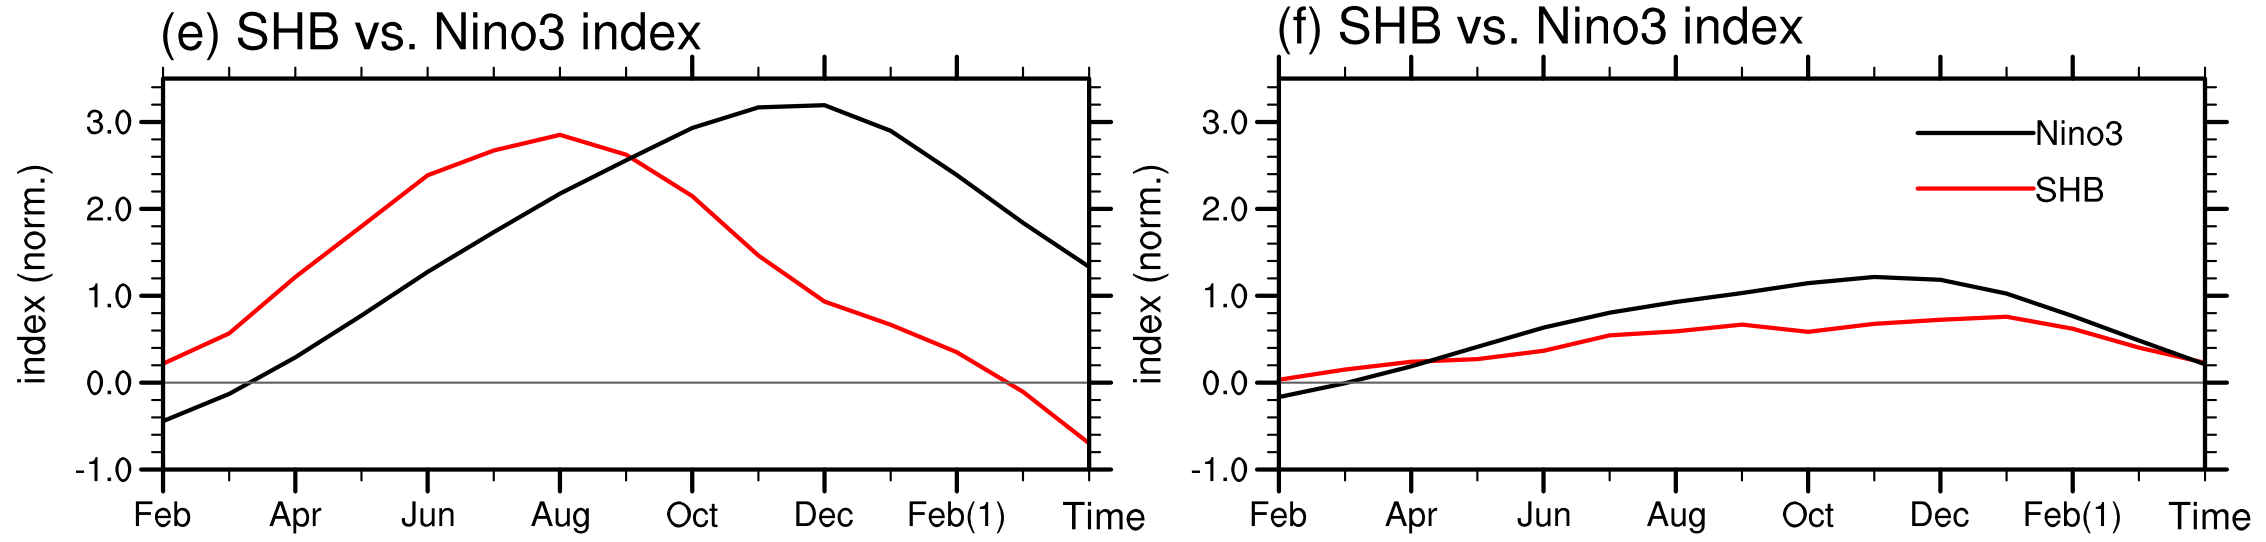
Figure 4 - The Southern Hemisphere Booster (SHB) index vs Nino3 index comparison for Super Niño events (e) and regular El Niño events (f) from observations. The SHB is based on north-south (meridional) wind anomalies at about 1.5 km above the Earth's surface. Adapted from Hong et al (2014).
As the observational record only goes back a handful of decades, and provides only 3 super Niño, the authors turned to climate model simulations to provide data. The NOAA Geophysical Fluid Dynamics Lab (GFDL) climate model they used is one of the better models to faithfully simulate the characteristics of ENSO observed in the real world. In the 500-year long pre-industrial climate model experiment, 12 super Niño and 109 regular El Niño were identified. Despite some discrepancies, such as northeast a shift in the location of the Australian high in the model simulations, the models also indicate that the Australian high/South Pacific low circulation is an essential component of Super Niño development.
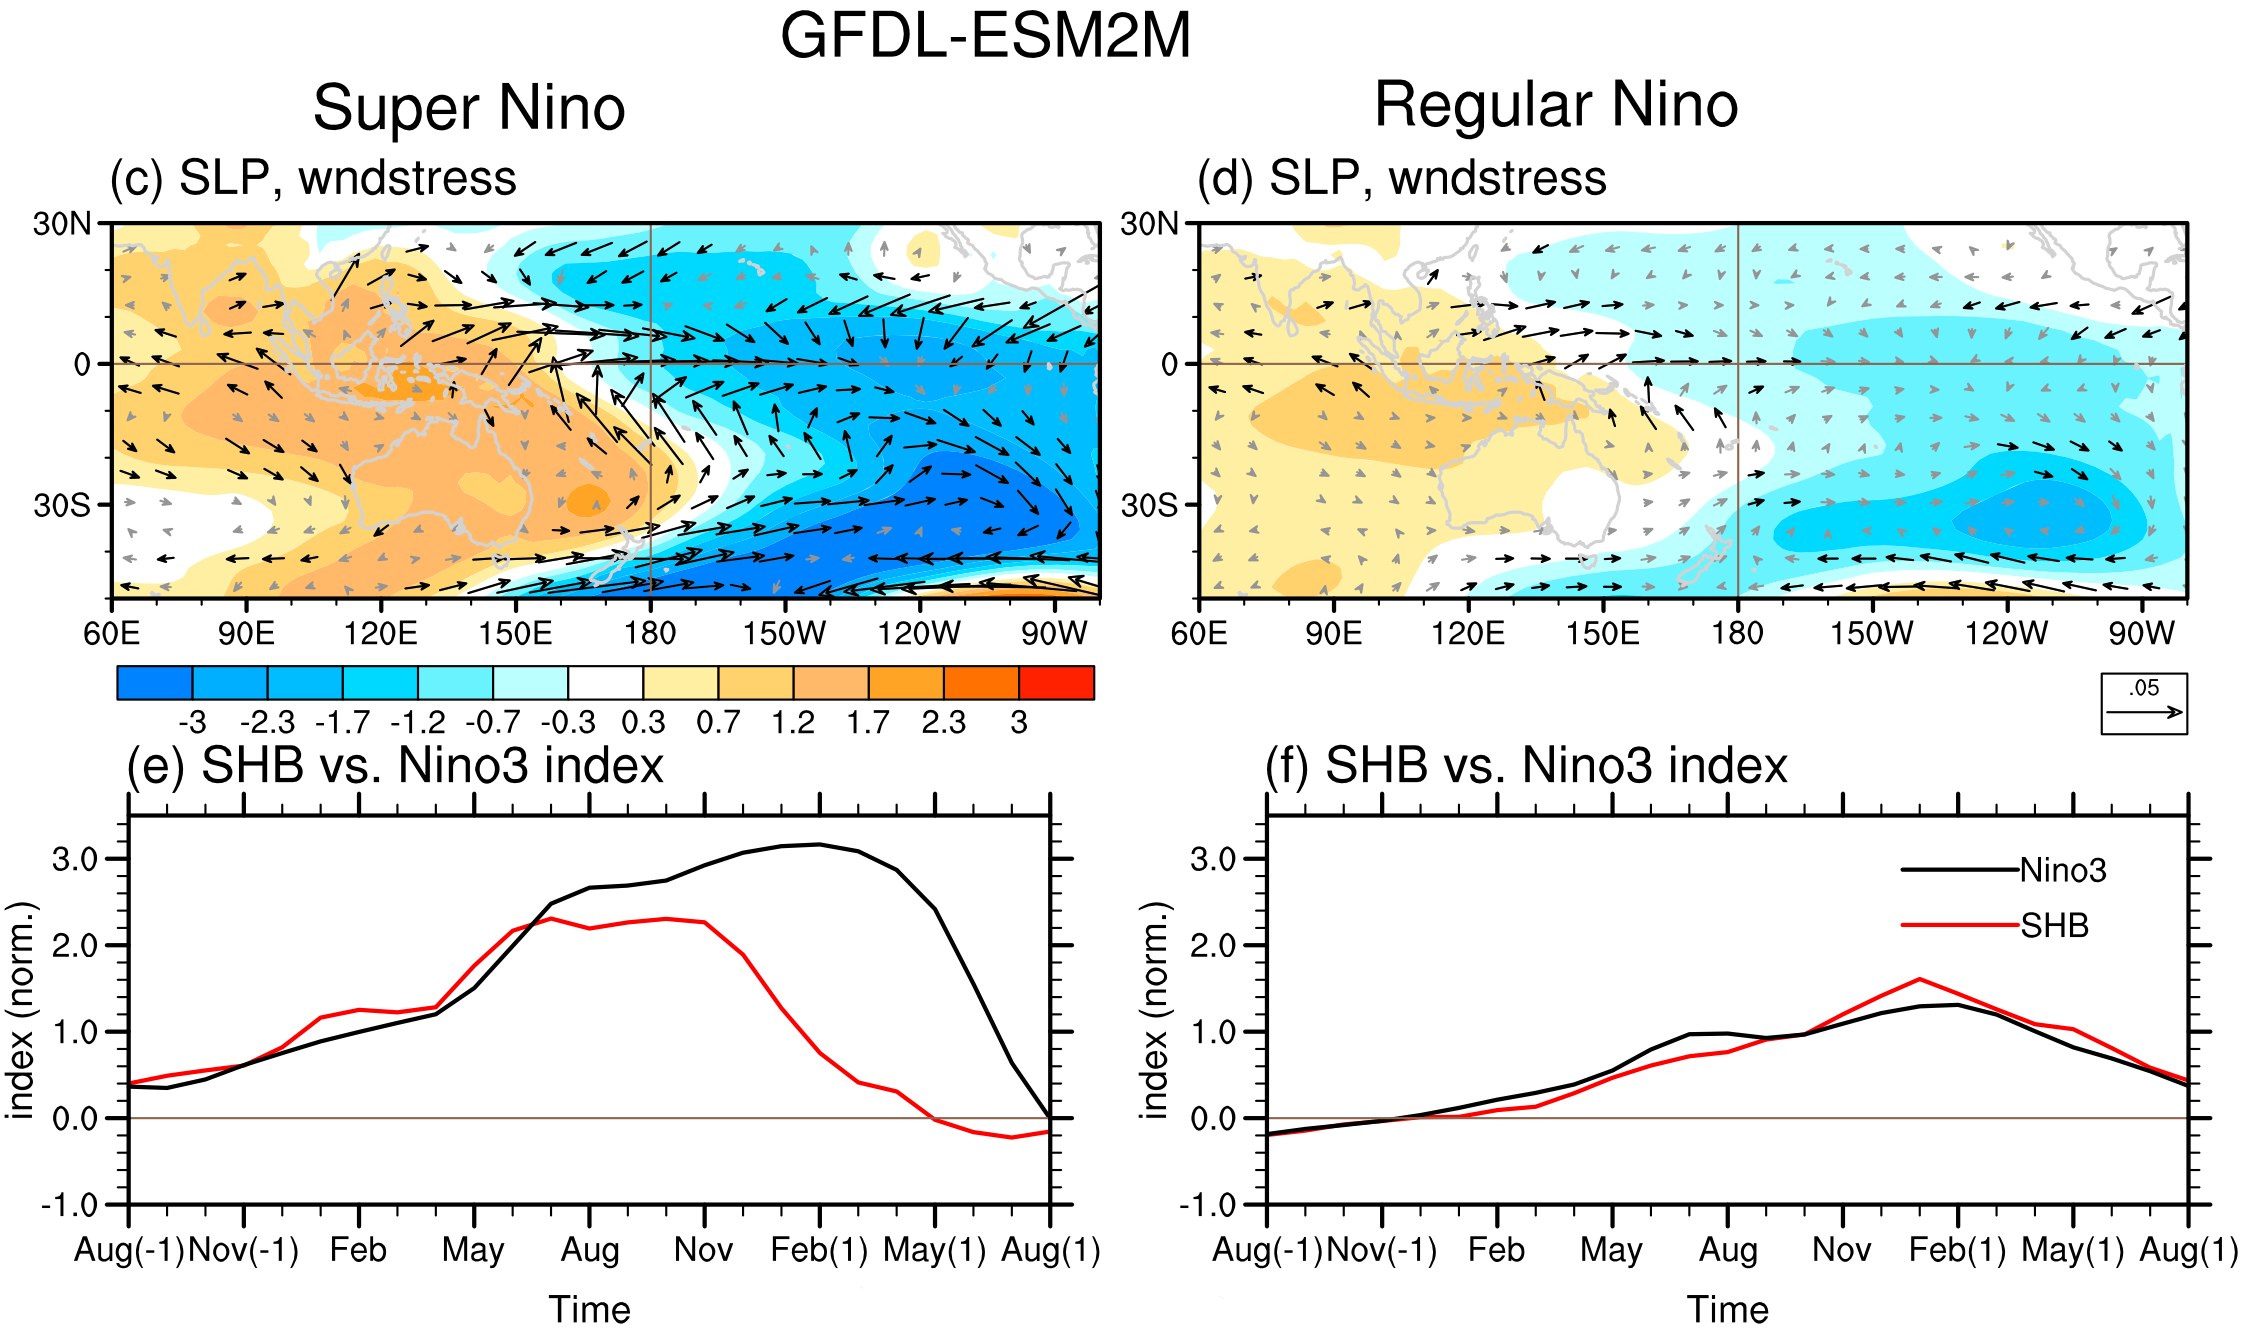 Figure 5 - Climate model (GFDL-ESM2M) output from the 500-year experiment for super Niño and regular El Niño events. Top panels show composite sea level pressure anomalies (warm colour=high pressure, cool colour=low pressure) for the June to November development phase, and the bottom panels show the SHB vs Nino3 index comparison. Image adapted from Hong et al (2014).
Super Niño or bust?
Climate models are predicting an extreme or super El Niño later this year (see Figure 6), but it is by no means guaranteed. We saw this last year when a huge pulse of warm water heading west in the equatorial Pacific triggered talk about an extreme El Niño. It never eventuated, but the half-baked El Niño-like conditions which did still contributed to 2014 becoming the warmest year of global average surface temperature ever recorded.
Hong et al, however, give us a deeper insight into what boosts a standard El Niño into a super one, and they may also provide a window into the future because of the lead time of their Southern Hemisphere Booster (SHB) index. So what do the observations this year suggest? Sorry, no spoilers here, you'll have to wait for things to play out and to read the follow-up post.
Figure 6 - GIF animation of the climate model forecasts for the Nino3.4 region for June/August/October 2015. Adapted from the Australian Bureau of Meteorology.


Keep the ENSO reports coming please--I am fascinated. Having been out at the end of the 82-83 ENSO, I find it interesting about the surface easterlies in the southern hemisphere. We had 20-30 knot 'trade winds' in our face at 20S when we were heading east of Tahiti. We were very puzzled at the time.
Given our position in the flow it may perhaps be notable that New Zealand has had 4 major storm/flooding events in Auckland, Wellington, Dunedin and Whangarei.... in one month. Not normal.
Doesn't prove anything but the weather here is now quite nice, except when we get a weather bomb. Also getting South Island colder than usual. Looking at those wind vectors that would make sense too. Proof of nothing, but suggestive.
Posted today...
Twin tropical cyclones will aid El Niño
The counterclockwise flow around Tropical Depression Chan-hom in combination with the clockwise flow around Tropical Cyclone Twenty-five is generating a Westerly Wind Burst (WWB) near the equator, just west of the Date Line. The winds of this WWB are predicted to march eastwards towards South America during the coming weeks, pushing more warm water eastwards that will reinforce the on-going moderate-strength El Niño event. This El Niño event is already at the borderline of being categorized as "strong", and this new WWB could well push it past that threshold. This should make for an unusually active Eastern Pacific hurricane season, by bringing warmer waters and lower wind shear (next chance for a named storm there: in about ten days' time, when the MJO pushes eastwards into the Eastern Pacific.) Conversely, El Niño should bring a much less active than usual Atlantic hurricane season, thanks to the high levels of wind shear that typically occur there during an El Niño.
Tropical Atlantic Quiet; Pacific Getting Active by Dr Jeff Master, Weather Underground, June 30, 2015
I'll start paying more attention to our nightly weather news item. I recall there's been a high over southern Aus recently and these BOM sites show it was so for the last 7 days and is forecast to continue for the next 4 -
Last 7 days (the plot can be animated) www.bom.gov.au/australia/charts/synoptic_col.shtml
Next 4 days - www.bom.gov.au/australia/charts/4day_col.shtml
It'll be interesting to see in the next weeks/months if this high pattern changes much
I am not computer savvy enough to make charts for comments but I have reviewed the NSIDC Arctic Ice extents here and compared them to the super El Ninos of that started in 1982 and 1997 (1972 predates the NSIDC Arctic ice extent data). I also checked in relation to the moderate El Ninos that started in 1986/87, 1991, 2002 and 2009. I based the choice of these additional events on the NOAA ONI history here.
The results are not statistically evaluated it appears that a significant reduction of the Arctic Summer minimum does not always occur the year after the start of a significant El Nino.
However, there appears to be a significant reduction of the Summer minimum about three years after the start of every significant El Nino. Reduced extents appear in:
That would suggest an Arctic Summer minimum that is lower than 2012 could be expected in 2017 or 2018.
Actually I just realised that this article is talking about the sea level pressure anomalies, which is different to the actual values which I was referring to in my previous post. Even so I'll still be looking at the weather maps with interest.